Little Silver: Fire Incidents, New Jersey (NJ)
Where are fire incidents reported in Little Silver, NJ
Something went wrong! Please refresh the page.
|
| |||||||||||||||||||||||||||||||||||||||||||||||||||||||||||||||||||||||||||||||||||||||||||||||||||||||||||||
2002 - 2018 National Fire Incident Reporting System (NFIRS) incidents
- Incident types reported to NFIRS in Little Silver, NJ
- 30443.8%Hazardous Condition
- 14621.0%False Alarm
- 13920.0%Fire
- 365.2%Good Intent Call
- 344.9%Service Call
- 273.9%Rescue & EMS
- 40.6%Special Incident
- 30.4%Overpressure Rupture
- 10.1%Severe Weather
- Fire incident types reported to NFIRS in Little Silver, NJ
- 8561.2%Structure Fires
- 3223.0%Outside Fires
- 1712.2%Mobile Property/Vehicle Fires
- 53.6%Other
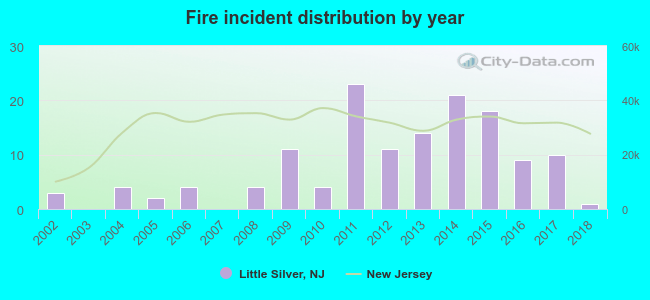 Based on the data from the years 2002 - 2018 the average number of fires per year is 8. The highest number of reported fires - 23 took place in 2011, and the least - 0 in 2003. The data has a decreasing trend.
The average number of yearly fire incidents per 10k residents in Little Silver, NJ compared to nearest cities:
(Note: Based on data for the last 3 years, including only cities with population 5,000 and above)
| Little Silver: | 11.3 |
| Red Bank: | 28.4 |
| Fair Haven: | 13.2 |
| Oceanport: | 26.3 |
| Eatontown: | 35.6 |
| Rumson: | 33.0 |
| West Long Branch: | 4.2 |
| Long Branch: | 29.6 |
| Lincroft: | 19.6 |

 31.7% incidents where reported in the morning and 68.3% in the evening. The most fires (16.5%) took place on Monday, and the least (10.1%) on Tuesday.
 According to the 139 fires from years 2002 - 2018 most fires (12.9%) took place during December, and the least (0.7%) in February.
 Out of all 694 cases reported during the years 2002 - 2018, the most belonged to the categories: Hazardous Condition (43.8%), False Alarm (21.0%), and Fire (20.0%).
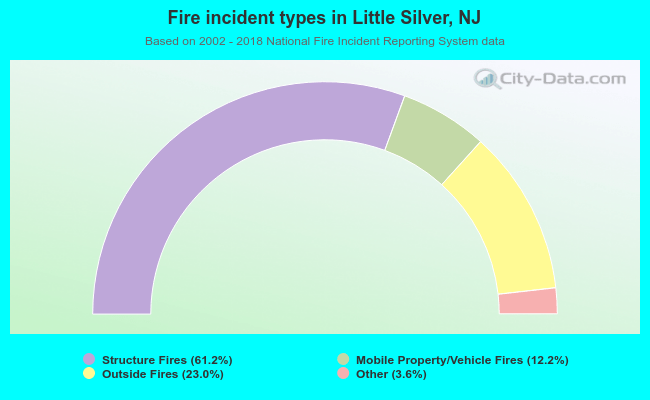 When looking into fire subcategories, the most reports belonged to: Structure Fires (61.2%), and Outside Fires (23.0%).