Nampa: Fire Incidents, Idaho (ID)
Where are fire incidents reported in Nampa, ID
Something went wrong! Please refresh the page.
| Fire incidents reported | |
|---|---|
| Sreet name | Count |
| CALDWELL BLVD | 206 |
| 11TH AVE | 154 |
| MIDDLETON RD | 148 |
| HAPPY VALLEY RD | 142 |
| 2ND ST | 120 |
| 12TH AVENUE RD | 116 |
| KARCHER RD | 116 |
| 1ST ST | 114 |
| AMITY AVE | 114 |
| GREENHURST RD | 114 |
| SOUTHSIDE BLVD | 108 |
| GARRITY BLVD | 100 |
| POWERLINE RD | 98 |
| MIDLAND BLVD | 82 |
| 12TH AVE RD | 78 |
| 3RD ST | 78 |
| FLAMINGO AVE | 74 |
| KINGS RD | 72 |
| AIRPORT RD | 70 |
| FRANKLIN BLVD | 70 |
| MISSOURI AVE | 70 |
| ROOSEVELT AVE | 62 |
| 12TH AVE | 58 |
| ORCHARD AVE | 56 |
| USTICK RD | 56 |
| INTERSTATE 84 FWY | 54 |
| NORTHSIDE BLVD | 54 |
| VICTORY RD | 54 |
| MIDWAY RD | 52 |
| 13TH AVE | 50 |
| Other | 1,842 |
2002 - 2018 National Fire Incident Reporting System (NFIRS) incidents
- Incident types reported to NFIRS in Nampa, ID
- 30,14455.0%Rescue & EMS
- 8,28615.1%Service Call
- 6,72812.3%Good Intent Call
- 4,5828.4%Fire
- 2,5464.6%False Alarm
- 2,4224.4%Hazardous Condition
- Fire incident types reported to NFIRS in Nampa, ID
- 2,18547.7%Outside Fires
- 1,42231.0%Structure Fires
- 87919.2%Mobile Property/Vehicle Fires
- 962.1%Other
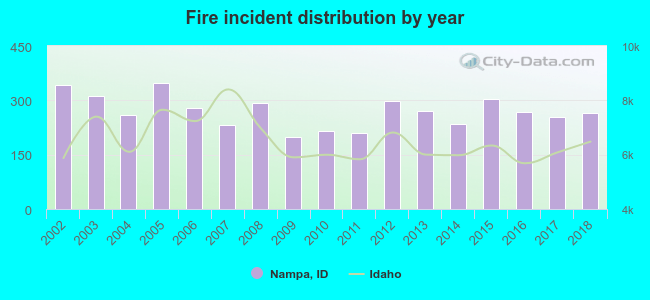 According to the data from the years 2002 - 2018 the average number of fires per year is 270. The highest number of fires - 347 took place in 2005, and the least - 198 in 2009. The data has a decreasing trend.
The average number of yearly fire incidents per 10k residents in Nampa, ID compared to nearest cities:
(Note: Based on data for the last 3 years, including only cities with population 5,000 and above)
| Nampa: | 29.8 |
| Caldwell: | 65.6 |
| Meridian: | 25.0 |
| Star: | 64.4 |
| Kuna: | 53.9 |
| Middleton: | 77.9 |
| Eagle: | 41.0 |
| Garden City: | 28.3 |
| Boise: | 24.6 |
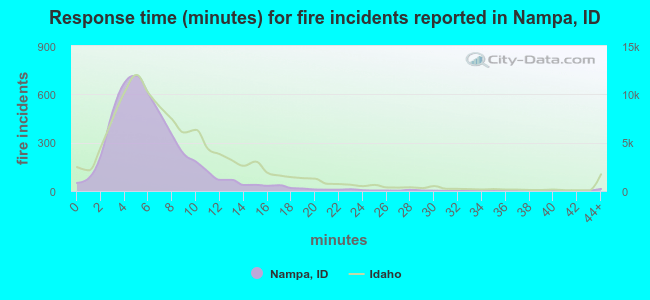 The median response time based on all reported fire incidents is 6 minutes. This is similar to the state median value.
The median response time in Nampa, ID compared to nearest cities:
(Note: Based on data for all years, including only cities with at least 500 fire incidents)
| Nampa: | 6 minutes |
| Caldwell: | 8 minutes |
| Meridian: | 6 minutes |
| Star: | 8 minutes |
| Kuna: | 10 minutes |
| Middleton: | 10 minutes |
| Eagle: | 7 minutes |
| Melba: | 8 minutes |
| Garden City: | 5 minutes |
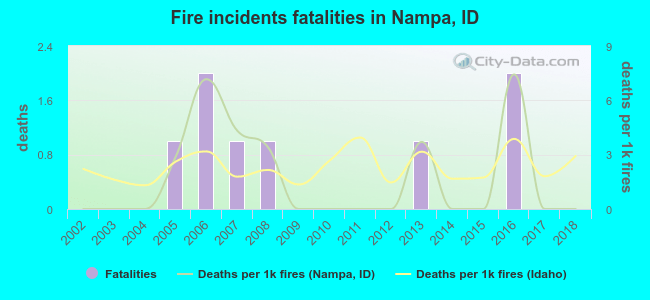 Based on the data from the years 2002 - 2018 the average number of fire-related fatalities per year is 0. The highest number of deaths - 2 took place in 2006, and the lowest - 0 in 2002. The data has a constant trend.
The average number of deaths per 1,000 fires is 2. This indicator was the highest - 7 in 2016, and the lowest 0 in 2002. The trend for fatalities per 1,000 fires is constant. Compared to the state value the number of fatalities per 1,000 fires is lower.
Based on the data from the years 2002 - 2018 the average number of fire-related fatalities per year is 0. The highest number of deaths - 2 took place in 2006, and the lowest - 0 in 2002. The data has a constant trend.
The average number of deaths per 1,000 fires is 2. This indicator was the highest - 7 in 2016, and the lowest 0 in 2002. The trend for fatalities per 1,000 fires is constant. Compared to the state value the number of fatalities per 1,000 fires is lower.
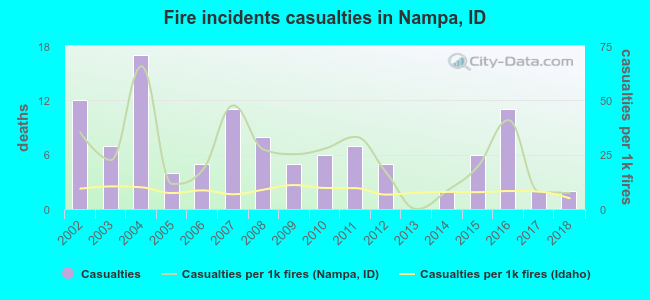 Based on the reports from the years 2002 - 2018 the average number of fire-related casualties per year is 6. The highest number of reported injuries - 17 took place in 2004, and the lowest - 0 in 2013. The data has a declining trend.
The average number of casualties per 1,000 fires is 24. This indicator was the highest - 66 in 2004, and the lowest 0 in 2013. The trend for casualties per 1,000 fires is declining. Compared to the Idaho value the number of injuries per 1,000 incidents is much higher.
Based on the reports from the years 2002 - 2018 the average number of fire-related casualties per year is 6. The highest number of reported injuries - 17 took place in 2004, and the lowest - 0 in 2013. The data has a declining trend.
The average number of casualties per 1,000 fires is 24. This indicator was the highest - 66 in 2004, and the lowest 0 in 2013. The trend for casualties per 1,000 fires is declining. Compared to the Idaho value the number of injuries per 1,000 incidents is much higher.
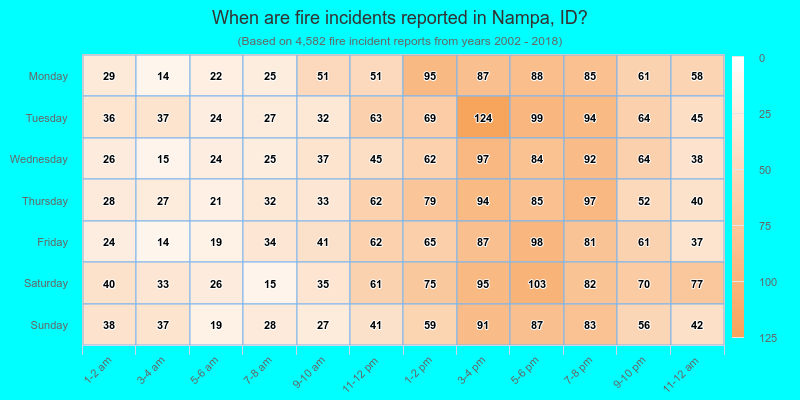
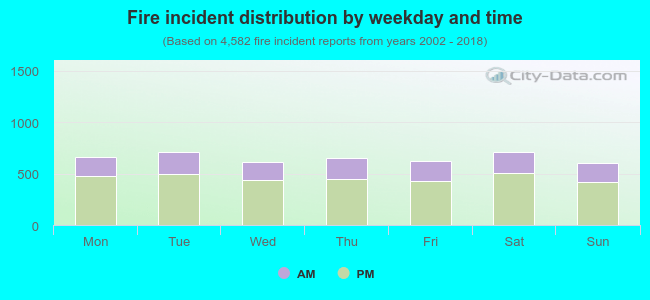 30.1% incidents where reported in the morning and 69.9% in the evening. The most fires (15.6%) took place on Tuesday, and the least (13.3%) on Sunday.
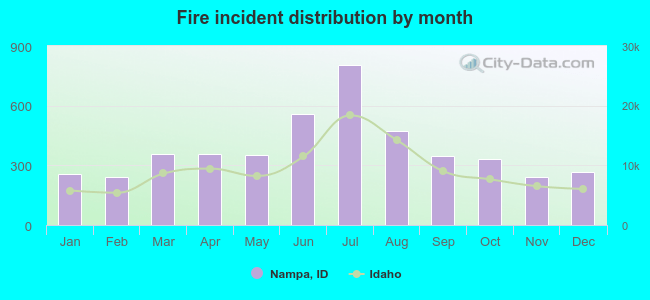 Based on the 4,582 reports from years 2002 - 2018 most fires (17.6%) took place during July, and the least (5.3%) in February.
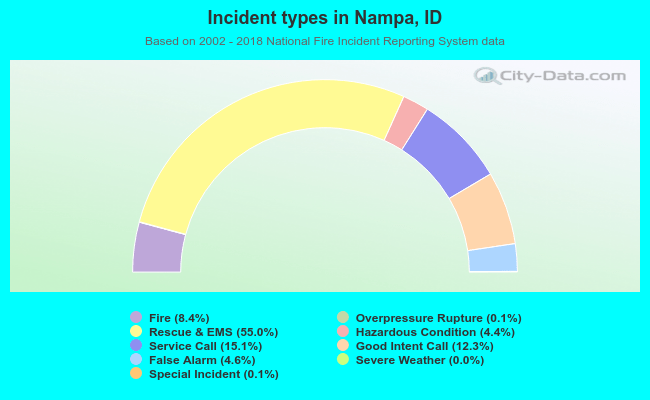 Out of all 54,779 cases reported during the years 2002 - 2018, the most belonged to the categories: Rescue & EMS (55.0%), Service Call (15.1%), and Good Intent Call (12.3%).
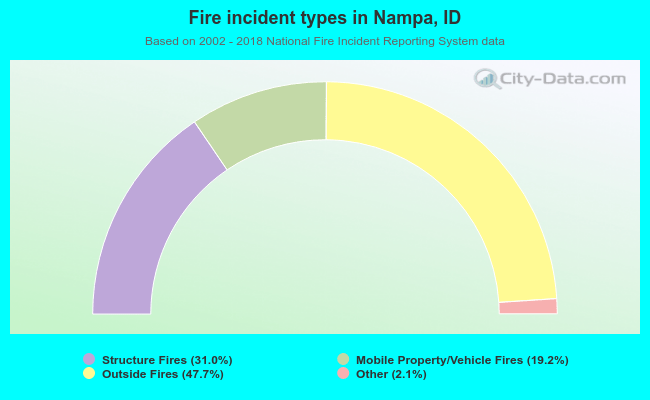 When looking into fire subcategories, the most reports belonged to: Outside Fires (47.7%), and Structure Fires (31.0%).