Melba: Fire Incidents, Idaho (ID)
Where are fire incidents reported in Melba, ID
Something went wrong! Please refresh the page.
|
| |||||||||||||||||||||||||||||||||||||||||||||||||||||||||||||||||||||||||||||||||||||||||||||||||||||||||||||
2002 - 2018 National Fire Incident Reporting System (NFIRS) incidents
- Incident types reported to NFIRS in Melba, ID
- 66850.8%Fire
- 33825.7%Rescue & EMS
- 13410.2%Good Intent Call
- 785.9%Service Call
- 584.4%Hazardous Condition
- 292.2%False Alarm
- 40.3%Special Incident
- 30.2%Overpressure Rupture
- 20.2%Severe Weather
- Fire incident types reported to NFIRS in Melba, ID
- 47170.5%Outside Fires
- 11917.8%Structure Fires
- 548.1%Mobile Property/Vehicle Fires
- 243.6%Other
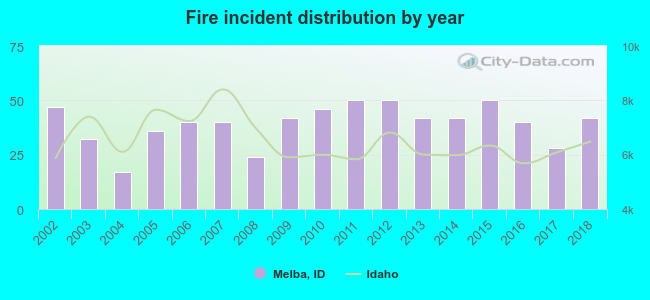 According to the data from the years 2002 - 2018 the average number of fires per year is 39. The highest number of fire incidents - 50 took place in 2011, and the least - 17 in 2004. The data has a declining trend.
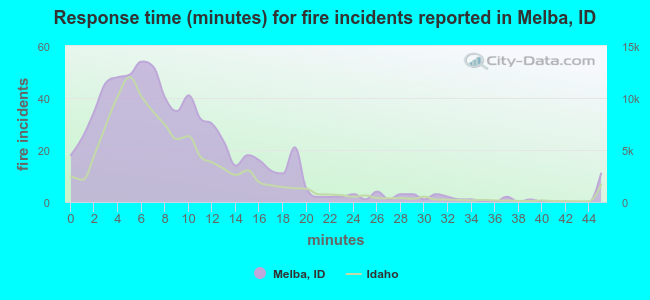 The median response time based on all reported fire incidents is 8 minutes. This is comparable to the Idaho median value.
The median response time in Melba, ID compared to nearest cities:
(Note: Based on data for all years, including only cities with at least 500 fire incidents)
| Melba: | 8 minutes |
| Kuna: | 10 minutes |
| Nampa: | 6 minutes |
| Meridian: | 6 minutes |
| Caldwell: | 8 minutes |
| Boise: | 5 minutes |
| Star: | 8 minutes |
| Garden City: | 5 minutes |
| Middleton: | 10 minutes |
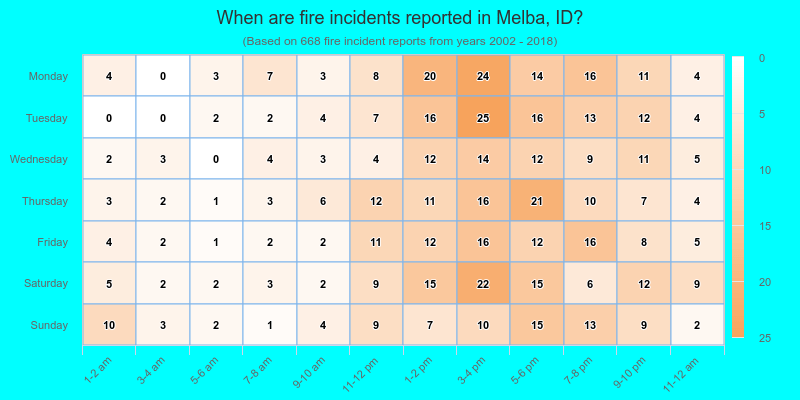
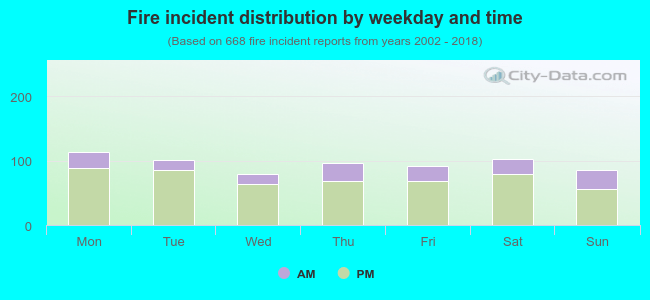 23.5% incidents where reported in the morning and 76.5% in the evening. The most fires (17.1%) took place on Monday, and the least (11.8%) on Wednesday.
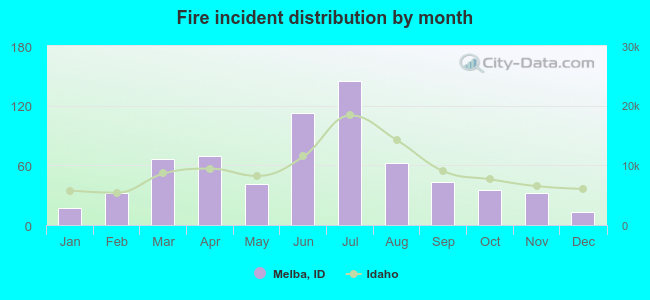 According to the 668 fire incidents from years 2002 - 2018 most fires (21.7%) took place during July, and the least (1.9%) in December.
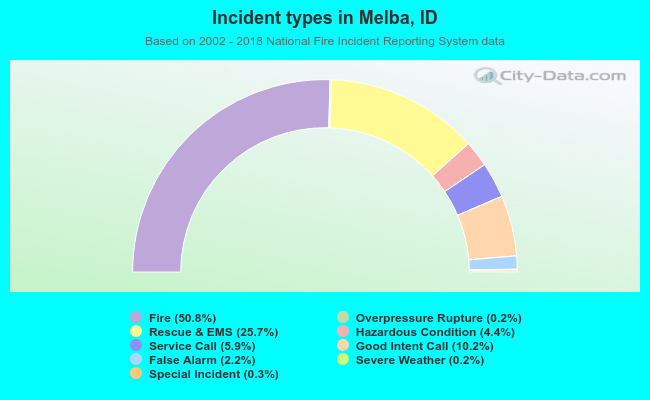 Out of all 1,314 cases reported during the years 2002 - 2018, the most belonged to the categories: Fire (50.8%), Rescue & EMS (25.7%), and Good Intent Call (10.2%).
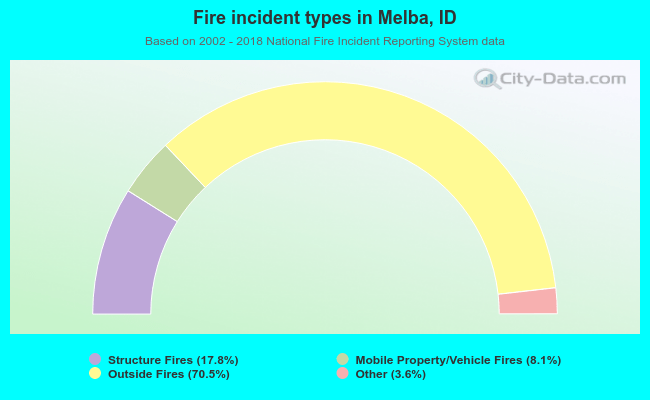 When looking into fire subcategories, the most incidents belonged to: Outside Fires (70.5%), and Structure Fires (17.8%).