Hendersonville: Fire Incidents, North Carolina (NC)
Where are fire incidents reported in Hendersonville, NC
Something went wrong! Please refresh the page.
| Fire incidents reported | |
|---|---|
| Sreet name | Count |
| ASHEVILLE HWY | 114 |
| SUGARLOAF RD | 88 |
| HOWARD GAP RD | 82 |
| CHIMNEY ROCK RD | 78 |
| FOUR SEASONS BLVD | 78 |
| SPARTANBURG HWY | 72 |
| MAIN ST | 68 |
| GREENVILLE HWY | 44 |
| CLEAR CREEK RD | 42 |
| PACE RD | 42 |
| ADELES WAY | 40 |
| 5TH AVE | 38 |
| BROOKSIDE CAMP RD | 38 |
| KANUGA RD. | 36 |
| THOMPSON ST | 36 |
| 6TH AVE | 34 |
| 7TH AVE | 34 |
| KANUGA RD | 34 |
| FRUITLAND RD | 32 |
| OLD SPARTANBURG RD | 28 |
| RIDGE RD | 28 |
| CEDAR BLUFF DR | 26 |
| DUNCAN HILL RD | 24 |
| HAYWOOD RD | 24 |
| 4TH AVE | 22 |
| CHESTNUT GAP RD | 22 |
| HOLBERT RD | 22 |
| JUSTICE ST | 22 |
| LOCUST GROVE RD | 22 |
| CHURCH ST | 20 |
| Other | 2,241 |
2002 - 2018 National Fire Incident Reporting System (NFIRS) incidents
- Incident types reported to NFIRS in Hendersonville, NC
- 26,60052.4%Rescue & EMS
- 7,65515.1%Hazardous Condition
- 6,51212.8%Service Call
- 4,1938.3%Good Intent Call
- 3,5316.9%Fire
- 2,0134.0%False Alarm
- 2010.4%Severe Weather
- 670.1%Special Incident
- Fire incident types reported to NFIRS in Hendersonville, NC
- 1,86052.7%Structure Fires
- 1,06230.1%Outside Fires
- 3449.7%Mobile Property/Vehicle Fires
- 2657.5%Other
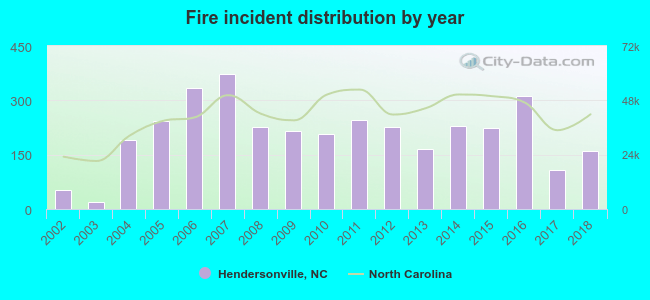 Based on the data from the years 2002 - 2018 the average number of fires per year is 208. The highest number of reported fires - 374 took place in 2007, and the least - 19 in 2003. The data has an increasing trend.
The average number of yearly fire incidents per 10k residents in Hendersonville, NC compared to nearest cities:
(Note: Based on data for the last 3 years, including only cities with population 5,000 and above)
| Hendersonville: | 141.4 |
| Mills River: | 33.9 |
| Etowah: | 17.3 |
| Fletcher: | 69.5 |
| Brevard: | 130.0 |
| Asheville: | 57.3 |
| Black Mountain: | 52.0 |
| Woodfin: | 16.7 |
| Waynesville: | 170.1 |
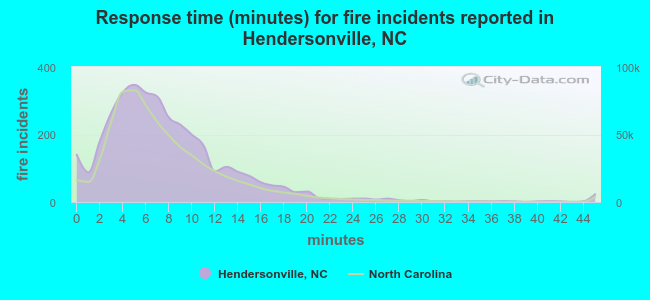 The median response time based on all reported fire incidents is 7 minutes. This is similar to the state median value.
The median response time in Hendersonville, NC compared to nearest cities:
(Note: Based on data for all years, including only cities with at least 500 fire incidents)
| Hendersonville: | 7 minutes |
| East Flat Rock: | 5 minutes |
| Fletcher: | 7 minutes |
| Fairview: | 8 minutes |
| Brevard: | 7 minutes |
| Lake Lure: | 10 minutes |
| Asheville: | 4 minutes |
| Swannanoa: | 8 minutes |
| Black Mountain: | 6 minutes |
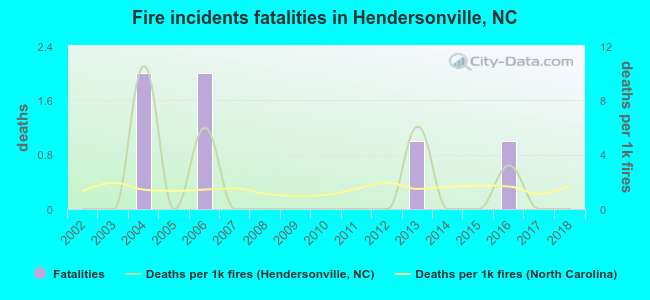 Based on the reports from the years 2002 - 2018 the average number of fire-related fatalities per year is 0. The highest number of reported deaths - 2 took place in 2004, and the lowest - 0 in 2002. The data has a constant trend.
The average number of fatalities per 1,000 fires is 2. This indicator was the highest - 11 in 2004, and the lowest 0 in 2002. The trend for fatalities per 1,000 fires is constant. Compared to the North Carolina value the number of fatalities per 1,000 fire incidents is about the same.
Based on the reports from the years 2002 - 2018 the average number of fire-related fatalities per year is 0. The highest number of reported deaths - 2 took place in 2004, and the lowest - 0 in 2002. The data has a constant trend.
The average number of fatalities per 1,000 fires is 2. This indicator was the highest - 11 in 2004, and the lowest 0 in 2002. The trend for fatalities per 1,000 fires is constant. Compared to the North Carolina value the number of fatalities per 1,000 fire incidents is about the same.Deaths per 1,000 incidents in Hendersonville, NC compared to nearest cities:
(Note: Based on data for all years, including only cities with at least 2,500 fire incidents)
| Hendersonville: | 1.7 |
| Asheville: | 0.9 |
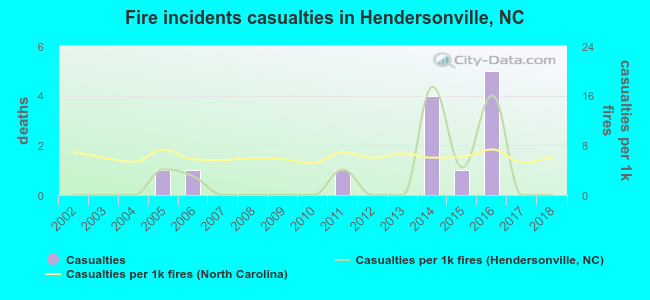 Based on the data from the years 2002 - 2018 the average number of fire-related yearly casualties is 1. The highest number of injuries - 5 took place in 2016, and the lowest - 0 in 2002. The data has a constant trend.
The average number of casualties per 1,000 fire incidents is 3. This indicator was the highest - 17 in 2014, and the lowest 0 in 2002. The trend for casualties per 1,000 incidents is constant. Compared to the state value the number of injuries per 1,000 fire incidents is lower.
Based on the data from the years 2002 - 2018 the average number of fire-related yearly casualties is 1. The highest number of injuries - 5 took place in 2016, and the lowest - 0 in 2002. The data has a constant trend.
The average number of casualties per 1,000 fire incidents is 3. This indicator was the highest - 17 in 2014, and the lowest 0 in 2002. The trend for casualties per 1,000 incidents is constant. Compared to the state value the number of injuries per 1,000 fire incidents is lower.Casualties per 1,000 incidents in Hendersonville, NC compared to nearest cities:
(Note: Based on data for all years, including only cities with at least 500 fire incidents)
| Hendersonville: | 3.7 |
| East Flat Rock: | 3.4 |
| Fletcher: | 3.3 |
| Fairview: | 1.3 |
| Brevard: | 10.8 |
| Lake Lure: | 0.0 |
| Asheville: | 8.6 |
| Swannanoa: | 4.9 |
| Black Mountain: | 12.9 |
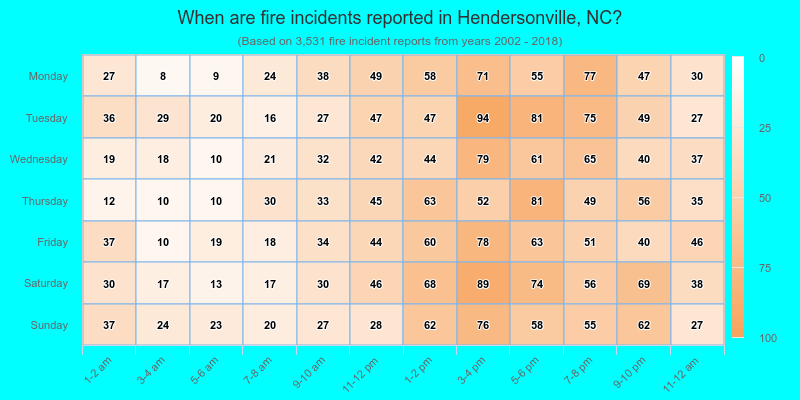
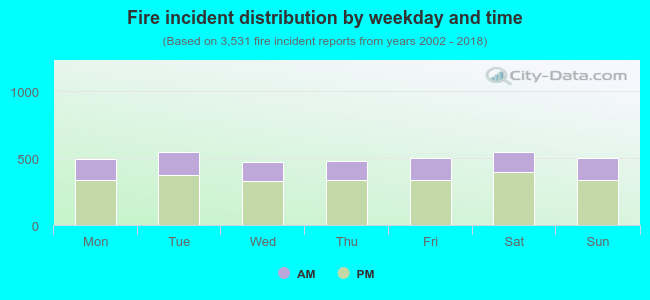 30.8% incidents where reported in the morning and 69.2% in the evening. The most fires (15.5%) took place on Tuesday, and the least (13.3%) on Wednesday.
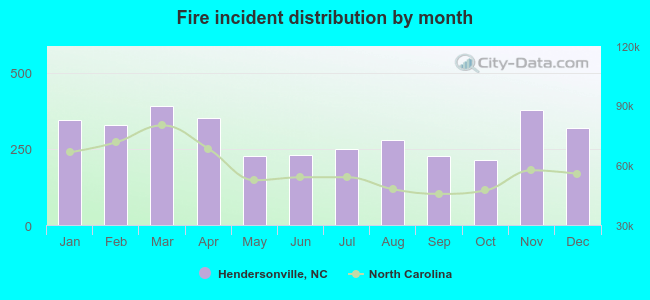 According to the 3,531 fires from years 2002 - 2018 most fires (11.1%) took place during March, and the least (6.0%) in October.
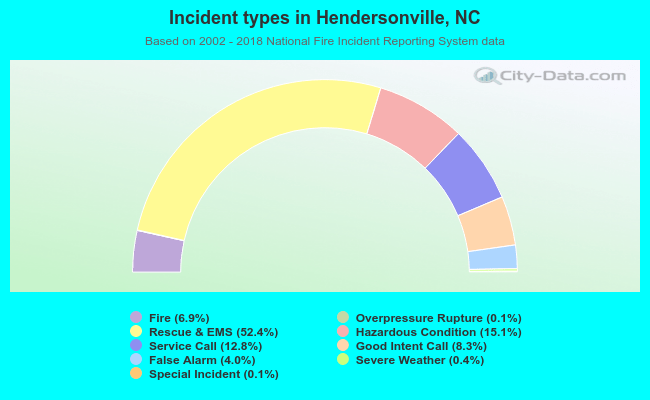 Out of all 50,806 cases reported during the years 2002 - 2018, the most belonged to the categories: Rescue & EMS (52.4%), Hazardous Condition (15.1%), and Service Call (12.8%).
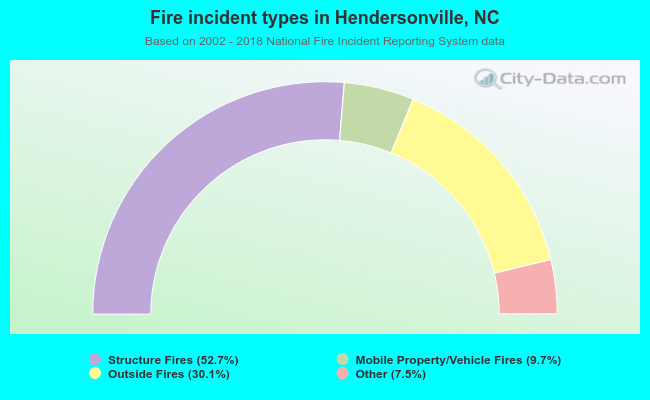 When looking into fire subcategories, the most reports belonged to: Structure Fires (52.7%), and Outside Fires (30.1%).