Brevard: Fire Incidents, North Carolina (NC)
Where are fire incidents reported in Brevard, NC
Something went wrong! Please refresh the page.
| Fire incidents reported | |
|---|---|
| Sreet name | Count |
| ASHEVILLE HWY | 108 |
| BROAD ST | 72 |
| MAIN ST | 72 |
| COUNTRY CLUB RD | 54 |
| ROSMAN HWY | 52 |
| GREENVILLE HWY | 50 |
| PROBART ST | 50 |
| TORES DR | 50 |
| CASHIERS VALLEY RD | 48 |
| HOSPITAL DR | 42 |
| OLD HENDERSONVILLE HWY | 42 |
| ISLAND FORD RD | 38 |
| COLLEGE ROW | 36 |
| KINGS CREEK LOOP | 34 |
| EAST FORK RD | 30 |
| SEE OFF MOUNTAIN RD | 30 |
| UNITY DR | 30 |
| WHITMIRE ST | 28 |
| CALDWELL ST | 26 |
| FRENCH BROAD ST | 24 |
| JORDAN ST | 24 |
| MORRIS RD | 24 |
| BECKY MOUNTAIN RD | 22 |
| DUCKWORTH AVE | 22 |
| ECUSTA RD | 20 |
| ILLAHEE RD | 20 |
| SHERWOOD RIDGE RD | 20 |
| U S 276 HWY | 20 |
| CAMPUS DR | 18 |
| FOREST GATE DR | 18 |
| Other | 535 |
2004 - 2018 National Fire Incident Reporting System (NFIRS) incidents
- Incident types reported to NFIRS in Brevard, NC
- 2,17627.2%Hazardous Condition
- 1,88623.6%Rescue & EMS
- 1,65920.7%Fire
- 1,04113.0%Service Call
- 6167.7%False Alarm
- 4235.3%Good Intent Call
- 1481.8%Special Incident
- 440.5%Severe Weather
- 140.2%Overpressure Rupture
- Fire incident types reported to NFIRS in Brevard, NC
- 1,17971.1%Structure Fires
- 30718.5%Outside Fires
- 1328.0%Mobile Property/Vehicle Fires
- 412.5%Other
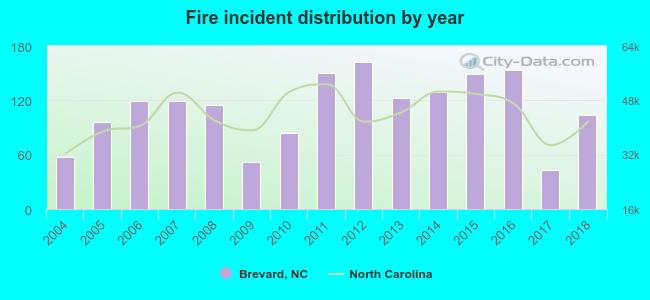 Based on the data from the years 2004 - 2018 the average number of fire incidents per year is 110. The highest number of reported fire incidents - 162 took place in 2012, and the least - 43 in 2017. The data has an increasing trend.
The average number of yearly fire incidents per 10k residents in Brevard, NC compared to nearest cities:
(Note: Based on data for the last 3 years, including only cities with population 5,000 and above)
| Brevard: | 130.0 |
| Etowah: | 17.3 |
| Mills River: | 33.9 |
| Hendersonville: | 141.4 |
| Fletcher: | 69.5 |
| Waynesville: | 170.1 |
| Asheville: | 57.3 |
| Cullowhee: | 21.9 |
| Woodfin: | 16.7 |
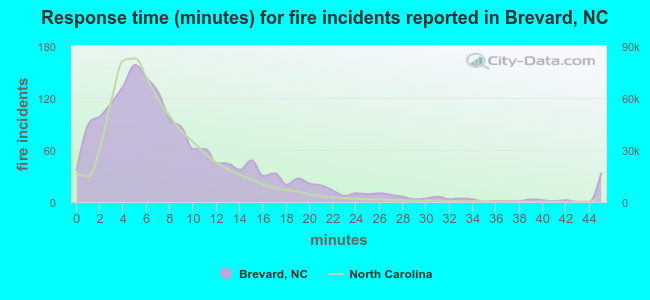 The median response time based on all reported fire incidents is 7 minutes. This is similar to the state median value.
The median response time in Brevard, NC compared to nearest cities:
(Note: Based on data for all years, including only cities with at least 500 fire incidents)
| Brevard: | 7 minutes |
| Hendersonville: | 7 minutes |
| East Flat Rock: | 5 minutes |
| Fletcher: | 7 minutes |
| Canton: | 9 minutes |
| Waynesville: | 9 minutes |
| Clyde: | 10 minutes |
| Asheville: | 4 minutes |
| Fairview: | 8 minutes |
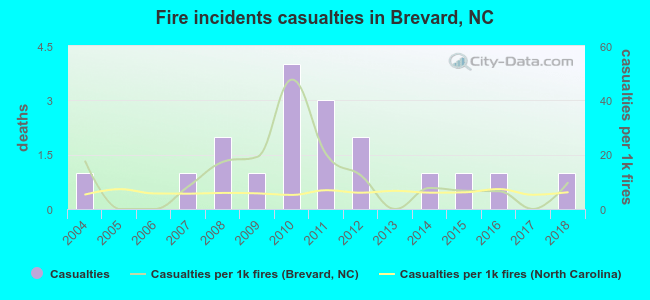 According to the reports from the years 2004 - 2018 the average number of fire-related casualties per year is 1. The highest number of injuries - 4 took place in 2010, and the lowest - 0 in 2005. The data has a constant trend.
The average number of injuries per 1,000 fires is 12. This indicator was the highest - 48 in 2010, and the lowest 0 in 2005. The trend for casualties per 1,000 incidents is declining. Compared to the North Carolina value the number of casualties per 1,000 fires is higher.
According to the reports from the years 2004 - 2018 the average number of fire-related casualties per year is 1. The highest number of injuries - 4 took place in 2010, and the lowest - 0 in 2005. The data has a constant trend.
The average number of injuries per 1,000 fires is 12. This indicator was the highest - 48 in 2010, and the lowest 0 in 2005. The trend for casualties per 1,000 incidents is declining. Compared to the North Carolina value the number of casualties per 1,000 fires is higher.Casualties per 1,000 incidents in Brevard, NC compared to nearest cities:
(Note: Based on data for all years, including only cities with at least 500 fire incidents)
| Brevard: | 10.8 |
| Hendersonville: | 3.7 |
| East Flat Rock: | 3.4 |
| Fletcher: | 3.3 |
| Canton: | 10.6 |
| Waynesville: | 3.1 |
| Clyde: | 0.0 |
| Asheville: | 8.6 |
| Fairview: | 1.3 |
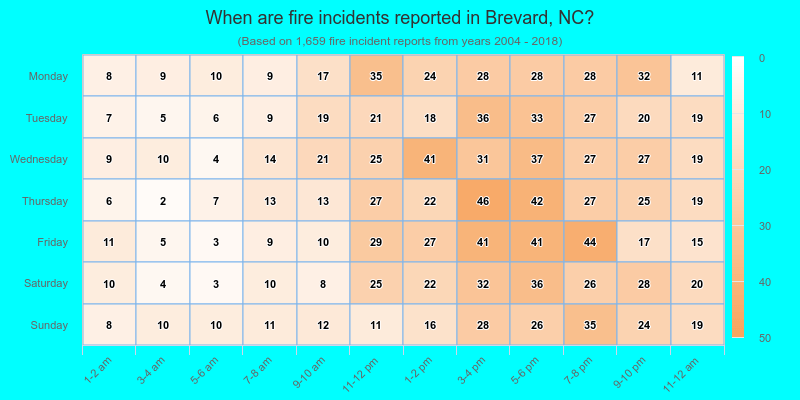
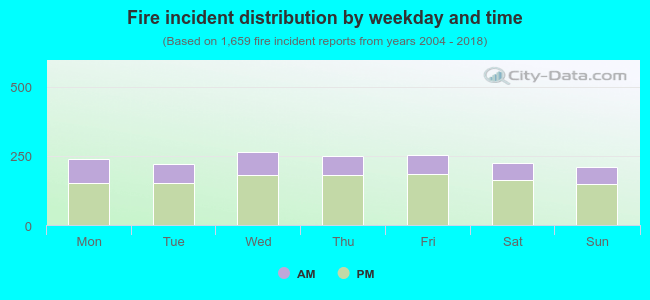 29.8% incidents where reported in the morning and 70.2% in the evening. The most fires (16.0%) took place on Wednesday, and the least (12.7%) on Sunday.
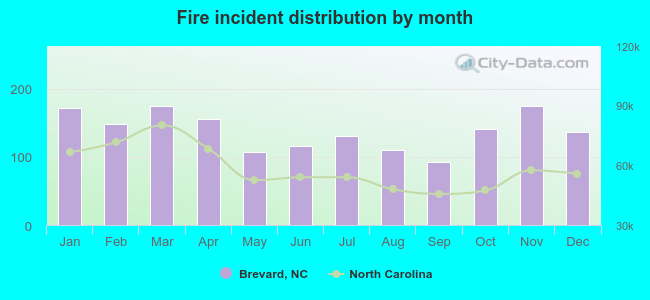 According to the 1,659 incident reports from years 2004 - 2018 most fires (10.5%) took place during March, and the least (5.6%) in September.
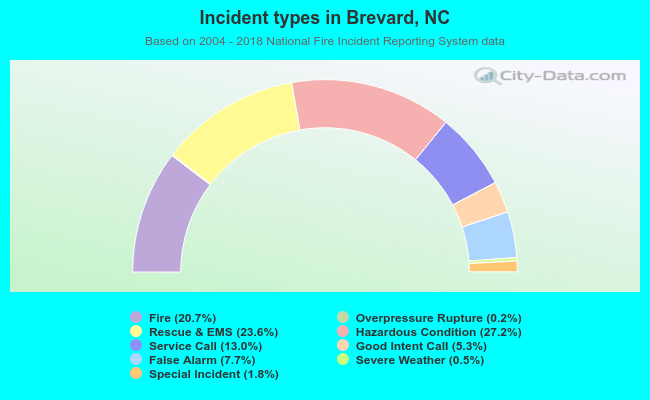 Out of all 8,007 cases reported during the years 2004 - 2018, the most belonged to the categories: Hazardous Condition (27.2%), Rescue & EMS (23.6%), and Fire (20.7%).
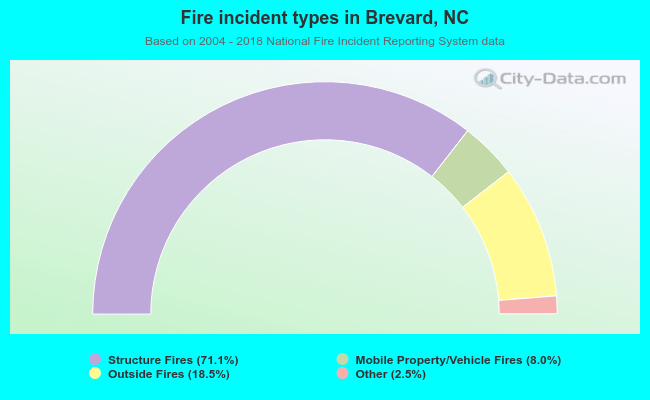 When looking into fire subcategories, the most incidents belonged to: Structure Fires (71.1%), and Outside Fires (18.5%).