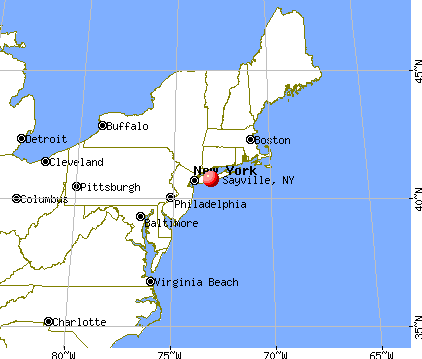
Sayville, New York Submit your own pictures of this place and show them to the world
OSM Map
General Map
Google Map
MSN Map
OSM Map
General Map
Google Map
MSN Map
OSM Map
General Map
Google Map
MSN Map
OSM Map
General Map
Google Map
MSN Map
Please wait while loading the map...
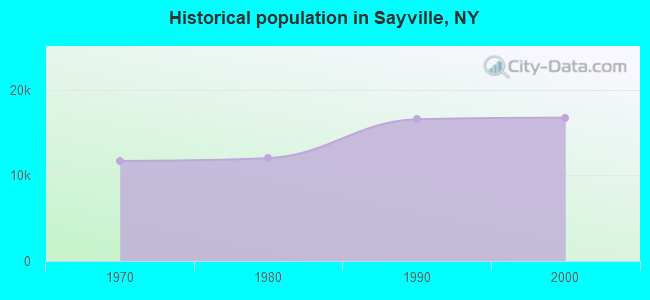
Population in 2010: 16,853. Population change since 2000: +0.7%Males: 8,339 Females: 8,514
March 2022 cost of living index in Sayville: 151.3 (very high, U.S. average is 100) Percentage of residents living in poverty in 2022: 4.3%for White Non-Hispanic residents , 50.0% for Black residents , 1.4% for Hispanic or Latino residents )
Profiles of local businesses
Business Search - 14 Million verified businesses
Data:
Median household income ($)
Median household income (% change since 2000)
Household income diversity
Ratio of average income to average house value (%)
Ratio of average income to average rent
Median household income ($) - White
Median household income ($) - Black or African American
Median household income ($) - Asian
Median household income ($) - Hispanic or Latino
Median household income ($) - American Indian and Alaska Native
Median household income ($) - Multirace
Median household income ($) - Other Race
Median household income for houses/condos with a mortgage ($)
Median household income for apartments without a mortgage ($)
Races - White alone (%)
Races - White alone (% change since 2000)
Races - Black alone (%)
Races - Black alone (% change since 2000)
Races - American Indian alone (%)
Races - American Indian alone (% change since 2000)
Races - Asian alone (%)
Races - Asian alone (% change since 2000)
Races - Hispanic (%)
Races - Hispanic (% change since 2000)
Races - Native Hawaiian and Other Pacific Islander alone (%)
Races - Native Hawaiian and Other Pacific Islander alone (% change since 2000)
Races - Two or more races (%)
Races - Two or more races (% change since 2000)
Races - Other race alone (%)
Races - Other race alone (% change since 2000)
Racial diversity
Unemployment (%)
Unemployment (% change since 2000)
Unemployment (%) - White
Unemployment (%) - Black or African American
Unemployment (%) - Asian
Unemployment (%) - Hispanic or Latino
Unemployment (%) - American Indian and Alaska Native
Unemployment (%) - Multirace
Unemployment (%) - Other Race
Population density (people per square mile)
Population - Males (%)
Population - Females (%)
Population - Males (%) - White
Population - Males (%) - Black or African American
Population - Males (%) - Asian
Population - Males (%) - Hispanic or Latino
Population - Males (%) - American Indian and Alaska Native
Population - Males (%) - Multirace
Population - Males (%) - Other Race
Population - Females (%) - White
Population - Females (%) - Black or African American
Population - Females (%) - Asian
Population - Females (%) - Hispanic or Latino
Population - Females (%) - American Indian and Alaska Native
Population - Females (%) - Multirace
Population - Females (%) - Other Race
Coronavirus confirmed cases (Jul 02, 2024)
Deaths caused by coronavirus (Jul 02, 2024)
Coronavirus confirmed cases (per 100k population) (Jul 02, 2024)
Deaths caused by coronavirus (per 100k population) (Jul 02, 2024)
Daily increase in number of cases (Jul 02, 2024)
Weekly increase in number of cases (Jul 02, 2024)
Cases doubled (in days) (Jul 02, 2024)
Hospitalized patients (Apr 18, 2022)
Negative test results (Apr 18, 2022)
Total test results (Apr 18, 2022)
COVID Vaccine doses distributed (per 100k population) (Sep 19, 2023)
COVID Vaccine doses administered (per 100k population) (Sep 19, 2023)
COVID Vaccine doses distributed (Sep 19, 2023)
COVID Vaccine doses administered (Sep 19, 2023)
Likely homosexual households (%)
Likely homosexual households (% change since 2000)
Likely homosexual households - Lesbian couples (%)
Likely homosexual households - Lesbian couples (% change since 2000)
Likely homosexual households - Gay men (%)
Likely homosexual households - Gay men (% change since 2000)
Cost of living index
Median gross rent ($)
Median contract rent ($)
Median monthly housing costs ($)
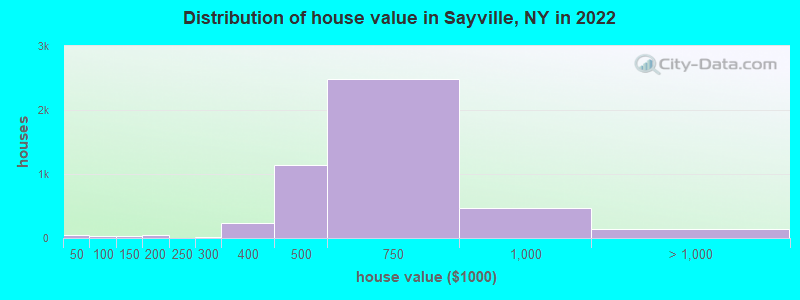
Median house or condo value ($)
Median house or condo value ($ change since 2000)
Mean house or condo value by units in structure - 1, detached ($)
Mean house or condo value by units in structure - 1, attached ($)
Mean house or condo value by units in structure - 2 ($)
Mean house or condo value by units in structure by units in structure - 3 or 4 ($)
Mean house or condo value by units in structure - 5 or more ($)
Mean house or condo value by units in structure - Boat, RV, van, etc. ($)
Mean house or condo value by units in structure - Mobile home ($)
Median house or condo value ($) - White
Median house or condo value ($) - Black or African American
Median house or condo value ($) - Asian
Median house or condo value ($) - Hispanic or Latino
Median house or condo value ($) - American Indian and Alaska Native
Median house or condo value ($) - Multirace
Median house or condo value ($) - Other Race
Median resident age
Resident age diversity
Median resident age - Males
Median resident age - Females
Median resident age - White
Median resident age - Black or African American
Median resident age - Asian
Median resident age - Hispanic or Latino
Median resident age - American Indian and Alaska Native
Median resident age - Multirace
Median resident age - Other Race
Median resident age - Males - White
Median resident age - Males - Black or African American
Median resident age - Males - Asian
Median resident age - Males - Hispanic or Latino
Median resident age - Males - American Indian and Alaska Native
Median resident age - Males - Multirace
Median resident age - Males - Other Race
Median resident age - Females - White
Median resident age - Females - Black or African American
Median resident age - Females - Asian
Median resident age - Females - Hispanic or Latino
Median resident age - Females - American Indian and Alaska Native
Median resident age - Females - Multirace
Median resident age - Females - Other Race
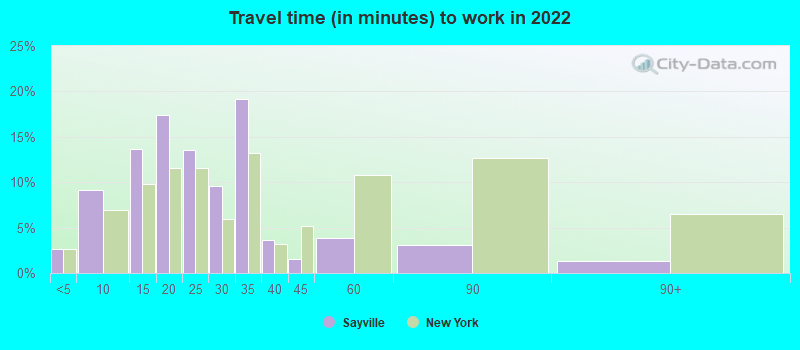
Commute - mean travel time to work (minutes)
Travel time to work - Less than 5 minutes (%)
Travel time to work - Less than 5 minutes (% change since 2000)
Travel time to work - 5 to 9 minutes (%)
Travel time to work - 5 to 9 minutes (% change since 2000)
Travel time to work - 10 to 19 minutes (%)
Travel time to work - 10 to 19 minutes (% change since 2000)
Travel time to work - 20 to 29 minutes (%)
Travel time to work - 20 to 29 minutes (% change since 2000)
Travel time to work - 30 to 39 minutes (%)
Travel time to work - 30 to 39 minutes (% change since 2000)
Travel time to work - 40 to 59 minutes (%)
Travel time to work - 40 to 59 minutes (% change since 2000)
Travel time to work - 60 to 89 minutes (%)
Travel time to work - 60 to 89 minutes (% change since 2000)
Travel time to work - 90 or more minutes (%)
Travel time to work - 90 or more minutes (% change since 2000)
Marital status - Never married (%)
Marital status - Now married (%)
Marital status - Separated (%)
Marital status - Widowed (%)
Marital status - Divorced (%)
Median family income ($)
Median family income (% change since 2000)
Median non-family income ($)
Median non-family income (% change since 2000)
Median per capita income ($)
Median per capita income (% change since 2000)
Median family income ($) - White
Median family income ($) - Black or African American
Median family income ($) - Asian
Median family income ($) - Hispanic or Latino
Median family income ($) - American Indian and Alaska Native
Median family income ($) - Multirace
Median family income ($) - Other Race
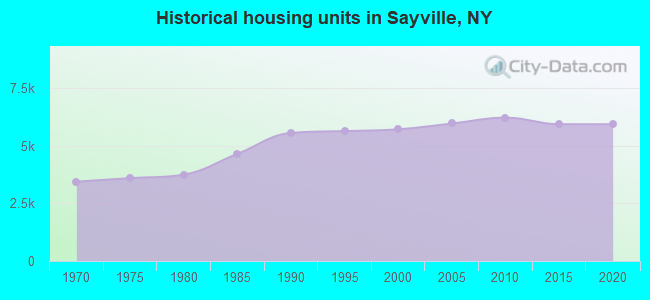
Median year house/condo built
Median year apartment built
Year house built - Built 2005 or later (%)
Year house built - Built 2000 to 2004 (%)
Year house built - Built 1990 to 1999 (%)
Year house built - Built 1980 to 1989 (%)
Year house built - Built 1970 to 1979 (%)
Year house built - Built 1960 to 1969 (%)
Year house built - Built 1950 to 1959 (%)
Year house built - Built 1940 to 1949 (%)
Year house built - Built 1939 or earlier (%)
Average household size
Household density (households per square mile)
Average household size - White
Average household size - Black or African American
Average household size - Asian
Average household size - Hispanic or Latino
Average household size - American Indian and Alaska Native
Average household size - Multirace
Average household size - Other Race
Occupied housing units (%)
Vacant housing units (%)
Owner occupied housing units (%)
Renter occupied housing units (%)
Vacancy status - For rent (%)
Vacancy status - For sale only (%)
Vacancy status - Rented or sold, not occupied (%)
Vacancy status - For seasonal, recreational, or occasional use (%)
Vacancy status - For migrant workers (%)
Vacancy status - Other vacant (%)
Residents with income below the poverty level (%)
Residents with income below 50% of the poverty level (%)
Children below poverty level (%)
Poor families by family type - Married-couple family (%)
Poor families by family type - Male, no wife present (%)
Poor families by family type - Female, no husband present (%)
Poverty status for native-born residents (%)
Poverty status for foreign-born residents (%)
Poverty among high school graduates not in families (%)
Poverty among people who did not graduate high school not in families (%)
Residents with income below the poverty level (%) - White
Residents with income below the poverty level (%) - Black or African American
Residents with income below the poverty level (%) - Asian
Residents with income below the poverty level (%) - Hispanic or Latino
Residents with income below the poverty level (%) - American Indian and Alaska Native
Residents with income below the poverty level (%) - Multirace
Residents with income below the poverty level (%) - Other Race
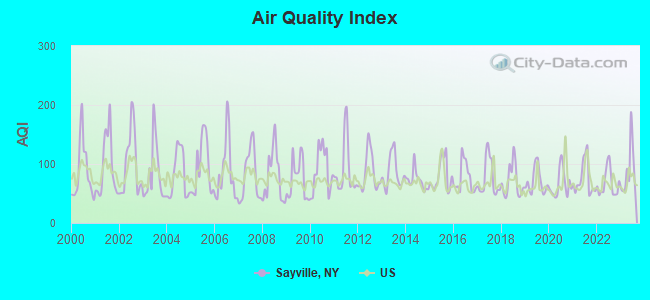
Air pollution - Air Quality Index (AQI)
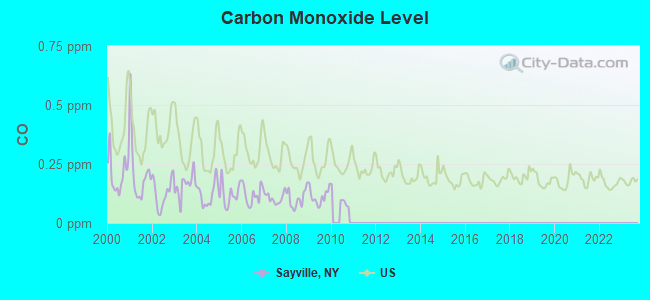
Air pollution - CO
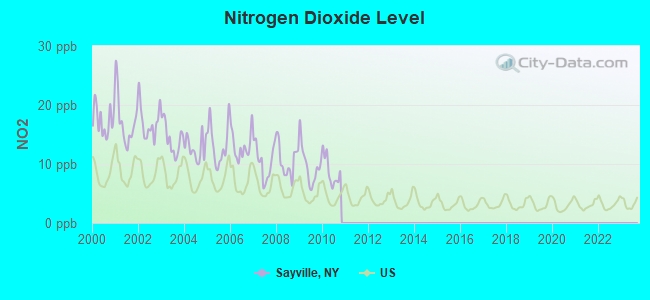
Air pollution - NO2
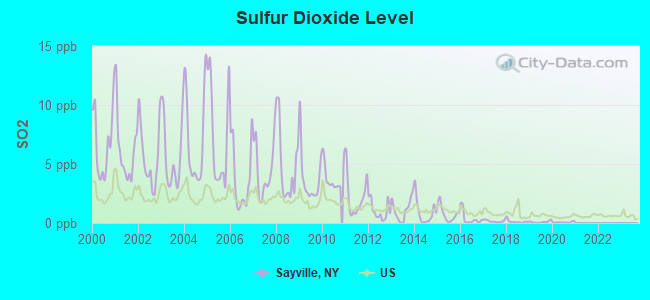
Air pollution - SO2
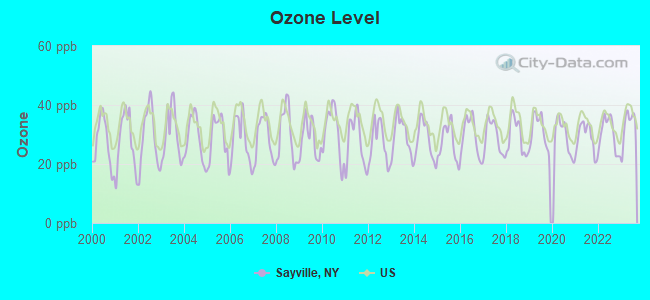
Air pollution - Ozone
Air pollution - PM10
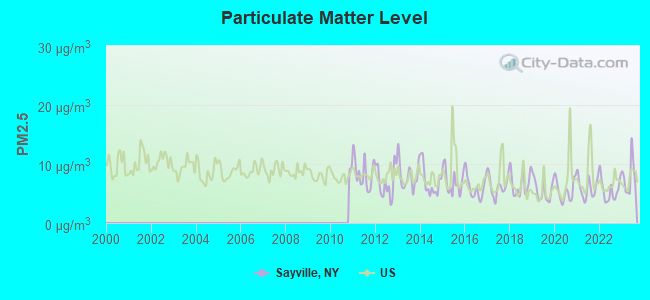
Air pollution - PM25
Air pollution - Pb
Crime - Murders per 100,000 population
Crime - Rapes per 100,000 population
Crime - Robberies per 100,000 population
Crime - Assaults per 100,000 population
Crime - Burglaries per 100,000 population
Crime - Thefts per 100,000 population
Crime - Auto thefts per 100,000 population
Crime - Arson per 100,000 population
Crime - City-data.com crime index
Crime - Violent crime index
Crime - Property crime index
Crime - Murders per 100,000 population (5 year average)
Crime - Rapes per 100,000 population (5 year average)
Crime - Robberies per 100,000 population (5 year average)
Crime - Assaults per 100,000 population (5 year average)
Crime - Burglaries per 100,000 population (5 year average)
Crime - Thefts per 100,000 population (5 year average)
Crime - Auto thefts per 100,000 population (5 year average)
Crime - Arson per 100,000 population (5 year average)
Crime - City-data.com crime index (5 year average)
Crime - Violent crime index (5 year average)
Crime - Property crime index (5 year average)
1996 Presidential Elections Results (%) - Democratic Party (Clinton)
1996 Presidential Elections Results (%) - Republican Party (Dole)
1996 Presidential Elections Results (%) - Other
2000 Presidential Elections Results (%) - Democratic Party (Gore)
2000 Presidential Elections Results (%) - Republican Party (Bush)
2000 Presidential Elections Results (%) - Other
2004 Presidential Elections Results (%) - Democratic Party (Kerry)
2004 Presidential Elections Results (%) - Republican Party (Bush)
2004 Presidential Elections Results (%) - Other
2008 Presidential Elections Results (%) - Democratic Party (Obama)
2008 Presidential Elections Results (%) - Republican Party (McCain)
2008 Presidential Elections Results (%) - Other
2012 Presidential Elections Results (%) - Democratic Party (Obama)
2012 Presidential Elections Results (%) - Republican Party (Romney)
2012 Presidential Elections Results (%) - Other
2016 Presidential Elections Results (%) - Democratic Party (Clinton)
2016 Presidential Elections Results (%) - Republican Party (Trump)
2016 Presidential Elections Results (%) - Other
2020 Presidential Elections Results (%) - Democratic Party (Biden)
2020 Presidential Elections Results (%) - Republican Party (Trump)
2020 Presidential Elections Results (%) - Other
Ancestries Reported - Arab (%)
Ancestries Reported - Czech (%)
Ancestries Reported - Danish (%)
Ancestries Reported - Dutch (%)
Ancestries Reported - English (%)
Ancestries Reported - French (%)
Ancestries Reported - French Canadian (%)
Ancestries Reported - German (%)
Ancestries Reported - Greek (%)
Ancestries Reported - Hungarian (%)
Ancestries Reported - Irish (%)
Ancestries Reported - Italian (%)
Ancestries Reported - Lithuanian (%)
Ancestries Reported - Norwegian (%)
Ancestries Reported - Polish (%)
Ancestries Reported - Portuguese (%)
Ancestries Reported - Russian (%)
Ancestries Reported - Scotch-Irish (%)
Ancestries Reported - Scottish (%)
Ancestries Reported - Slovak (%)
Ancestries Reported - Subsaharan African (%)
Ancestries Reported - Swedish (%)
Ancestries Reported - Swiss (%)
Ancestries Reported - Ukrainian (%)
Ancestries Reported - United States (%)
Ancestries Reported - Welsh (%)
Ancestries Reported - West Indian (%)
Ancestries Reported - Other (%)
Educational Attainment - No schooling completed (%)
Educational Attainment - Less than high school (%)
Educational Attainment - High school or equivalent (%)
Educational Attainment - Less than 1 year of college (%)
Educational Attainment - 1 or more years of college (%)
Educational Attainment - Associate degree (%)
Educational Attainment - Bachelor's degree (%)
Educational Attainment - Master's degree (%)
Educational Attainment - Professional school degree (%)
Educational Attainment - Doctorate degree (%)
School Enrollment - Nursery, preschool (%)
School Enrollment - Kindergarten (%)
School Enrollment - Grade 1 to 4 (%)
School Enrollment - Grade 5 to 8 (%)
School Enrollment - Grade 9 to 12 (%)
School Enrollment - College undergrad (%)
School Enrollment - Graduate or professional (%)
School Enrollment - Not enrolled in school (%)
School enrollment - Public schools (%)
School enrollment - Private schools (%)
School enrollment - Not enrolled (%)
Median number of rooms in houses and condos
Median number of rooms in apartments
Housing units lacking complete plumbing facilities (%)
Housing units lacking complete kitchen facilities (%)
Density of houses
Urban houses (%)
Rural houses (%)
Households with people 60 years and over (%)
Households with people 65 years and over (%)
Households with people 75 years and over (%)
Households with one or more nonrelatives (%)
Households with no nonrelatives (%)
Population in households (%)
Family households (%)
Nonfamily households (%)
Population in families (%)
Family households with own children (%)
Median number of bedrooms in owner occupied houses
Mean number of bedrooms in owner occupied houses
Median number of bedrooms in renter occupied houses
Mean number of bedrooms in renter occupied houses
Median number of vehichles in owner occupied houses
Mean number of vehichles in owner occupied houses
Median number of vehichles in renter occupied houses
Mean number of vehichles in renter occupied houses
Mortgage status - with mortgage (%)
Mortgage status - with second mortgage (%)
Mortgage status - with home equity loan (%)
Mortgage status - with both second mortgage and home equity loan (%)
Mortgage status - without a mortgage (%)
Average family size
Average family size - White
Average family size - Black or African American
Average family size - Asian
Average family size - Hispanic or Latino
Average family size - American Indian and Alaska Native
Average family size - Multirace
Average family size - Other Race
Geographical mobility - Same house 1 year ago (%)
Geographical mobility - Moved within same county (%)
Geographical mobility - Moved from different county within same state (%)
Geographical mobility - Moved from different state (%)
Geographical mobility - Moved from abroad (%)
Place of birth - Born in state of residence (%)
Place of birth - Born in other state (%)
Place of birth - Native, outside of US (%)
Place of birth - Foreign born (%)
Housing units in structures - 1, detached (%)
Housing units in structures - 1, attached (%)
Housing units in structures - 2 (%)
Housing units in structures - 3 or 4 (%)
Housing units in structures - 5 to 9 (%)
Housing units in structures - 10 to 19 (%)
Housing units in structures - 20 to 49 (%)
Housing units in structures - 50 or more (%)
Housing units in structures - Mobile home (%)
Housing units in structures - Boat, RV, van, etc. (%)
House/condo owner moved in on average (years ago)
Renter moved in on average (years ago)
Year householder moved into unit - Moved in 1999 to March 2000 (%)
Year householder moved into unit - Moved in 1995 to 1998 (%)
Year householder moved into unit - Moved in 1990 to 1994 (%)
Year householder moved into unit - Moved in 1980 to 1989 (%)
Year householder moved into unit - Moved in 1970 to 1979 (%)
Year householder moved into unit - Moved in 1969 or earlier (%)
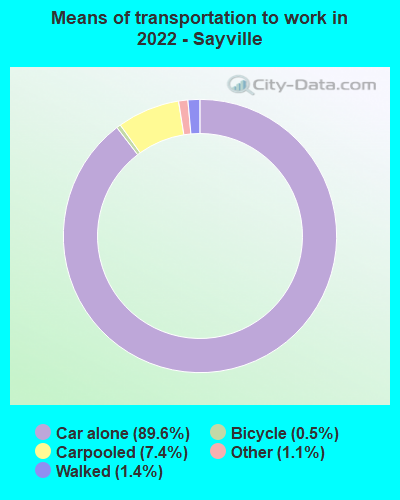
Means of transportation to work - Drove car alone (%)
Means of transportation to work - Carpooled (%)
Means of transportation to work - Public transportation (%)
Means of transportation to work - Bus or trolley bus (%)
Means of transportation to work - Streetcar or trolley car (%)
Means of transportation to work - Subway or elevated (%)
Means of transportation to work - Railroad (%)
Means of transportation to work - Ferryboat (%)
Means of transportation to work - Taxicab (%)
Means of transportation to work - Motorcycle (%)
Means of transportation to work - Bicycle (%)
Means of transportation to work - Walked (%)
Means of transportation to work - Other means (%)
Working at home (%)
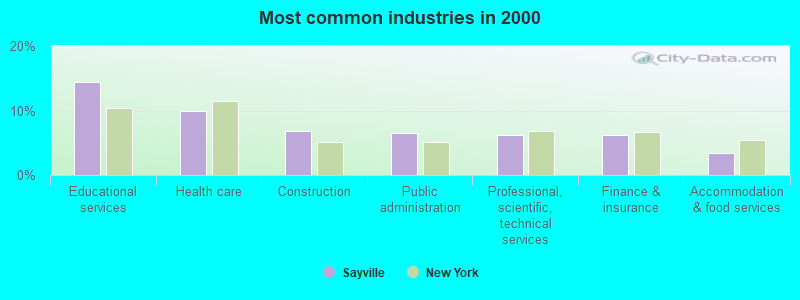
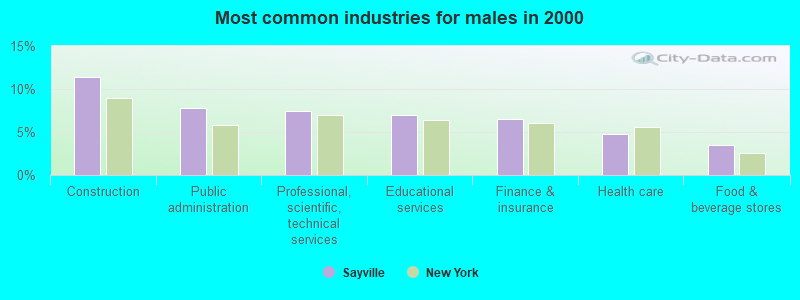
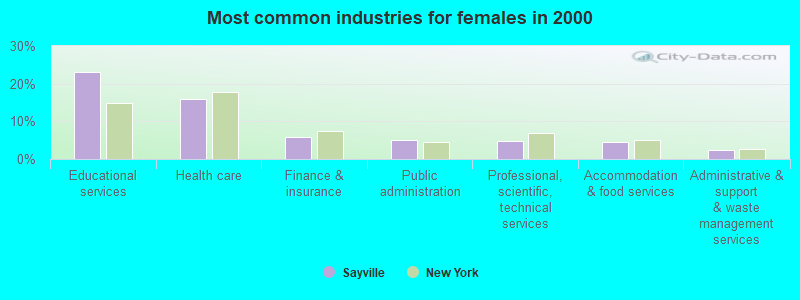
Industry diversity
Most Common Industries - Agriculture, forestry, fishing and hunting, and mining (%)
Most Common Industries - Agriculture, forestry, fishing and hunting (%)
Most Common Industries - Mining, quarrying, and oil and gas extraction (%)
Most Common Industries - Construction (%)
Most Common Industries - Manufacturing (%)
Most Common Industries - Wholesale trade (%)
Most Common Industries - Retail trade (%)
Most Common Industries - Transportation and warehousing, and utilities (%)
Most Common Industries - Transportation and warehousing (%)
Most Common Industries - Utilities (%)
Most Common Industries - Information (%)
Most Common Industries - Finance and insurance, and real estate and rental and leasing (%)
Most Common Industries - Finance and insurance (%)
Most Common Industries - Real estate and rental and leasing (%)
Most Common Industries - Professional, scientific, and management, and administrative and waste management services (%)
Most Common Industries - Professional, scientific, and technical services (%)
Most Common Industries - Management of companies and enterprises (%)
Most Common Industries - Administrative and support and waste management services (%)
Most Common Industries - Educational services, and health care and social assistance (%)
Most Common Industries - Educational services (%)
Most Common Industries - Health care and social assistance (%)
Most Common Industries - Arts, entertainment, and recreation, and accommodation and food services (%)
Most Common Industries - Arts, entertainment, and recreation (%)
Most Common Industries - Accommodation and food services (%)
Most Common Industries - Other services, except public administration (%)
Most Common Industries - Public administration (%)
Occupation diversity
Most Common Occupations - Management, business, science, and arts occupations (%)
Most Common Occupations - Management, business, and financial occupations (%)
Most Common Occupations - Management occupations (%)
Most Common Occupations - Business and financial operations occupations (%)
Most Common Occupations - Computer, engineering, and science occupations (%)
Most Common Occupations - Computer and mathematical occupations (%)
Most Common Occupations - Architecture and engineering occupations (%)
Most Common Occupations - Life, physical, and social science occupations (%)
Most Common Occupations - Education, legal, community service, arts, and media occupations (%)
Most Common Occupations - Community and social service occupations (%)
Most Common Occupations - Legal occupations (%)
Most Common Occupations - Education, training, and library occupations (%)
Most Common Occupations - Arts, design, entertainment, sports, and media occupations (%)
Most Common Occupations - Healthcare practitioners and technical occupations (%)
Most Common Occupations - Health diagnosing and treating practitioners and other technical occupations (%)
Most Common Occupations - Health technologists and technicians (%)
Most Common Occupations - Service occupations (%)
Most Common Occupations - Healthcare support occupations (%)
Most Common Occupations - Protective service occupations (%)
Most Common Occupations - Fire fighting and prevention, and other protective service workers including supervisors (%)
Most Common Occupations - Law enforcement workers including supervisors (%)
Most Common Occupations - Food preparation and serving related occupations (%)
Most Common Occupations - Building and grounds cleaning and maintenance occupations (%)
Most Common Occupations - Personal care and service occupations (%)
Most Common Occupations - Sales and office occupations (%)
Most Common Occupations - Sales and related occupations (%)
Most Common Occupations - Office and administrative support occupations (%)
Most Common Occupations - Natural resources, construction, and maintenance occupations (%)
Most Common Occupations - Farming, fishing, and forestry occupations (%)
Most Common Occupations - Construction and extraction occupations (%)
Most Common Occupations - Installation, maintenance, and repair occupations (%)
Most Common Occupations - Production, transportation, and material moving occupations (%)
Most Common Occupations - Production occupations (%)
Most Common Occupations - Transportation occupations (%)
Most Common Occupations - Material moving occupations (%)
People in Group quarters - Institutionalized population (%)
People in Group quarters - Correctional institutions (%)
People in Group quarters - Federal prisons and detention centers (%)
People in Group quarters - Halfway houses (%)
People in Group quarters - Local jails and other confinement facilities (including police lockups) (%)
People in Group quarters - Military disciplinary barracks (%)
People in Group quarters - State prisons (%)
People in Group quarters - Other types of correctional institutions (%)
People in Group quarters - Nursing homes (%)
People in Group quarters - Hospitals/wards, hospices, and schools for the handicapped (%)
People in Group quarters - Hospitals/wards and hospices for chronically ill (%)
People in Group quarters - Hospices or homes for chronically ill (%)
People in Group quarters - Military hospitals or wards for chronically ill (%)
People in Group quarters - Other hospitals or wards for chronically ill (%)
People in Group quarters - Hospitals or wards for drug/alcohol abuse (%)
People in Group quarters - Mental (Psychiatric) hospitals or wards (%)
People in Group quarters - Schools, hospitals, or wards for the mentally retarded (%)
People in Group quarters - Schools, hospitals, or wards for the physically handicapped (%)
People in Group quarters - Institutions for the deaf (%)
People in Group quarters - Institutions for the blind (%)
People in Group quarters - Orthopedic wards and institutions for the physically handicapped (%)
People in Group quarters - Wards in general hospitals for patients who have no usual home elsewhere (%)
People in Group quarters - Wards in military hospitals for patients who have no usual home elsewhere (%)
People in Group quarters - Juvenile institutions (%)
People in Group quarters - Long-term care (%)
People in Group quarters - Homes for abused, dependent, and neglected children (%)
People in Group quarters - Residential treatment centers for emotionally disturbed children (%)
People in Group quarters - Training schools for juvenile delinquents (%)
People in Group quarters - Short-term care, detention or diagnostic centers for delinquent children (%)
People in Group quarters - Type of juvenile institution unknown (%)
People in Group quarters - Noninstitutionalized population (%)
People in Group quarters - College dormitories (includes college quarters off campus) (%)
People in Group quarters - Military quarters (%)
People in Group quarters - On base (%)
People in Group quarters - Barracks, unaccompanied personnel housing (UPH), (Enlisted/Officer), ;and similar group living quarters for military personnel (%)
People in Group quarters - Transient quarters for temporary residents (%)
People in Group quarters - Military ships (%)
People in Group quarters - Group homes (%)
People in Group quarters - Homes or halfway houses for drug/alcohol abuse (%)
People in Group quarters - Homes for the mentally ill (%)
People in Group quarters - Homes for the mentally retarded (%)
People in Group quarters - Homes for the physically handicapped (%)
People in Group quarters - Other group homes (%)
People in Group quarters - Religious group quarters (%)
People in Group quarters - Dormitories (%)
People in Group quarters - Agriculture workers' dormitories on farms (%)
People in Group quarters - Job Corps and vocational training facilities (%)
People in Group quarters - Other workers' dormitories (%)
People in Group quarters - Crews of maritime vessels (%)
People in Group quarters - Other nonhousehold living situations (%)
People in Group quarters - Other noninstitutional group quarters (%)
Residents speaking English at home (%)
Residents speaking English at home - Born in the United States (%)
Residents speaking English at home - Native, born elsewhere (%)
Residents speaking English at home - Foreign born (%)
Residents speaking Spanish at home (%)
Residents speaking Spanish at home - Born in the United States (%)
Residents speaking Spanish at home - Native, born elsewhere (%)
Residents speaking Spanish at home - Foreign born (%)
Residents speaking other language at home (%)
Residents speaking other language at home - Born in the United States (%)
Residents speaking other language at home - Native, born elsewhere (%)
Residents speaking other language at home - Foreign born (%)
Class of Workers - Employee of private company (%)
Class of Workers - Self-employed in own incorporated business (%)
Class of Workers - Private not-for-profit wage and salary workers (%)
Class of Workers - Local government workers (%)
Class of Workers - State government workers (%)
Class of Workers - Federal government workers (%)
Class of Workers - Self-employed workers in own not incorporated business and Unpaid family workers (%)
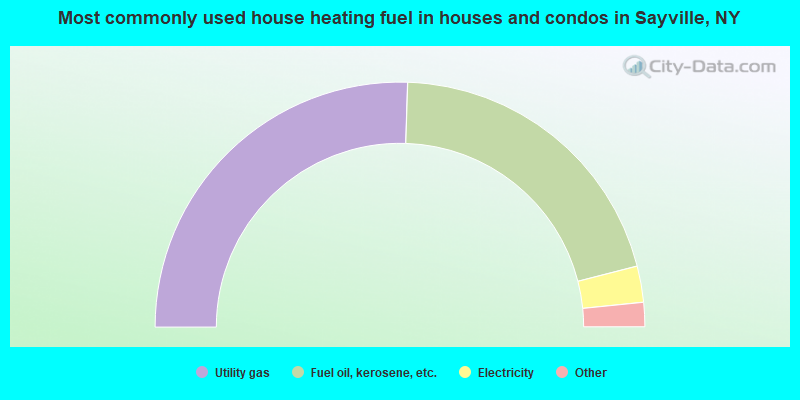
House heating fuel used in houses and condos - Utility gas (%)
House heating fuel used in houses and condos - Bottled, tank, or LP gas (%)
House heating fuel used in houses and condos - Electricity (%)
House heating fuel used in houses and condos - Fuel oil, kerosene, etc. (%)
House heating fuel used in houses and condos - Coal or coke (%)
House heating fuel used in houses and condos - Wood (%)
House heating fuel used in houses and condos - Solar energy (%)
House heating fuel used in houses and condos - Other fuel (%)
House heating fuel used in houses and condos - No fuel used (%)
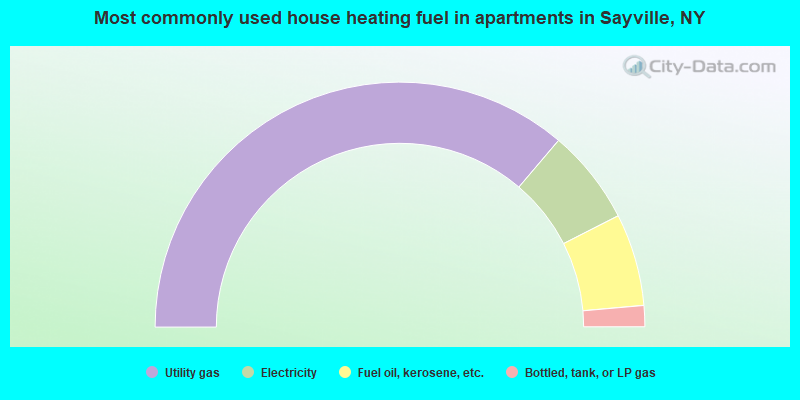
House heating fuel used in apartments - Utility gas (%)
House heating fuel used in apartments - Bottled, tank, or LP gas (%)
House heating fuel used in apartments - Electricity (%)
House heating fuel used in apartments - Fuel oil, kerosene, etc. (%)
House heating fuel used in apartments - Coal or coke (%)
House heating fuel used in apartments - Wood (%)
House heating fuel used in apartments - Solar energy (%)
House heating fuel used in apartments - Other fuel (%)
House heating fuel used in apartments - No fuel used (%)
Armed forces status - In Armed Forces (%)
Armed forces status - Civilian (%)
Armed forces status - Civilian - Veteran (%)
Armed forces status - Civilian - Nonveteran (%)
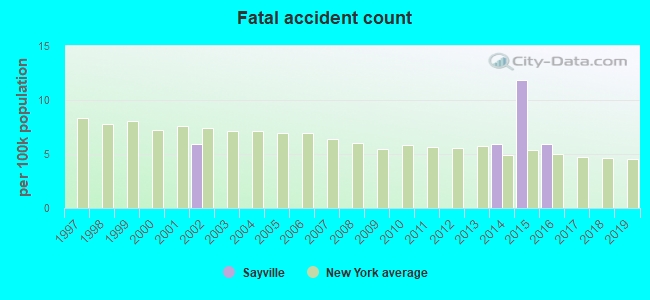
Fatal accidents locations in years 2005-2021
Fatal accidents locations in 2005
Fatal accidents locations in 2006
Fatal accidents locations in 2007
Fatal accidents locations in 2008
Fatal accidents locations in 2009
Fatal accidents locations in 2010
Fatal accidents locations in 2011
Fatal accidents locations in 2012
Fatal accidents locations in 2013
Fatal accidents locations in 2014
Fatal accidents locations in 2015
Fatal accidents locations in 2016
Fatal accidents locations in 2017
Fatal accidents locations in 2018
Fatal accidents locations in 2019
Fatal accidents locations in 2020
Fatal accidents locations in 2021
Alcohol use - People drinking some alcohol every month (%)
Alcohol use - People not drinking at all (%)
Alcohol use - Average days/month drinking alcohol
Alcohol use - Average drinks/week
Alcohol use - Average days/year people drink much
Audiometry - Average condition of hearing (%)
Audiometry - People that can hear a whisper from across a quiet room (%)
Audiometry - People that can hear normal voice from across a quiet room (%)
Audiometry - Ears ringing, roaring, buzzing (%)
Audiometry - Had a job exposure to loud noise (%)
Audiometry - Had off-work exposure to loud noise (%)
Blood Pressure & Cholesterol - Has high blood pressure (%)
Blood Pressure & Cholesterol - Checking blood pressure at home (%)
Blood Pressure & Cholesterol - Frequently checking blood cholesterol (%)
Blood Pressure & Cholesterol - Has high cholesterol level (%)
Consumer Behavior - Money monthly spent on food at supermarket/grocery store
Consumer Behavior - Money monthly spent on food at other stores
Consumer Behavior - Money monthly spent on eating out
Consumer Behavior - Money monthly spent on carryout/delivered foods
Consumer Behavior - Income spent on food at supermarket/grocery store (%)
Consumer Behavior - Income spent on food at other stores (%)
Consumer Behavior - Income spent on eating out (%)
Consumer Behavior - Income spent on carryout/delivered foods (%)
Current Health Status - General health condition (%)
Current Health Status - Blood donors (%)
Current Health Status - Has blood ever tested for HIV virus (%)
Current Health Status - Left-handed people (%)
Dermatology - People using sunscreen (%)
Diabetes - Diabetics (%)
Diabetes - Had a blood test for high blood sugar (%)
Diabetes - People taking insulin (%)
Diet Behavior & Nutrition - Diet health (%)
Diet Behavior & Nutrition - Milk product consumption (# of products/month)
Diet Behavior & Nutrition - Meals not home prepared (#/week)
Diet Behavior & Nutrition - Meals from fast food or pizza place (#/week)
Diet Behavior & Nutrition - Ready-to-eat foods (#/month)
Diet Behavior & Nutrition - Frozen meals/pizza (#/month)
Drug Use - People that ever used marijuana or hashish (%)
Drug Use - Ever used hard drugs (%)
Drug Use - Ever used any form of cocaine (%)
Drug Use - Ever used heroin (%)
Drug Use - Ever used methamphetamine (%)
Health Insurance - People covered by health insurance (%)
Kidney Conditions-Urology - Avg. # of times urinating at night
Medical Conditions - People with asthma (%)
Medical Conditions - People with anemia (%)
Medical Conditions - People with psoriasis (%)
Medical Conditions - People with overweight (%)
Medical Conditions - Elderly people having difficulties in thinking or remembering (%)
Medical Conditions - People who ever received blood transfusion (%)
Medical Conditions - People having trouble seeing even with glass/contacts (%)
Medical Conditions - People with arthritis (%)
Medical Conditions - People with gout (%)
Medical Conditions - People with congestive heart failure (%)
Medical Conditions - People with coronary heart disease (%)
Medical Conditions - People with angina pectoris (%)
Medical Conditions - People who ever had heart attack (%)
Medical Conditions - People who ever had stroke (%)
Medical Conditions - People with emphysema (%)
Medical Conditions - People with thyroid problem (%)
Medical Conditions - People with chronic bronchitis (%)
Medical Conditions - People with any liver condition (%)
Medical Conditions - People who ever had cancer or malignancy (%)
Mental Health - People who have little interest in doing things (%)
Mental Health - People feeling down, depressed, or hopeless (%)
Mental Health - People who have trouble sleeping or sleeping too much (%)
Mental Health - People feeling tired or having little energy (%)
Mental Health - People with poor appetite or overeating (%)
Mental Health - People feeling bad about themself (%)
Mental Health - People who have trouble concentrating on things (%)
Mental Health - People moving or speaking slowly or too fast (%)
Mental Health - People having thoughts they would be better off dead (%)
Oral Health - Average years since last visit a dentist
Oral Health - People embarrassed because of mouth (%)
Oral Health - People with gum disease (%)
Oral Health - General health of teeth and gums (%)
Oral Health - Average days a week using dental floss/device
Oral Health - Average days a week using mouthwash for dental problem
Oral Health - Average number of teeth
Pesticide Use - Households using pesticides to control insects (%)
Pesticide Use - Households using pesticides to kill weeds (%)
Physical Activity - People doing vigorous-intensity work activities (%)
Physical Activity - People doing moderate-intensity work activities (%)
Physical Activity - People walking or bicycling (%)
Physical Activity - People doing vigorous-intensity recreational activities (%)
Physical Activity - People doing moderate-intensity recreational activities (%)
Physical Activity - Average hours a day doing sedentary activities
Physical Activity - Average hours a day watching TV or videos
Physical Activity - Average hours a day using computer
Physical Functioning - People having limitations keeping them from working (%)
Physical Functioning - People limited in amount of work they can do (%)
Physical Functioning - People that need special equipment to walk (%)
Physical Functioning - People experiencing confusion/memory problems (%)
Physical Functioning - People requiring special healthcare equipment (%)
Prescription Medications - Average number of prescription medicines taking
Preventive Aspirin Use - Adults 40+ taking low-dose aspirin (%)
Reproductive Health - Vaginal deliveries (%)
Reproductive Health - Cesarean deliveries (%)
Reproductive Health - Deliveries resulted in a live birth (%)
Reproductive Health - Pregnancies resulted in a delivery (%)
Reproductive Health - Women breastfeeding newborns (%)
Reproductive Health - Women that had a hysterectomy (%)
Reproductive Health - Women that had both ovaries removed (%)
Reproductive Health - Women that have ever taken birth control pills (%)
Reproductive Health - Women taking birth control pills (%)
Reproductive Health - Women that have ever used Depo-Provera or injectables (%)
Reproductive Health - Women that have ever used female hormones (%)
Sexual Behavior - People 18+ that ever had sex (vaginal, anal, or oral) (%)
Sexual Behavior - Males 18+ that ever had vaginal sex with a woman (%)
Sexual Behavior - Males 18+ that ever performed oral sex on a woman (%)
Sexual Behavior - Males 18+ that ever had anal sex with a woman (%)
Sexual Behavior - Males 18+ that ever had any sex with a man (%)
Sexual Behavior - Females 18+ that ever had vaginal sex with a man (%)
Sexual Behavior - Females 18+ that ever performed oral sex on a man (%)
Sexual Behavior - Females 18+ that ever had anal sex with a man (%)
Sexual Behavior - Females 18+ that ever had any kind of sex with a woman (%)
Sexual Behavior - Average age people first had sex
Sexual Behavior - Average number of female sex partners in lifetime (males 18+)
Sexual Behavior - Average number of female vaginal sex partners in lifetime (males 18+)
Sexual Behavior - Average age people first performed oral sex on a woman (18+)
Sexual Behavior - Average number of woman performed oral sex on in lifetime (18+)
Sexual Behavior - Average number of male sex partners in lifetime (males 18+)
Sexual Behavior - Average number of male anal sex partners in lifetime (males 18+)
Sexual Behavior - Average age people first performed oral sex on a man (18+)
Sexual Behavior - Average number of male oral sex partners in lifetime (18+)
Sexual Behavior - People using protection when performing oral sex (%)
Sexual Behavior - Average number of times people have vaginal or anal sex a year
Sexual Behavior - People having sex without condom (%)
Sexual Behavior - Average number of male sex partners in lifetime (females 18+)
Sexual Behavior - Average number of male vaginal sex partners in lifetime (females 18+)
Sexual Behavior - Average number of female sex partners in lifetime (females 18+)
Sexual Behavior - Circumcised males 18+ (%)
Sleep Disorders - Average hours sleeping at night
Sleep Disorders - People that has trouble sleeping (%)
Smoking-Cigarette Use - People smoking cigarettes (%)
Taste & Smell - People 40+ having problems with smell (%)
Taste & Smell - People 40+ having problems with taste (%)
Taste & Smell - People 40+ that ever had wisdom teeth removed (%)
Taste & Smell - People 40+ that ever had tonsils teeth removed (%)
Taste & Smell - People 40+ that ever had a loss of consciousness because of a head injury (%)
Taste & Smell - People 40+ that ever had a broken nose or other serious injury to face or skull (%)
Taste & Smell - People 40+ that ever had two or more sinus infections (%)
Weight - Average height (inches)
Weight - Average weight (pounds)
Weight - Average BMI
Weight - People that are obese (%)
Weight - People that ever were obese (%)
Weight - People trying to lose weight (%)
According to our research of New York and other state lists, there were 4 registered sex offenders living in Sayville, New York as of July 02, 2024 . The ratio of all residents to sex offenders in Sayville is 4,082 to 1.The ratio of registered sex offenders to all residents in this city is much lower than the state average.
Latest news from Sayville, NY collected exclusively by city-data.com from local newspapers, TV, and radio stations
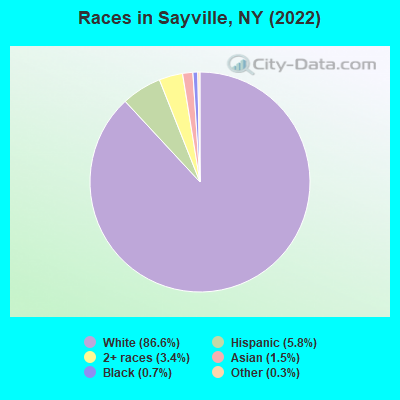
Sayville, NY City Guides: Ancestries: Irish (24.1%), Italian (23.3%), American (22.1%), German (5.5%), English (2.1%), Egyptian (1.6%).
Current Local Time:
Land area: 5.53 square miles.
Population density: 3,050 people per square mile (average).
404 residents are foreign born (0.9% Asia , 0.8% Europe , 0.7% Latin America ).
This place:
2.5%New York:
22.6%
Median real estate property taxes paid for housing units with mortgages in 2022: $10,001 (1.7%)Median real estate property taxes paid for housing units with no mortgage in 2022: $9,738 (1.6%)
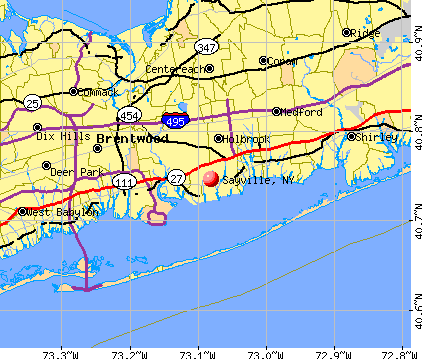
Nearest city with pop. 50,000+: Brentwood, NY
Nearest city with pop. 200,000+: North Hempstead, NY
Nearest city with pop. 1,000,000+: Queens, NY
Nearest cities:
Latitude: 40.75 N, Longitude: 73.08 W
Daytime population change due to commuting: -2,300 (-14.2%)Workers who live and work in this place: 1,975 (24.0%)
Unemployment in December 2023:
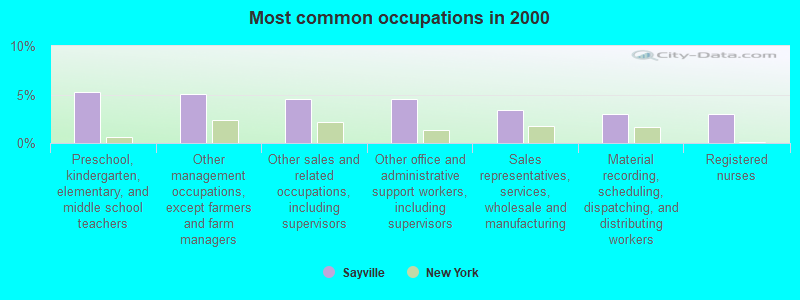
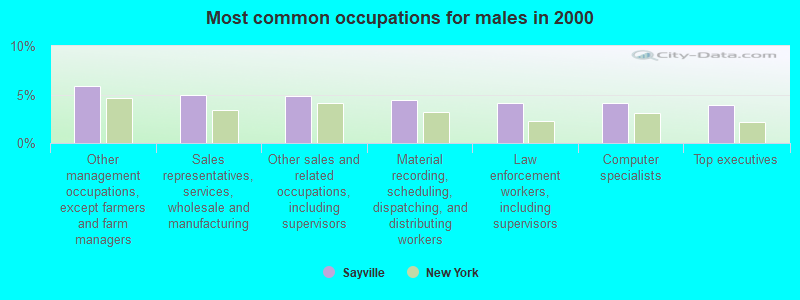
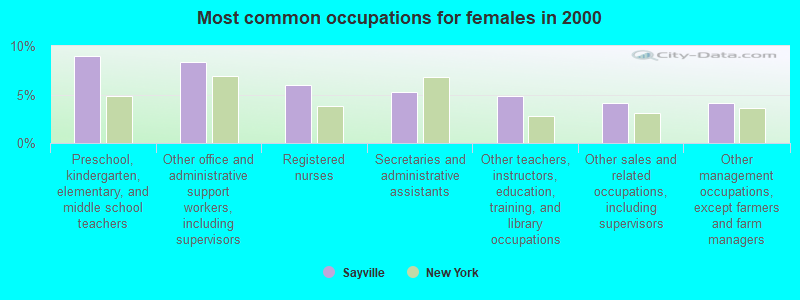
Most common occupations in Sayville, NY (%)
Both Males Females
Preschool, kindergarten, elementary, and middle school teachers (5.3%)
Other management occupations, except farmers and farm managers (5.1%)
Other sales and related occupations, including supervisors (4.5%)
Other office and administrative support workers, including supervisors (4.5%)
Sales representatives, services, wholesale and manufacturing (3.4%)
Material recording, scheduling, dispatching, and distributing workers (3.0%)
Registered nurses (3.0%)
Other management occupations, except farmers and farm managers (5.9%)
Sales representatives, services, wholesale and manufacturing (4.9%)
Other sales and related occupations, including supervisors (4.9%)
Material recording, scheduling, dispatching, and distributing workers (4.4%)
Law enforcement workers, including supervisors (4.1%)
Computer specialists (4.1%)
Top executives (3.9%)
Preschool, kindergarten, elementary, and middle school teachers (9.0%)
Other office and administrative support workers, including supervisors (8.3%)
Registered nurses (6.0%)
Secretaries and administrative assistants (5.2%)
Other teachers, instructors, education, training, and library occupations (4.8%)
Other sales and related occupations, including supervisors (4.2%)
Other management occupations, except farmers and farm managers (4.1%)
Tornado activity:
Sayville-area historical tornado activity is near New York state average. It is 63% smaller than the overall U.S. average.
On 7/10/1989, a category F4 (max. wind speeds 207-260 mph) tornado 40.6 miles away from the Sayville place center injured 40 people and caused between $50,000,000 and $500,000,000 in damages.
On 7/10/1989, a category F2 (max. wind speeds 113-157 mph) tornado 16.6 miles away from the place center injured one person .
Earthquake activity:
Sayville-area historical earthquake activity is significantly above New York state average. It is 71% smaller than the overall U.S. average. On 8/23/2011 at 17:51:04, a magnitude 5.8 (5.8 MW, Depth: 3.7 mi, Class: Moderate, Intensity: VI - VII) earthquake occurred 325.4 miles away from the city center On 10/7/1983 at 10:18:46, a magnitude 5.3 (5.1 MB, 5.3 LG, 5.1 ML) earthquake occurred 231.0 miles away from the city center On 4/20/2002 at 10:50:47, a magnitude 5.3 (5.3 ML, Depth: 3.0 mi) earthquake occurred 262.4 miles away from the city center On 4/20/2002 at 10:50:47, a magnitude 5.2 (5.2 MB, 4.2 MS, 5.2 MW, 5.0 MW) earthquake occurred 260.8 miles away from the city center On 8/22/1992 at 12:20:32, a magnitude 4.8 (4.8 MB, 3.8 MS, 4.7 LG, Depth: 6.2 mi, Class: Light, Intensity: IV - V) earthquake occurred 185.3 miles away from the city center On 1/16/1994 at 01:49:16, a magnitude 4.6 (4.6 MB, 4.6 LG, Depth: 3.1 mi) earthquake occurred 158.0 miles away from the city center Magnitude types: regional Lg-wave magnitude (LG), body-wave magnitude (MB), local magnitude (ML), surface-wave magnitude (MS), moment magnitude (MW) Natural disasters: The number of natural disasters in Suffolk County (28) is a lot greater than the US average (15).Major Disasters (Presidential) Declared: 19Emergencies Declared: 7Hurricanes: 9, Floods: 7, Storms: 7, Snowstorms: 4, Winter Storms: 3, Blizzards: 2, Heavy Rain: 1, Power Outage: 1, Tropical Depression: 1, Tropical Storm: 1, Water Shortage: 1, Other: 3 (Note: some incidents may be assigned to more than one category). Hospitals and medical centers in Sayville: DEVELOPMENTAL DISABILITIES INSTITUTE (98 BOURNE AVE) GOOD SAMARITAN NURSING HOME (101 ELM ST)
PETITE FLEUR NURSING HOME (300 BROADWAY AVENUE)
Colleges/universities with over 2000 students nearest to Sayville:
Dowling College (about 5 miles; Oakdale, NY ; Full-time enrollment: 2,598)
Suffolk County Community College (about 8 miles; Selden, NY ; FT enrollment: 18,540)
Stony Brook University (about 12 miles; Stony Brook, NY ; FT enrollment: 22,071)
Farmingdale State College (about 19 miles; Farmingdale, NY ; FT enrollment: 6,956)
Briarcliffe College (about 22 miles; Bethpage, NY ; FT enrollment: 2,134)
SUNY College at Old Westbury (about 26 miles; Old Westbury, NY ; FT enrollment: 4,096)
Nassau Community College (about 27 miles; Garden City, NY ; FT enrollment: 18,552)
Public elementary/middle schools in Sayville:
Private elementary/middle school in Sayville:
See full list of schools located in Sayville Library in Sayville: SAYVILLE LIBRARY Operating income: $2,564,282; Location: 11 COLLINS AVENUE; 122,111 books ; 4,701 e-books ; 10,669 audio materials ; 13,709 video materials ; 42 local licensed databases ; 14 state licensed databases ; 63 other licensed databases ; 265 print serial subscriptions ; 10,470 electronic serial subscriptions )
Notable locations in Sayville: (A) , Sailors Haven Ferry Terminal (B) , Island Hills Country Club (C) , Sayville Station (D) , Shoreham Hotel (E) , West Sayville Fire Department (F) , Sons And Daughters Of Liberty Home For The Aged (G) , Good Samaritan Nursing Home (H) , Sayville Library (I) , Sayville Fire Department (J) , Petite Fleur Nursing Home (K) . Display/hide their locations on the map
Churches in Sayville include: (A) , Gospel Community Church (B) , Grace Chapel Assembly of God (C) , New Life Community Church (D) , Sayville United Methodist Church (E) , Sayville Congregational Church (F) , Saint Lawrence The Martyr Roman Catholic Church (G) , Saint John's Lutheran Church (H) . Display/hide their locations on the map
Cemeteries: (1) , Union Cemetery (2) , Saint Ann's Cemetery (3) . Display/hide their locations on the map
Reservoirs: (A) , Mill Pond (B) , Lotus Lake (C) . Display/hide their locations on the map
Creek: (A) . Display/hide its location on the map
Park in Sayville: (1) . Display/hide its location on the map
Beach: (A) . Display/hide its location on the map
Hotel:
Birthplace of: Emily Hart - Child actor, Tom Westman - Television personality, Kevin Burton - College basketball player (Boston U. Terriers), Raymond Gilmartin - Businessman.
Suffolk County has a predicted average indoor radon screening level less than 2 pCi/L (pico curies per liter) - Low Potential Average household size: This place:
2.7 peopleNew York:
2.6 people
Percentage of family households: This place:
73.0%Whole state:
63.5%
Percentage of households with unmarried partners: This place:
4.6%Whole state:
6.8%
Likely homosexual households (counted as self-reported same-sex unmarried-partner households)
Lesbian couples: 0.6% of all households Gay men: 0.3% of all households
People in group quarters in Sayville in 2010:
532 people in nursing facilities/skilled-nursing facilities
25 people in group homes intended for adults
11 people in emergency and transitional shelters (with sleeping facilities) for people experiencing homelessness
2 people in other noninstitutional facilities
People in group quarters in Sayville in 2000:
260 people in nursing homes
67 people in homes or halfway houses for drug/alcohol abuse
39 people in other noninstitutional group quarters
2 people in homes for the mentally retarded
2 people in religious group quarters
Banks with branches in Sayville (2011 data):
Capital One, National Association: Sayville Branch at 160 Main St, branch established on 1935/11/25. Info updated 2011/07/01: Bank assets: $133,477.8 mil, Deposits: $97,063.7 mil, headquarters in Mclean, VA, positive income , 984 total offices , Holding Company: Capital One Financial Corporation
JPMorgan Chase Bank, National Association: Sayville Branch at 131 Main Street, branch established on 1899/03/26. Info updated 2011/11/10: Bank assets: $1,811,678.0 mil, Deposits: $1,190,738.0 mil, headquarters in Columbus, OH, positive income , International Specialization, 5577 total offices , Holding Company: Jpmorgan Chase & Co.
RBS Citizens, National Association: Sayville S&S Branch at 191 Montauk Highway, branch established on 2010/10/22. Info updated 2007/09/19: Bank assets: $106,940.6 mil, Deposits: $75,690.2 mil, headquarters in Providence, RI, positive income , 1135 total offices , Holding Company: Uk Financial Investments Limited
The Suffolk County National Bank of Riverhead: Sayville Branch at 161 North Main Street, branch established on 1998/06/08. Info updated 2012/01/10: Bank assets: $1,483.9 mil, Deposits: $1,312.3 mil, headquarters in Riverhead, NY, positive income , Commercial Lending Specialization, 30 total offices , Holding Company: Suffolk Bancorp
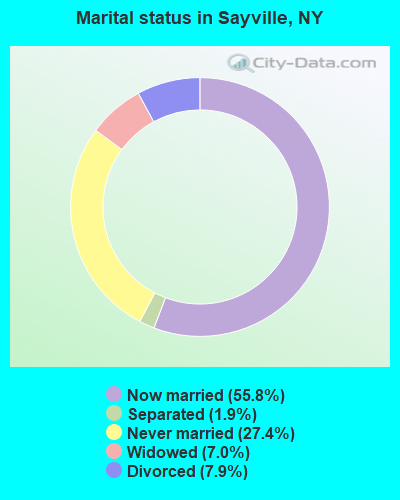
For population 15 years and over in Sayville:
Never married: 27.4%Now married: 55.8%Separated: 1.9%Widowed: 7.0%Divorced: 7.9% For population 25 years and over in Sayville:
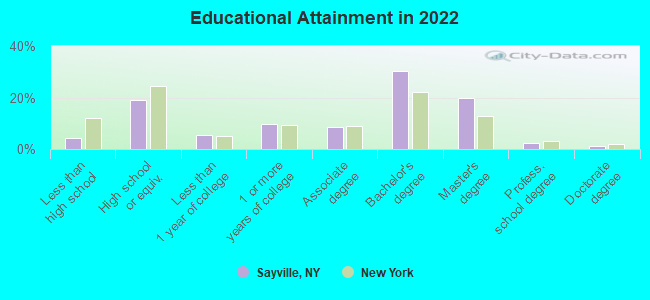
High school or higher: 95.6%Bachelor's degree or higher: 51.9%Graduate or professional degree: 22.6%Unemployed: 2.1%Mean travel time to work (commute): 26.4 minutes
Education Gini index (Inequality in education) Here:
9.7New York average:
13.9
Religion statistics for Sayville, NY (based on Suffolk County data)
Religion Adherents Congregations Catholic 879,457 75 Mainline Protestant 69,205 182 Evangelical Protestant 58,909 264 Other 50,771 124 Orthodox 10,190 10 Black Protestant 8,298 49 None 416,520 -
Source: Clifford Grammich, Kirk Hadaway, Richard Houseal, Dale E.Jones, Alexei Krindatch, Richie Stanley and Richard H.Taylor. 2012. 2010 U.S.Religion Census: Religious Congregations & Membership Study. Association of Statisticians of American Religious Bodies. Jones, Dale E., et al. 2002. Congregations and Membership in the United States 2000. Nashville, TN: Glenmary Research Center. Graphs represent county-level data
Food Environment Statistics: Number of grocery stores : 514Here :
3.40 / 10,000 pop.New York :
4.13 / 10,000 pop.
Number of supercenters and club stores : 9Suffolk County :
0.06 / 10,000 pop.New York :
0.06 / 10,000 pop.
Number of convenience stores (no gas) : 217Here :
1.44 / 10,000 pop.State :
0.92 / 10,000 pop.
Number of convenience stores (with gas) : 256This county :
1.69 / 10,000 pop.New York :
1.68 / 10,000 pop.
Number of full-service restaurants : 1,232Suffolk County :
8.15 / 10,000 pop.New York :
8.82 / 10,000 pop.
Adult obesity rate : Suffolk County :
23.4%New York :
23.8%
Low-income preschool obesity rate : Health and Nutrition: Healthy diet rate : Sayville:
54.0%State:
50.1%
Average overall health of teeth and gums : People feeling badly about themselves : This city:
21.0%New York:
20.3%
People not drinking alcohol at all : Average hours sleeping at night : General health condition : Average condition of hearing : Sayville:
80.4%State:
80.2%
More about Health and Nutrition of Sayville, NY Residents
4.14% of this county's 2021 resident taxpayers lived in other counties in 2020 ($206,656 average adjusted gross income )
Here:
4.14%New York average:
5.29%
0.01% of residents moved from foreign countries ($74 average AGI )Suffolk County:
0.01%New York average:
0.01%
Top counties from which taxpayers relocated into this county between 2020 and 2021:
4.28% of this county's 2020 resident taxpayers moved to other counties in 2021 ($141,172 average adjusted gross income )
Here:
4.28%New York average:
6.93%
0.01% of residents moved to foreign countries ($169 average AGI )Suffolk County:
0.01%New York average:
0.02%
Top counties to which taxpayers relocated from this county between 2020 and 2021:
Businesses in Sayville, NY
Name Count Name Count
7-Eleven 2 Ruby Tuesday 1 AMF Bowling 1 Starbucks 1 CVS 1 Stop & Shop 1 Curves 1 Subaru 1 DHL 1 Subway 2 Domino's Pizza 1 True Value 1 Dunkin Donuts 1 U-Haul 1 FedEx 2 UPS 2 New Balance 1 Volkswagen 1 Nike 3 Walgreens 1 Rite Aid 1
Strongest AM radio stations in Sayville:
WLIM (1580 AM; 10 kW; PATCHOGUE, NY; Owner: POLNET COMMUNICATIONS, LTD.)
WLIE (540 AM; 2 kW; ISLIP, NY; Owner: LONG ISLAND MULTIMEDIA, LLC.)
WGSM (740 AM; 25 kW; HUNTINGTON, NY; Owner: K RADIO LICENSEE, INC.)
WFAN (660 AM; 50 kW; NEW YORK, NY; Owner: INFINITY BROADCASTING OPERATIONS, INC.)
WCBS (880 AM; 50 kW; NEW YORK, NY; Owner: INFINITY BROADCASTING OPERATIONS, INC.)
WMCA (570 AM; 50 kW; NEW YORK, NY; Owner: SALEM MEDIA OF NEW YORK, LLC)
WOR (710 AM; 50 kW; NEW YORK, NY; Owner: BUCKLEY BROADCASTING CORPORATION)
WABC (770 AM; 50 kW; NEW YORK, NY; Owner: WABC-AM RADIO, INC.)
WEPN (1050 AM; 50 kW; NEW YORK, NY; Owner: NEW YORK AM RADIO, LLC)
WBBR (1130 AM; 50 kW; NEW YORK, NY; Owner: BLOOMBERG COMMUNICATIONS INC.)
WQEW (1560 AM; 50 kW; NEW YORK, NY; Owner: THE NEW YORK TIMES ELECTRONIC MEDIA COMPANY)
WINS (1010 AM; 50 kW; NEW YORK, NY; Owner: INFINITY BROADCASTING OPERATIONS, INC.)
WALK (1370 AM; 0 kW; EAST PATCHOGUE, NY; Owner: AMFM RADIO LICENSES, L.L.C.)
Strongest FM radio stations in Sayville:
WALK-FM (97.5 FM; PATCHOGUE, NY; Owner: AMFM RADIO LICENSES, L.L.C.)
WUSB (90.1 FM; STONY BROOK, NY; Owner: STATE UNIVERSITY OF NEW YORK)
WBLI (106.1 FM; PATCHOGUE, NY; Owner: CXR HOLDINGS, INC.)
W289AD (105.7 FM; SELDEN, NY; Owner: SACRED HEART UNIVERSITY, INC.)
WBZO (103.1 FM; BAY SHORE, NY; Owner: MID-ISLAND BROADCASTING LIMITED PARTNERSHIP)
WFRS (88.9 FM; SMITHTOWN, NY; Owner: FAMILY STATIONS, INC.)
WMJC (94.3 FM; SMITHTOWN, NY; Owner: IW LIMITED LIABILITY COMPANY)
WLIU (88.3 FM; SOUTHAMPTON, NY; Owner: LONG ISLAND UNIVERSITY PUBLIC RADIO NETWORK)
WSHR (91.9 FM; LAKE RONKONKOMA, NY; Owner: SACHEM CENTRAL SCH DIST HOLBROOK)
W217AF (91.3 FM; HUNTINGTON STATION, NY; Owner: SACRED HEART UNIVERSITY, INC.)
WXXP (105.3 FM; CALVERTON-ROANOKE, NY; Owner: JARAD BROADCASTING CO. OF CALVERTON, INC)
WRCN-FM (103.9 FM; RIVERHEAD, NY; Owner: IW LIMITED LIABILITY COMPANY)
WKCR-FM (89.9 FM; NEW YORK, NY; Owner: TRUSTEES OF COLUMBIA UNIVERSITY IN NEW YORK)
WLVG (96.1 FM; CENTER MORICHES, NY; Owner: WAY BROADCASTING, INC.)
WKTU (103.5 FM; LAKE SUCCESS, NY; Owner: AMFM RADIO LICENSES, LLC)
WQCD (101.9 FM; NEW YORK, NY; Owner: EMMIS RADIO LICENSE CORPORATION)
WBAB (102.3 FM; BABYLON, NY; Owner: CXR HOLDINGS, INC.)
WPLJ (95.5 FM; NEW YORK, NY; Owner: WPLJ-FM RADIO, INC.)
WNYC-FM (93.9 FM; NEW YORK, NY; Owner: WNYC RADIO)
WCAA (105.9 FM; NEWARK, NJ; Owner: WADO-AM LICENSE CORP. ("WADO"))
TV broadcast stations around Sayville:
WFTY (Channel 67; SMITHTOWN, NY; Owner: UNIVISION NEW YORK LLC)
WLNY (Channel 55; RIVERHEAD, NY; Owner: WLNY-TV, INC.)
WNYW (Channel 5; NEW YORK, NY; Owner: FOX TELEVISION STATIONS, INC.)
WCBS-TV (Channel 2; NEW YORK, NY; Owner: CBS BROADCASTING INC.)
WABC-TV (Channel 7; NEW YORK, NY; Owner: AMERICAN BROADCASTING COMPANIES, INC)
WPIX (Channel 11; NEW YORK, NY; Owner: WPIX, INC.)
WWOR-TV (Channel 9; SECAUCUS, NJ; Owner: FOX TELEVISION STATIONS, INC.)
WNJU (Channel 47; LINDEN, NJ; Owner: WNJU LICENSE CORPORATION)
WPXN-TV (Channel 31; NEW YORK, NY; Owner: PAXSON COMMUNICATIONS LICENSE COMPANY, LLC)
WXNY-LP (Channel 32; NEW YORK, NY; Owner: ISLAND BROADCASTING COMPANY)
WNBC (Channel 4; NEW YORK, NY; Owner: NATIONAL BROADCASTING COMPANY, INC.)
WNET (Channel 13; NEWARK, NJ; Owner: EDUCATIONAL BROADCASTING CORPORATION)
WXTV (Channel 41; PATERSON, NJ; Owner: WXTV LICENSE PARTNERSHIP, G.P.)
WFUT (Channel 68; NEWARK, NJ; Owner: UNIVISION NEW YORK LLC)
WNYE-TV (Channel 25; NEW YORK, NY; Owner: NEW YORK CITY BOARD OF EDUCATION)
W26CE (Channel 26; NEW YORK, NY; Owner: ATLANTIC COAST COMMUNICATIONS, INC.)
WKOB-LP (Channel 53; NEW YORK, NY; Owner: WKOB COMMUNICATIONS, INC.)
WEBR-CA (Channel 17; MANHATTAN, NY; Owner: K LICENSEE INC.)
WRNN-LP (Channel 57; NYACK, NY; Owner: LP NYACK LIMITED PARTNERSHIP)
WLIW (Channel 21; GARDEN CITY, NY; Owner: EDUCATIONAL BROADCASTING CORPORATION)
National Bridge Inventory (NBI) Statistics 5 Number of bridges43ft / 13.3m Total length $23,709,000 Total costs154,992 Total average daily traffic618 Total average daily truck traffic
FCC Registered Antenna Towers: 6
Shawn O'Sullivan, 281 Broadway Ave. (Lat: 40.763306 Lon: -73.065806), Type: 31.2, Overall height: 27.2 m, Registrant: Community Ambulance Company Of Sayville, Inc., 450 Sayvi-lle, Phone: (631) 567-2586 Shawn P O'Sullivan, 281 Broadway Ave. (Lat: 40.763306 Lon: -73.065806), Type: 31.2, Overall height: 27.2 m, Registrant: Community Ambulance Company Of Sayville, Inc., 450 Sayvi-lle, Phone: (631) 567-2586 Jennifer Flynn, 230 Montauk Hwy (Lat: 40.738056 Lon: -73.079167), Type: 24.9, Overall height: 24.9 m, Registrant: New York Smsa Limited Partnership Dba , Syoungm1@mobile.Bam.Com, , Bedmi-nster, Phone: (908) 306-6890 Lawrence Santangelo, 281 Broadway (Lat: 40.763056 Lon: -73.065556), Type: 30.4, Overall height: 30.4 m, Registrant: Sayville Fire District, Distmgrsfd@gmail.Com, , Sayvi-lle, Phone: (631) 589-0189 Lawrence L Santangelo, 281 Broadway (Lat: 40.763056 Lon: -73.065556), Type: 30.4, Overall height: 30.4 m, Registrant: Sayville Fire District, Distmgrsfd@gmail.Com, , Sayvi-lle, Phone: (631) 589-0189 230 Montauk Hwy (Lat: 40.738056 Lon: -73.079167), Type: 24.9, Overall height: 24.9 m, Registrant: New York Smsa Limited Partnership Dba , Syoungm1@mobile.Bam.Com, , Bedmi-nster, Phone: (908) 306-6890 FCC Registered Broadcast Land Mobile Towers: 6
107 N Main St (Lat: 40.736222 Lon: -73.082889), Type: Tower, Structure height: 11 m, Overall height: 14 m, Call Sign: KEB659, Assigned Frequencies: 46.1800 MHz, 46.4400 MHz, 46.4600 MHz, Grant Date: 06/25/2015, Expiration Date: 09/21/2025, Registrant: Sayville Fire District, 107 North Main Street, Sayville, NY 11782, Phone: (631) 589-0189, Fax: (631) 589-0230, Email:
38 Easy St (Lat: 40.743167 Lon: -73.110667), Call Sign: KMK654, Assigned Frequencies: 160.185 MHz, Grant Date: 07/21/1997, Expiration Date: 09/25/2002, Cancellation Date: 01/12/2003, Registrant: Taurus Carting Inc, 38 Easy St, Sayville, NY 11782, Phone: (516) 567-4118 170-SAYVILLE, Mta - Rail Station Sayville (Lat: 40.740000 Lon: -73.865833), Type: Bant, Structure height: 15.3 m, Call Sign: WQED267, Assigned Frequencies: 851.037 MHz, 851.537 MHz, 852.037 MHz, 852.537 MHz, 853.037 MHz, Grant Date: 12/29/2005, Expiration Date: 12/29/2015, Cancellation Date: 01/14/2011, Certifier: Thomas J Cowper, Registrant: Nys Dhses Office Of Interoperable And Emergency Communications, State Office Campus Building 22, 1220 Washington Ave, Albany, NY 12226, Phone: (518) 322-4912, Fax: (518) 322-4975, Email:
Lat: 40.734806 Lon: -73.080111, Call Sign: WQJB604, Licensee ID: L01415490, Assigned Frequencies: 467.262 MHz, Grant Date: 06/20/2018, Expiration Date: 07/16/2028, Certifier: Alice Lepore, Registrant: Sayville Library, 88 Greene Avenue, Sayville, NY 11782, Phone: (631) 589-4440Lat: 40.739194 Lon: -73.094056, Call Sign: WQOE916, Assigned Frequencies: 72.3200 MHz, Grant Date: 09/06/2011, Expiration Date: 09/06/2021, Cancellation Date: 11/06/2021, Certifier: Stephen Koepper, Registrant: Primex Wireless, Inc., 965 Wells Street, Lake Geneva, WI 53147, Phone: (800) 537-0464129 Lakeland Avenue (Lat: 40.745056 Lon: -73.086917), Call Sign: WRAW204, Assigned Frequencies: 452.525 MHz, 452.562 MHz, 452.600 MHz, Grant Date: 03/21/2018, Expiration Date: 03/21/2028, Certifier: Richard Martini, Registrant: National License, 12591 Brompton Road, Carmel, IN 46033, Phone: (317) 564-8018, Email:
FCC Registered Microwave Towers: 4 (
See the full list of FCC Registered Microwave Towers in this town )
FCC Registered Maritime Coast & Aviation Ground Towers: 4 (
See the full list of FCC Registered Maritime Coast & Aviation Ground Towers )
FCC Registered Amateur Radio Licenses: 60 (
See the full list of FCC Registered Amateur Radio Licenses in Sayville )
FAA Registered Aircraft: 8 (
See the full list of FAA Registered Aircraft in Sayville )
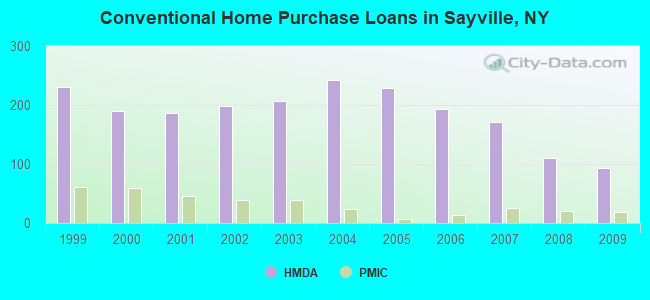
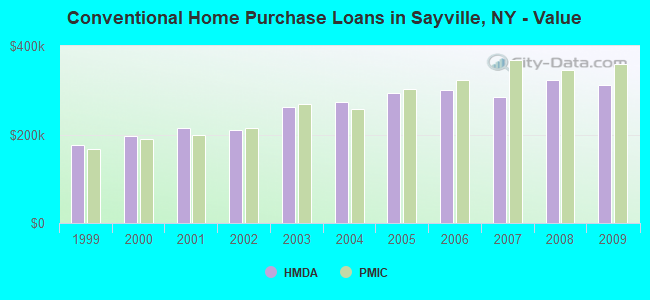
Home Mortgage Disclosure Act Aggregated Statistics For Year 2009(Based on 4 full and 1 partial tracts) A) FHA, FSA/RHS & VA B) Conventional C) Refinancings D) Home Improvement Loans F) Non-occupant Loans on Number Average Value Number Average Value Number Average Value Number Average Value Number Average Value
LOANS ORIGINATED 36 $355,654 93 $311,962 302 $255,764 11 $183,394 18 $277,351 APPLICATIONS APPROVED, NOT ACCEPTED 1 $288,000 8 $315,184 39 $262,028 2 $21,500 1 $200,000 APPLICATIONS DENIED 10 $293,500 11 $248,735 98 $310,773 16 $77,968 5 $251,360 APPLICATIONS WITHDRAWN 5 $332,000 14 $286,840 105 $301,326 5 $174,618 2 $250,785 FILES CLOSED FOR INCOMPLETENESS 0 $0 2 $375,325 11 $329,801 4 $163,488 1 $415,000
Aggregated Statistics For Year 2008(Based on 4 full and 1 partial tracts) A) FHA, FSA/RHS & VA B) Conventional C) Refinancings D) Home Improvement Loans E) Loans on Dwellings For 5+ Families F) Non-occupant Loans on Number Average Value Number Average Value Number Average Value Number Average Value Number Average Value Number Average Value
LOANS ORIGINATED 11 $357,193 110 $323,471 130 $255,255 39 $89,373 2 $3,362,500 9 $365,050 APPLICATIONS APPROVED, NOT ACCEPTED 0 $0 16 $293,312 28 $309,332 5 $92,800 0 $0 2 $215,000 APPLICATIONS DENIED 2 $388,000 26 $330,470 82 $319,865 18 $148,545 0 $0 8 $353,455 APPLICATIONS WITHDRAWN 2 $210,320 11 $372,573 46 $289,417 5 $236,320 0 $0 4 $323,910 FILES CLOSED FOR INCOMPLETENESS 0 $0 1 $318,120 20 $263,385 5 $91,000 0 $0 1 $329,000
Aggregated Statistics For Year 2007(Based on 4 full and 1 partial tracts) A) FHA, FSA/RHS & VA B) Conventional C) Refinancings D) Home Improvement Loans E) Loans on Dwellings For 5+ Families F) Non-occupant Loans on Number Average Value Number Average Value Number Average Value Number Average Value Number Average Value Number Average Value
LOANS ORIGINATED 0 $0 171 $283,923 229 $252,916 68 $100,188 1 $4,125,000 29 $335,537 APPLICATIONS APPROVED, NOT ACCEPTED 0 $0 27 $292,611 48 $296,598 15 $179,318 1 $2,200,000 4 $525,000 APPLICATIONS DENIED 0 $0 54 $279,249 122 $324,702 12 $196,233 0 $0 20 $427,800 APPLICATIONS WITHDRAWN 1 $438,410 28 $256,551 53 $300,803 5 $112,098 0 $0 9 $353,724 FILES CLOSED FOR INCOMPLETENESS 0 $0 7 $353,949 32 $325,172 2 $66,160 0 $0 1 $324,000
Aggregated Statistics For Year 2006(Based on 4 full and 1 partial tracts) B) Conventional C) Refinancings D) Home Improvement Loans E) Loans on Dwellings For 5+ Families F) Non-occupant Loans on G) Loans On Manufactured Number Average Value Number Average Value Number Average Value Number Average Value Number Average Value Number Average Value
LOANS ORIGINATED 194 $300,614 313 $248,351 72 $101,899 1 $600,000 19 $358,284 1 $74,000 APPLICATIONS APPROVED, NOT ACCEPTED 22 $322,059 62 $270,795 8 $95,715 0 $0 3 $333,920 0 $0 APPLICATIONS DENIED 42 $285,985 127 $307,132 27 $121,504 0 $0 12 $328,605 4 $44,750 APPLICATIONS WITHDRAWN 16 $265,310 100 $254,429 6 $95,017 0 $0 5 $210,008 1 $48,000 FILES CLOSED FOR INCOMPLETENESS 5 $283,564 33 $290,830 3 $290,000 0 $0 0 $0 0 $0
Aggregated Statistics For Year 2005(Based on 4 full and 1 partial tracts) B) Conventional C) Refinancings D) Home Improvement Loans F) Non-occupant Loans on G) Loans On Manufactured Number Average Value Number Average Value Number Average Value Number Average Value Number Average Value
LOANS ORIGINATED 228 $293,047 381 $232,827 83 $99,757 28 $374,168 1 $41,000 APPLICATIONS APPROVED, NOT ACCEPTED 28 $293,946 52 $211,326 14 $70,121 2 $389,500 0 $0 APPLICATIONS DENIED 44 $305,565 130 $267,116 23 $196,330 14 $330,706 2 $153,070 APPLICATIONS WITHDRAWN 26 $293,421 128 $226,536 26 $212,875 5 $333,800 0 $0 FILES CLOSED FOR INCOMPLETENESS 10 $289,172 75 $256,092 5 $127,320 1 $118,000 0 $0
Aggregated Statistics For Year 2004(Based on 4 full and 1 partial tracts) A) FHA, FSA/RHS & VA B) Conventional C) Refinancings D) Home Improvement Loans E) Loans on Dwellings For 5+ Families F) Non-occupant Loans on G) Loans On Manufactured Number Average Value Number Average Value Number Average Value Number Average Value Number Average Value Number Average Value Number Average Value
LOANS ORIGINATED 1 $294,000 242 $274,317 417 $208,413 90 $98,247 5 $4,745,600 25 $354,932 2 $125,910 APPLICATIONS APPROVED, NOT ACCEPTED 0 $0 35 $337,300 65 $245,454 22 $107,032 1 $60,000 1 $127,510 0 $0 APPLICATIONS DENIED 0 $0 40 $266,240 104 $232,644 36 $76,866 0 $0 16 $306,176 0 $0 APPLICATIONS WITHDRAWN 0 $0 28 $281,248 126 $220,651 14 $154,349 1 $585,000 6 $304,833 1 $250,000 FILES CLOSED FOR INCOMPLETENESS 0 $0 13 $266,131 44 $257,472 3 $124,133 0 $0 1 $150,000 0 $0
Aggregated Statistics For Year 2003(Based on 4 full and 1 partial tracts) A) FHA, FSA/RHS & VA B) Conventional C) Refinancings D) Home Improvement Loans E) Loans on Dwellings For 5+ Families F) Non-occupant Loans on Number Average Value Number Average Value Number Average Value Number Average Value Number Average Value Number Average Value
LOANS ORIGINATED 1 $349,940 207 $263,275 1,045 $193,645 73 $53,007 1 $1,575,000 51 $278,288 APPLICATIONS APPROVED, NOT ACCEPTED 0 $0 24 $276,436 164 $199,341 17 $63,132 0 $0 8 $339,975 APPLICATIONS DENIED 0 $0 26 $300,103 209 $232,053 34 $57,759 0 $0 17 $278,363 APPLICATIONS WITHDRAWN 0 $0 19 $248,665 195 $209,114 11 $52,684 0 $0 7 $178,050 FILES CLOSED FOR INCOMPLETENESS 0 $0 7 $257,293 40 $202,836 4 $129,225 0 $0 1 $171,000
Aggregated Statistics For Year 2002(Based on 4 full and 1 partial tracts) A) FHA, FSA/RHS & VA B) Conventional C) Refinancings D) Home Improvement Loans F) Non-occupant Loans on Number Average Value Number Average Value Number Average Value Number Average Value Number Average Value
LOANS ORIGINATED 4 $213,062 199 $210,916 730 $174,147 107 $67,377 26 $221,079 APPLICATIONS APPROVED, NOT ACCEPTED 0 $0 16 $238,258 113 $168,727 21 $56,281 6 $361,167 APPLICATIONS DENIED 0 $0 25 $173,187 129 $188,918 38 $59,003 8 $183,091 APPLICATIONS WITHDRAWN 3 $200,000 16 $207,081 152 $200,012 38 $43,792 7 $303,343 FILES CLOSED FOR INCOMPLETENESS 0 $0 4 $169,235 44 $168,471 3 $136,667 0 $0
Aggregated Statistics For Year 2001(Based on 4 full and 1 partial tracts) A) FHA, FSA/RHS & VA B) Conventional C) Refinancings D) Home Improvement Loans E) Loans on Dwellings For 5+ Families F) Non-occupant Loans on Number Average Value Number Average Value Number Average Value Number Average Value Number Average Value Number Average Value
LOANS ORIGINATED 7 $159,810 187 $214,104 537 $157,391 86 $50,021 4 $402,750 25 $266,318 APPLICATIONS APPROVED, NOT ACCEPTED 1 $236,820 20 $187,339 85 $142,102 28 $47,041 2 $224,500 7 $275,857 APPLICATIONS DENIED 0 $0 25 $247,927 144 $164,556 39 $48,405 0 $0 5 $181,626 APPLICATIONS WITHDRAWN 2 $171,760 23 $206,876 125 $139,503 25 $37,082 0 $0 5 $275,600 FILES CLOSED FOR INCOMPLETENESS 0 $0 5 $295,552 26 $175,404 4 $51,250 0 $0 0 $0
Aggregated Statistics For Year 2000(Based on 4 full and 1 partial tracts) A) FHA, FSA/RHS & VA B) Conventional C) Refinancings D) Home Improvement Loans F) Non-occupant Loans on Number Average Value Number Average Value Number Average Value Number Average Value Number Average Value
LOANS ORIGINATED 6 $166,110 189 $196,645 156 $107,794 102 $40,414 23 $246,284 APPLICATIONS APPROVED, NOT ACCEPTED 0 $0 23 $197,293 34 $145,644 26 $34,081 1 $900,000 APPLICATIONS DENIED 2 $159,940 36 $213,544 80 $128,758 48 $37,284 9 $308,000 APPLICATIONS WITHDRAWN 2 $197,000 22 $199,079 81 $92,696 11 $78,073 4 $250,122 FILES CLOSED FOR INCOMPLETENESS 0 $0 5 $185,076 19 $146,469 7 $24,000 0 $0
Aggregated Statistics For Year 1999(Based on 4 full and 1 partial tracts) A) FHA, FSA/RHS & VA B) Conventional C) Refinancings D) Home Improvement Loans F) Non-occupant Loans on Number Average Value Number Average Value Number Average Value Number Average Value Number Average Value
LOANS ORIGINATED 26 $151,880 230 $175,918 323 $117,934 84 $30,856 49 $219,655 APPLICATIONS APPROVED, NOT ACCEPTED 0 $0 18 $185,978 78 $113,561 24 $30,229 7 $200,384 APPLICATIONS DENIED 1 $216,390 35 $210,619 82 $106,916 40 $34,180 14 $182,326 APPLICATIONS WITHDRAWN 4 $119,970 18 $161,872 90 $105,261 19 $66,188 3 $139,753 FILES CLOSED FOR INCOMPLETENESS 2 $126,465 7 $200,194 22 $125,038 2 $96,120 2 $195,500
Detailed HMDA statistics for the following Tracts:
1477.01
, 1478.02 , 1478.03 , 1478.04 , 1479.01
Private Mortgage Insurance Companies Aggregated Statistics For Year 2009(Based on 4 full and 1 partial tracts) A) Conventional B) Refinancings Number Average Value Number Average Value
LOANS ORIGINATED 19 $358,292 5 $425,000 APPLICATIONS APPROVED, NOT ACCEPTED 4 $279,750 1 $321,290 APPLICATIONS DENIED 4 $294,368 2 $271,870 APPLICATIONS WITHDRAWN 3 $350,627 1 $461,600 FILES CLOSED FOR INCOMPLETENESS 0 $0 1 $356,000
Aggregated Statistics For Year 2008(Based on 4 full and 1 partial tracts) A) Conventional B) Refinancings C) Non-occupant Loans on Number Average Value Number Average Value Number Average Value
LOANS ORIGINATED 21 $346,534 3 $372,333 0 $0 APPLICATIONS APPROVED, NOT ACCEPTED 6 $346,250 10 $460,279 0 $0 APPLICATIONS DENIED 5 $310,206 1 $360,000 1 $167,000 APPLICATIONS WITHDRAWN 0 $0 0 $0 0 $0 FILES CLOSED FOR INCOMPLETENESS 0 $0 2 $366,500 0 $0
Aggregated Statistics For Year 2007(Based on 4 full and 1 partial tracts) A) Conventional B) Refinancings C) Non-occupant Loans on D) Loans On Manufactured Number Average Value Number Average Value Number Average Value Number Average Value
LOANS ORIGINATED 25 $367,718 3 $388,233 2 $348,000 1 $144,000 APPLICATIONS APPROVED, NOT ACCEPTED 2 $174,500 1 $623,440 0 $0 0 $0 APPLICATIONS DENIED 0 $0 0 $0 0 $0 0 $0 APPLICATIONS WITHDRAWN 0 $0 0 $0 0 $0 0 $0 FILES CLOSED FOR INCOMPLETENESS 2 $351,500 0 $0 0 $0 0 $0
Aggregated Statistics For Year 2006(Based on 4 full and 1 partial tracts) A) Conventional B) Refinancings Number Average Value Number Average Value
LOANS ORIGINATED 14 $324,124 0 $0 APPLICATIONS APPROVED, NOT ACCEPTED 3 $355,853 3 $383,333 APPLICATIONS DENIED 0 $0 0 $0 APPLICATIONS WITHDRAWN 1 $310,000 1 $414,000 FILES CLOSED FOR INCOMPLETENESS 0 $0 0 $0
Aggregated Statistics For Year 2005(Based on 4 full and 1 partial tracts) A) Conventional B) Refinancings C) Non-occupant Loans on Number Average Value Number Average Value Number Average Value
LOANS ORIGINATED 7 $303,667 1 $423,000 0 $0 APPLICATIONS APPROVED, NOT ACCEPTED 1 $315,000 2 $406,000 1 $330,000 APPLICATIONS DENIED 0 $0 0 $0 0 $0 APPLICATIONS WITHDRAWN 1 $220,440 0 $0 0 $0 FILES CLOSED FOR INCOMPLETENESS 0 $0 0 $0 0 $0
Aggregated Statistics For Year 2004(Based on 4 full and 1 partial tracts) A) Conventional B) Refinancings Number Average Value Number Average Value
LOANS ORIGINATED 23 $256,751 1 $409,940 APPLICATIONS APPROVED, NOT ACCEPTED 8 $310,526 1 $219,000 APPLICATIONS DENIED 0 $0 0 $0 APPLICATIONS WITHDRAWN 2 $368,890 1 $329,000 FILES CLOSED FOR INCOMPLETENESS 0 $0 0 $0
Aggregated Statistics For Year 2003(Based on 4 full and 1 partial tracts) A) Conventional B) Refinancings C) Non-occupant Loans on Number Average Value Number Average Value Number Average Value
LOANS ORIGINATED 39 $269,904 10 $237,700 1 $301,230 APPLICATIONS APPROVED, NOT ACCEPTED 19 $283,633 3 $219,510 2 $212,000 APPLICATIONS DENIED 2 $248,000 0 $0 0 $0 APPLICATIONS WITHDRAWN 3 $276,000 3 $233,667 0 $0 FILES CLOSED FOR INCOMPLETENESS 1 $48,000 0 $0 0 $0
Aggregated Statistics For Year 2002(Based on 4 full and 1 partial tracts) A) Conventional B) Refinancings C) Non-occupant Loans on Number Average Value Number Average Value Number Average Value
LOANS ORIGINATED 39 $214,635 11 $269,147 1 $233,000 APPLICATIONS APPROVED, NOT ACCEPTED 16 $237,515 7 $300,424 3 $274,333 APPLICATIONS DENIED 3 $259,667 0 $0 0 $0 APPLICATIONS WITHDRAWN 2 $233,380 1 $297,000 0 $0 FILES CLOSED FOR INCOMPLETENESS 1 $58,000 1 $218,640 0 $0
Aggregated Statistics For Year 2001(Based on 4 full and 1 partial tracts) A) Conventional B) Refinancings C) Non-occupant Loans on Number Average Value Number Average Value Number Average Value
LOANS ORIGINATED 45 $199,214 19 $223,658 1 $198,000 APPLICATIONS APPROVED, NOT ACCEPTED 17 $230,362 4 $255,100 1 $176,000 APPLICATIONS DENIED 1 $275,000 0 $0 0 $0 APPLICATIONS WITHDRAWN 1 $117,220 2 $231,400 0 $0 FILES CLOSED FOR INCOMPLETENESS 1 $58,000 0 $0 0 $0
Aggregated Statistics For Year 2000(Based on 4 full and 1 partial tracts) A) Conventional B) Refinancings C) Non-occupant Loans on Number Average Value Number Average Value Number Average Value
LOANS ORIGINATED 59 $189,056 2 $162,000 0 $0 APPLICATIONS APPROVED, NOT ACCEPTED 7 $130,070 0 $0 0 $0 APPLICATIONS DENIED 2 $177,000 0 $0 0 $0 APPLICATIONS WITHDRAWN 3 $243,333 0 $0 1 $252,000 FILES CLOSED FOR INCOMPLETENESS 1 $194,000 0 $0 0 $0
Aggregated Statistics For Year 1999(Based on 4 full and 1 partial tracts) A) Conventional B) Refinancings Number Average Value Number Average Value
LOANS ORIGINATED 61 $167,610 20 $150,197 APPLICATIONS APPROVED, NOT ACCEPTED 8 $151,064 1 $150,040 APPLICATIONS DENIED 2 $242,385 0 $0 APPLICATIONS WITHDRAWN 1 $172,700 1 $169,790 FILES CLOSED FOR INCOMPLETENESS 0 $0 0 $0
Detailed PMIC statistics for the following Tracts:
1477.01
, 1478.02 , 1478.03 , 1478.04 , 1479.01 Sayville compared to New York state average:
Median household income above state average. Median house value above state average. Unemployed percentage significantly below state average. Black race population percentage significantly below state average. Hispanic race population percentage significantly below state average. Foreign-born population percentage significantly below state average. Renting percentage below state average. Length of stay since moving in significantly above state average. Number of rooms per house above state average. Institutionalized population percentage above state average. Percentage of population with a bachelor's degree or higher above state average.
#26 on the list of "Top 101 cities with largest percentage of females in occupations: education, training, and library occupations (population 5,000+)"
#97 on the list of "Top 101 cities with largest percentage of females in occupations: community and social service occupations (population 5,000+)"
#3 on the list of "Top 101 counties with the most Catholic adherents"
#6 on the list of "Top 101 counties with the lowest percentage of residents relocating from other counties between 2010 and 2011"
#7 on the list of "Top 101 counties with the lowest surface withdrawal of fresh water for public supply (pop. 50,000+)"
#9 on the list of "Top 101 counties with the lowest percentage of residents relocating to other counties in 2011"
#19 on the list of "Top 101 counties with the highest ground withdrawal of fresh water for public supply (pop. 50,000+)"
Top Patent Applicants
Brian Volk (7)
Kenneth Braganca (5)
Michael Tkachuk (5)
Yaacov Apelbaum (4)
John Dudley Dreher (4)
Thomas Lackemann (4)
Jeffrey Neal Slotnick (3)
Patrick M. Lavelle (3)
John L. Szeglin (3)
Michael Ferrara (2)
Total of 75 patent applications in 2008-2024.


 Recent articles from our blog. Our writers, many of them Ph.D. graduates or candidates, create easy-to-read articles on a wide variety of topics.

 (8.9 miles
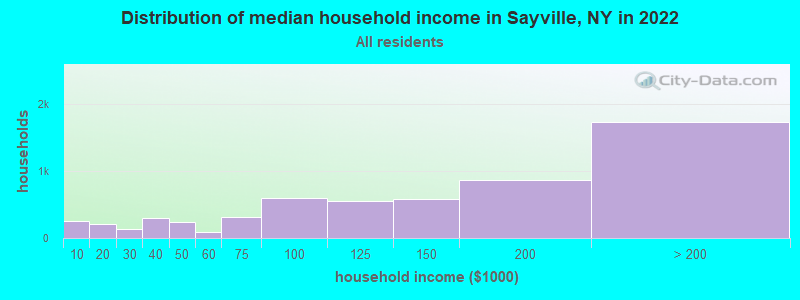


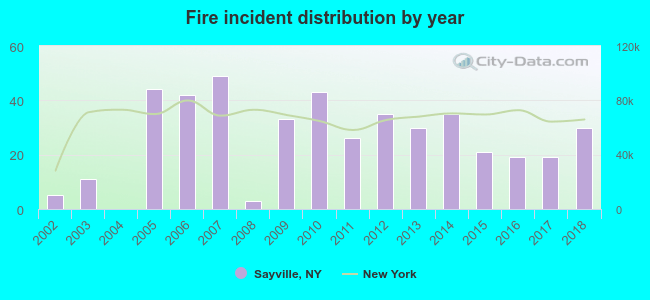 Based on the data from the years 2002 - 2018 the average number of fires per year is 26. The highest number of fire incidents - 49 took place in 2007, and the least - 0 in 2004. The data has a rising trend.
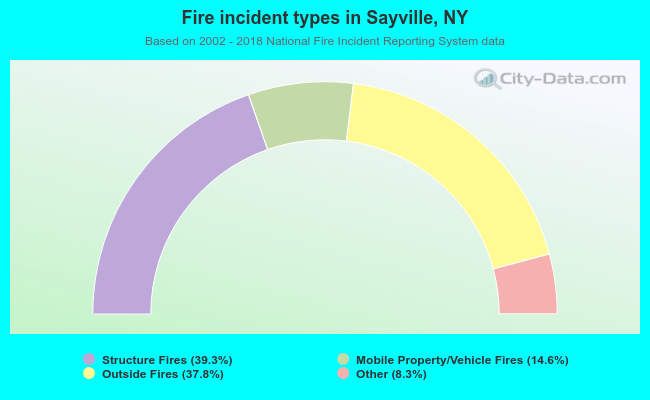 When looking into fire subcategories, the most incidents belonged to: Structure Fires (39.3%), and Outside Fires (37.8%).