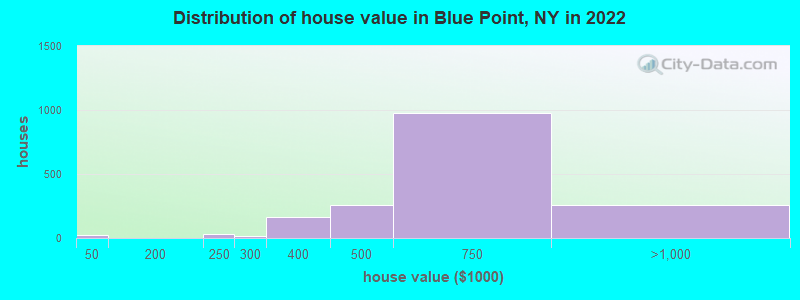
Estimated median house or condo value in 2022: $631,535 (it was $193,800 in 2000)
Blue Point:
$631,535
NY:
$400,400
Mean prices in 2022:all housing units: $574,204; detached houses: $561,746; townhouses or other attached units: $649,099; in 3-to-4-unit structures: $370,542
Median gross rent in 2022: $2,180.
March 2022 cost of living index in Blue Point: 152.3 (very high, U.S. average is 100)
According to our research of New York and other state lists, there was 1 registered sex offender living in Blue Point, New York as of July 02, 2024. The ratio of all residents to sex offenders in Blue Point is 4,564 to 1. The ratio of registered sex offenders to all residents in this city is much lower than the state average.
Recent articles from our blog. Our writers, many of them Ph.D. graduates or candidates, create easy-to-read articles on a wide variety of topics.
Latest news from Blue Point, NY collected exclusively by city-data.com from local newspapers, TV, and radio stations
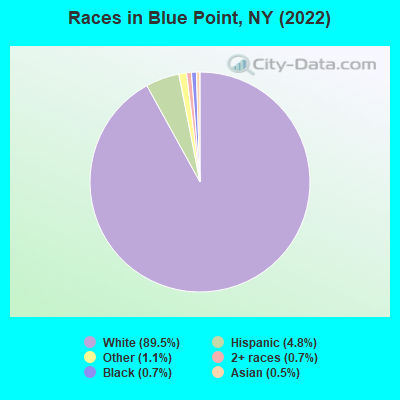
Ancestries: Italian (26.9%), German (16.7%), Irish (10.7%), American (9.3%), Ukrainian (6.4%), English (6.3%).
Current Local Time: EST time zone
Elevation: 10 feet
Land area: 1.78 square miles.
Population density: 2,680 people per square mile (average).
223 residents are foreign born (3.2% Europe, 1.2% Latin America, 0.5% Asia).
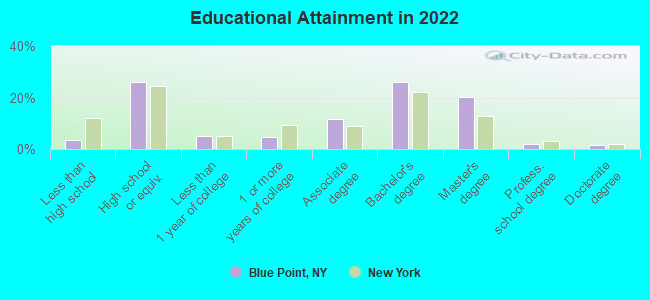
This place:
4.8%
New York:
22.6%
Median real estate property taxes paid for housing units with mortgages in 2022: $10,001 (1.6%) Median real estate property taxes paid for housing units with no mortgage in 2022: $9,738 (1.6%)
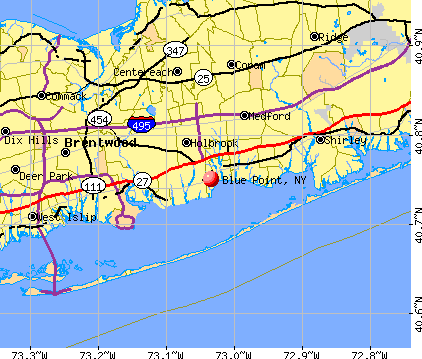
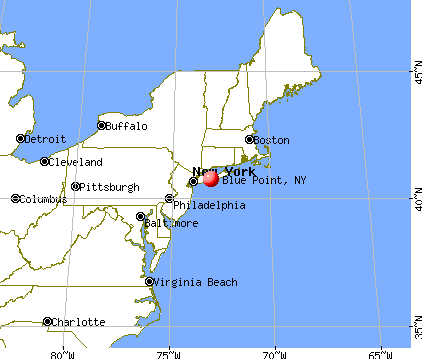
Nearest city with pop. 50,000+: Brentwood, NY (11.2 miles , pop. 53,917).
Nearest city with pop. 200,000+: North Hempstead, NY (33.2 miles , pop. 222,611).
Nearest city with pop. 1,000,000+: Queens, NY (41.3 miles , pop. 2,229,379).
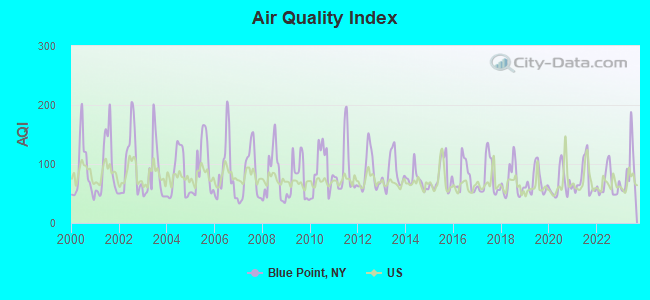
Air Quality Index (AQI) level in 2023 was 88.3. This is worse than average.
City:
88.3
U.S.:
72.6
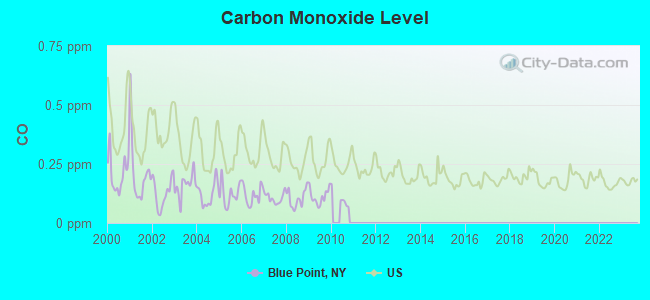
Carbon Monoxide (CO) [ppm] level in 2009 was 0.112. This is significantly better than average.Closest monitor was 5.5 miles away from the city center.
City:
0.112
U.S.:
0.251
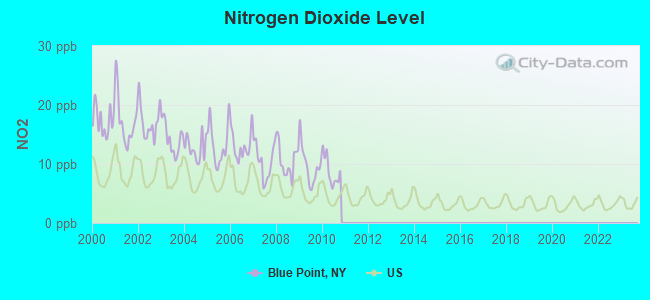
Nitrogen Dioxide (NO2) [ppb] level in 2010 was 8.78. This is significantly worse than average.Closest monitor was 5.5 miles away from the city center.
City:
8.78
U.S.:
5.11
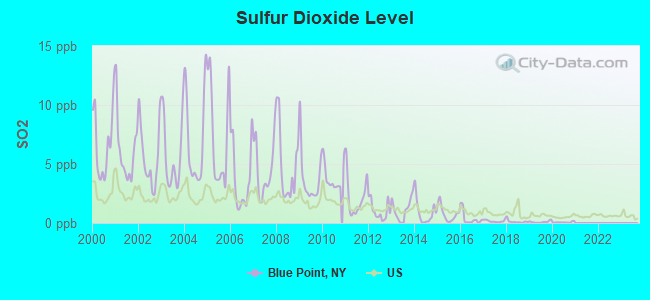
Sulfur Dioxide (SO2) [ppb] level in 2020 was 0.0629. This is significantly better than average.Closest monitor was 5.2 miles away from the city center.
City:
0.0629
U.S.:
1.5147
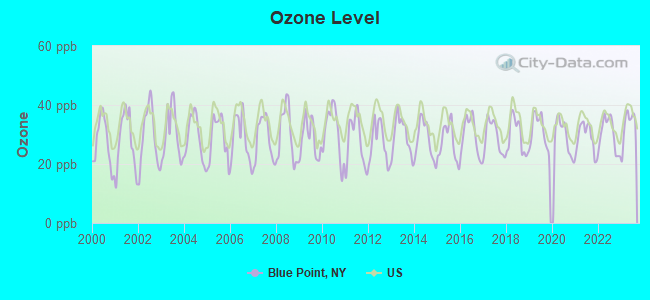
Ozone [ppb] level in 2023 was 33.3. This is about average.Closest monitor was 5.5 miles away from the city center.
City:
33.3
U.S.:
33.3
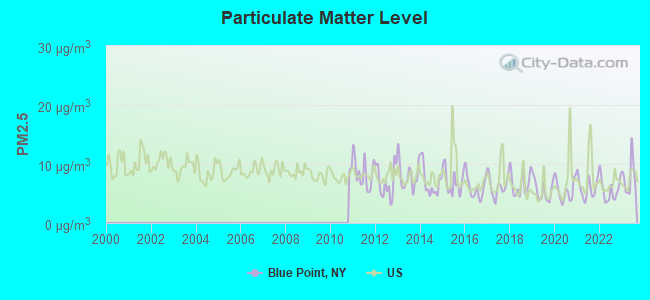
Particulate Matter (PM2.5) [µg/m3] level in 2023 was 7.79. This is about average.Closest monitor was 20.2 miles away from the city center.
City:
7.79
U.S.:
8.11
Tornado activity:
Blue Point-area historical tornado activity is near New York state average. It is 64% smaller than the overall U.S. average.
On 7/10/1989, a category F4 (max. wind speeds 207-260 mph) tornado 39.9 miles away from the Blue Point place center injured 40 peopleand causedbetween $50,000,000 and $500,000,000 in damages.
On 7/10/1989, a category F2 (max. wind speeds 113-157 mph) tornado 14.2 miles away from the place center injured one person.
Earthquake activity:
Blue Point-area historical earthquake activity is significantly above New York state average. It is 72% smaller than the overall U.S. average.
On 10/7/1983 at 10:18:46, a magnitude 5.3 (5.1 MB, 5.3 LG, 5.1 ML, Class: Moderate, Intensity: VI - VII) earthquake occurred 231.4 miles away from Blue Point center On 8/23/2011 at 17:51:04, a magnitude 5.8 (5.8 MW, Depth: 3.7 mi) earthquake occurred 327.6 miles away from the city center On 4/20/2002 at 10:50:47, a magnitude 5.3 (5.3 ML, Depth: 3.0 mi) earthquake occurred 262.4 miles away from Blue Point center On 8/22/1992 at 12:20:32, a magnitude 4.8 (4.8 MB, 3.8 MS, 4.7 LG, Depth: 6.2 mi, Class: Light, Intensity: IV - V) earthquake occurred 183.5 miles away from the city center On 4/20/2002 at 10:50:47, a magnitude 5.2 (5.2 MB, 4.2 MS, 5.2 MW, 5.0 MW) earthquake occurred 260.8 miles away from Blue Point center On 1/16/1994 at 01:49:16, a magnitude 4.6 (4.6 MB, 4.6 LG, Depth: 3.1 mi) earthquake occurred 160.5 miles away from Blue Point center Magnitude types: regional Lg-wave magnitude (LG), body-wave magnitude (MB), local magnitude (ML), surface-wave magnitude (MS), moment magnitude (MW)
Natural disasters:
The number of natural disasters in Suffolk County (28) is a lot greater than the US average (15). Major Disasters (Presidential) Declared: 19 Emergencies Declared: 7
Causes of natural disasters: Hurricanes: 9, Floods: 7, Storms: 7, Snowstorms: 4, Winter Storms: 3, Blizzards: 2, Heavy Rain: 1, Power Outage: 1, Tropical Depression: 1, Tropical Storm: 1, Water Shortage: 1, Other: 3 (Note: some incidents may be assigned to more than one category).
Hospitals and medical centers near Blue Point:
BROOKHAVEN MEMORIAL HOSP (Dialysis Facility, about 2 miles away; PATCHOGUE, NY)
BROOKHAVEN MEM HOSP MEDICAL CTR HOSPICE (Hospital, about 2 miles away; PATCHOGUE, NY)
BROOKHAVEN MEM HOSP CHHA (Home Health Center, about 2 miles away; PATCHOGUE, NY)
PETITE FLEUR NURSING HOME (Nursing Home, about 2 miles away; SAYVILLE, NY)
GOOD SAMARITAN NURSING HOME (Nursing Home, about 3 miles away; SAYVILLE, NY)
BROOKHAVEN MEMORIAL HOSPITAL MEDICAL CENTER (Dialysis Facility, about 4 miles away; PATCHOGUE, NY)
BROOKHAVEN MEMORIAL HOSPITAL MEDICAL CENTER Acute Care Hospitals (about 4 miles away; PATCHOGUE, NY)
Colleges/universities with over 2000 students nearest to Blue Point:
Dowling College (about 7 miles; Oakdale, NY; Full-time enrollment: 2,598)
Suffolk County Community College (about 7 miles; Selden, NY; FT enrollment: 18,540)
Stony Brook University (about 13 miles; Stony Brook, NY; FT enrollment: 22,071)
Farmingdale State College (about 21 miles; Farmingdale, NY; FT enrollment: 6,956)
Briarcliffe College (about 25 miles; Bethpage, NY; FT enrollment: 2,134)
SUNY College at Old Westbury (about 29 miles; Old Westbury, NY; FT enrollment: 4,096)
Nassau Community College (about 30 miles; Garden City, NY; FT enrollment: 18,552)
BAYPORT-BLUE POINT PUBLIC LIBRARY (Operating income: $1,981,387; Location: 203 BLUE POINT AVENUE; 108,446 books; 4,881 e-books; 10,494 audio materials; 11,127 video materials; 42 local licensed databases; 14 state licensed databases; 6 other licensed databases; 259 print serial subscriptions; 10,470 electronic serial subscriptions)
Churches in Blue Point include: Saint Johns Church (A), Our Lady of the Snow Roman Catholic Church (B), Blue Point Bible Church (C). Display/hide their locations on the map
Suffolk County has a predicted average indoor radon screening level less than 2 pCi/L (pico curies per liter) - Low Potential
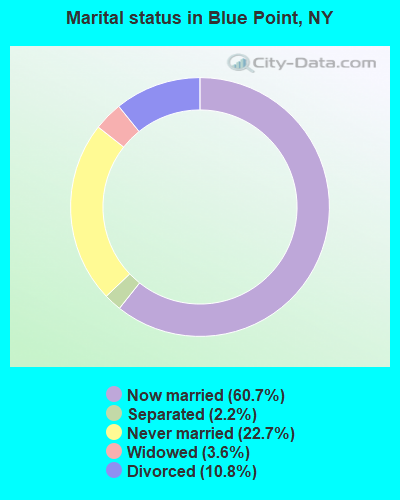
Average household size:
This place:
2.8 people
New York:
2.6 people
Percentage of family households:
This place:
76.3%
Whole state:
63.5%
Percentage of households with unmarried partners:
This place:
5.4%
Whole state:
6.8%
Likely homosexual households (counted as self-reported same-sex unmarried-partner households)
Lesbian couples: 0.7% of all households
Gay men: 0.8% of all households
People in group quarters in Blue Point in 2010:
19 people in other noninstitutional facilities
15 people in emergency and transitional shelters (with sleeping facilities) for people experiencing homelessness
5 people in group homes intended for adults
5 people in residential treatment centers for adults
22 people in other noninstitutional group quarters in 2000
21 people in religious group quarters in 2000
Banks with branches in Blue Point (2011 data):
Capital One, National Association: Blue Point Branch at 60 Montauk Highway, branch established on 1935/11/25. Info updated 2011/07/01: Bank assets: $133,477.8 mil, Deposits: $97,063.7 mil, headquarters in Mclean, VA, positive income, 984 total offices, Holding Company: Capital One Financial Corporation
Religion statistics for Blue Point, NY (based on Suffolk County data)
Religion
Adherents
Congregations
Catholic
879,457
75
Mainline Protestant
69,205
182
Evangelical Protestant
58,909
264
Other
50,771
124
Orthodox
10,190
10
Black Protestant
8,298
49
None
416,520
-
Source: Clifford Grammich, Kirk Hadaway, Richard Houseal, Dale E.Jones, Alexei Krindatch, Richie Stanley and Richard H.Taylor. 2012. 2010 U.S.Religion Census: Religious Congregations & Membership Study. Association of Statisticians of American Religious Bodies. Jones, Dale E., et al. 2002. Congregations and Membership in the United States 2000. Nashville, TN: Glenmary Research Center. Graphs represent county-level data
Aircraft: CESSNA 152 (Category: Land, Seats: 2, Weight: Up to 12,499 Pounds), Engine: LYCOMING 0-235 SERIES (115 HP) (4 Cycle) N-Number: 216DV, N216DV, N-216DV, Serial Number: 15280927, Year manufactured: 1977, Airworthiness Date: 11/22/1977, Certificate Issue Date: 10/07/2016 Registrant (Individual): Elizabeth M Busch-Joss, 2 Dietz Ct, Blue Point, NY 11715
Aircraft: PIPER PA-28-181 (Category: Land, Seats: 4, Weight: Up to 12,499 Pounds, Speed: 105 mph), Engine: LYCOMING O&VO-360 SER (180 HP) (Reciprocating) N-Number: 9288K, N9288K, N-9288K, Serial Number: 28-7690240, Year manufactured: 1976, Airworthiness Date: 03/23/1976, Certificate Issue Date: 09/11/2020 Registrant (Corporation): Vlb Inc, 25 Avery Way, Blue Point, NY 11772
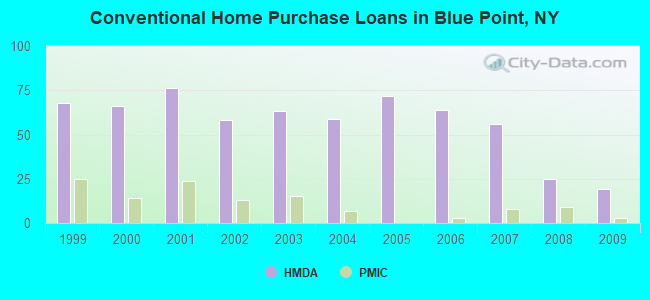
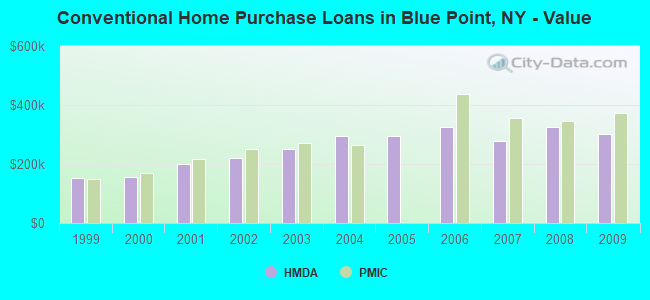
Home Mortgage Disclosure Act Aggregated Statistics For Year 2009 (Based on 1 full tract)
A) FHA, FSA/RHS & VA Home Purchase Loans
B) Conventional Home Purchase Loans
C) Refinancings
D) Home Improvement Loans
F) Non-occupant Loans on < 5 Family Dwellings (A B C & D)
Number
Average Value
Number
Average Value
Number
Average Value
Number
Average Value
Number
Average Value
LOANS ORIGINATED
10
$321,500
19
$303,000
84
$247,238
5
$129,400
3
$272,000
APPLICATIONS APPROVED, NOT ACCEPTED
0
$0
0
$0
14
$315,643
0
$0
1
$125,000
APPLICATIONS DENIED
0
$0
3
$273,333
41
$303,073
2
$137,000
3
$195,000
APPLICATIONS WITHDRAWN
1
$250,000
2
$292,500
29
$331,448
2
$175,000
1
$300,000
FILES CLOSED FOR INCOMPLETENESS
0
$0
1
$290,000
7
$295,714
0
$0
1
$290,000
Aggregated Statistics For Year 2008 (Based on 1 full tract)
A) FHA, FSA/RHS & VA Home Purchase Loans
B) Conventional Home Purchase Loans
C) Refinancings
D) Home Improvement Loans
F) Non-occupant Loans on < 5 Family Dwellings (A B C & D)
Number
Average Value
Number
Average Value
Number
Average Value
Number
Average Value
Number
Average Value
LOANS ORIGINATED
4
$398,750
25
$326,040
48
$243,292
14
$70,143
6
$273,000
APPLICATIONS APPROVED, NOT ACCEPTED
1
$320,000
2
$382,000
13
$288,846
2
$210,500
0
$0
APPLICATIONS DENIED
1
$239,000
4
$252,000
29
$266,172
2
$87,500
2
$160,000
APPLICATIONS WITHDRAWN
0
$0
5
$291,400
19
$312,474
2
$70,500
0
$0
FILES CLOSED FOR INCOMPLETENESS
0
$0
0
$0
4
$190,500
2
$96,500
0
$0
Aggregated Statistics For Year 2007 (Based on 1 full tract)
A) FHA, FSA/RHS & VA Home Purchase Loans
B) Conventional Home Purchase Loans
C) Refinancings
D) Home Improvement Loans
F) Non-occupant Loans on < 5 Family Dwellings (A B C & D)
Number
Average Value
Number
Average Value
Number
Average Value
Number
Average Value
Number
Average Value
LOANS ORIGINATED
1
$337,000
56
$276,839
80
$256,650
21
$69,476
5
$271,400
APPLICATIONS APPROVED, NOT ACCEPTED
0
$0
7
$216,571
8
$194,750
8
$54,500
0
$0
APPLICATIONS DENIED
0
$0
18
$283,000
44
$322,364
16
$73,312
4
$284,000
APPLICATIONS WITHDRAWN
0
$0
9
$242,111
9
$188,889
6
$136,167
0
$0
FILES CLOSED FOR INCOMPLETENESS
0
$0
6
$297,667
7
$246,429
1
$275,000
0
$0
Aggregated Statistics For Year 2006 (Based on 1 full tract)
B) Conventional Home Purchase Loans
C) Refinancings
D) Home Improvement Loans
F) Non-occupant Loans on < 5 Family Dwellings (A B C & D)
Number
Average Value
Number
Average Value
Number
Average Value
Number
Average Value
LOANS ORIGINATED
64
$324,250
97
$258,722
24
$116,083
6
$336,333
APPLICATIONS APPROVED, NOT ACCEPTED
10
$294,800
14
$279,429
1
$275,000
2
$365,500
APPLICATIONS DENIED
14
$286,643
57
$359,211
12
$88,167
1
$743,000
APPLICATIONS WITHDRAWN
6
$202,167
41
$281,854
3
$225,000
1
$200,000
FILES CLOSED FOR INCOMPLETENESS
4
$293,000
23
$274,913
1
$25,000
0
$0
Aggregated Statistics For Year 2005 (Based on 1 full tract)
B) Conventional Home Purchase Loans
C) Refinancings
D) Home Improvement Loans
F) Non-occupant Loans on < 5 Family Dwellings (A B C & D)
Number
Average Value
Number
Average Value
Number
Average Value
Number
Average Value
LOANS ORIGINATED
72
$294,153
109
$240,083
21
$113,524
10
$259,600
APPLICATIONS APPROVED, NOT ACCEPTED
10
$313,400
11
$257,364
2
$140,000
0
$0
APPLICATIONS DENIED
8
$213,625
27
$279,963
6
$143,833
0
$0
APPLICATIONS WITHDRAWN
11
$310,000
19
$296,368
4
$184,250
0
$0
FILES CLOSED FOR INCOMPLETENESS
2
$191,500
30
$266,233
0
$0
0
$0
Aggregated Statistics For Year 2004 (Based on 1 full tract)
B) Conventional Home Purchase Loans
C) Refinancings
D) Home Improvement Loans
F) Non-occupant Loans on < 5 Family Dwellings (A B C & D)
G) Loans On Manufactured Home Dwelling (A B C & D)
Number
Average Value
Number
Average Value
Number
Average Value
Number
Average Value
Number
Average Value
LOANS ORIGINATED
59
$294,305
146
$212,021
35
$121,486
11
$276,455
1
$7,000
APPLICATIONS APPROVED, NOT ACCEPTED
9
$259,333
19
$226,579
5
$86,000
1
$308,000
0
$0
APPLICATIONS DENIED
3
$220,000
50
$258,680
15
$59,333
0
$0
0
$0
APPLICATIONS WITHDRAWN
5
$335,200
54
$263,130
8
$108,125
2
$301,500
0
$0
FILES CLOSED FOR INCOMPLETENESS
2
$168,500
13
$248,308
4
$108,250
0
$0
0
$0
Aggregated Statistics For Year 2003 (Based on 1 full tract)
A) FHA, FSA/RHS & VA Home Purchase Loans
B) Conventional Home Purchase Loans
C) Refinancings
D) Home Improvement Loans
F) Non-occupant Loans on < 5 Family Dwellings (A B C & D)
Number
Average Value
Number
Average Value
Number
Average Value
Number
Average Value
Number
Average Value
LOANS ORIGINATED
2
$431,500
63
$250,413
332
$188,274
25
$64,600
5
$188,800
APPLICATIONS APPROVED, NOT ACCEPTED
0
$0
7
$211,571
50
$197,300
3
$28,333
0
$0
APPLICATIONS DENIED
0
$0
11
$272,909
55
$210,927
19
$81,737
3
$258,000
APPLICATIONS WITHDRAWN
1
$285,000
9
$268,333
55
$203,364
10
$61,300
2
$165,000
FILES CLOSED FOR INCOMPLETENESS
0
$0
0
$0
17
$187,294
1
$30,000
0
$0
Aggregated Statistics For Year 2002 (Based on 1 full tract)
A) FHA, FSA/RHS & VA Home Purchase Loans
B) Conventional Home Purchase Loans
C) Refinancings
D) Home Improvement Loans
F) Non-occupant Loans on < 5 Family Dwellings (A B C & D)
Number
Average Value
Number
Average Value
Number
Average Value
Number
Average Value
Number
Average Value
LOANS ORIGINATED
5
$219,800
58
$219,362
222
$156,495
37
$54,676
8
$162,500
APPLICATIONS APPROVED, NOT ACCEPTED
0
$0
11
$228,182
48
$168,604
11
$30,545
3
$209,000
APPLICATIONS DENIED
1
$192,000
2
$176,000
42
$176,190
15
$57,600
0
$0
APPLICATIONS WITHDRAWN
1
$259,000
4
$208,500
59
$190,746
6
$82,500
0
$0
FILES CLOSED FOR INCOMPLETENESS
0
$0
1
$198,000
11
$176,818
0
$0
1
$141,000
Aggregated Statistics For Year 2001 (Based on 1 full tract)
A) FHA, FSA/RHS & VA Home Purchase Loans
B) Conventional Home Purchase Loans
C) Refinancings
D) Home Improvement Loans
F) Non-occupant Loans on < 5 Family Dwellings (A B C & D)
Number
Average Value
Number
Average Value
Number
Average Value
Number
Average Value
Number
Average Value
LOANS ORIGINATED
1
$185,000
76
$199,776
168
$151,464
28
$36,750
4
$140,750
APPLICATIONS APPROVED, NOT ACCEPTED
1
$97,000
5
$197,600
27
$132,741
11
$30,273
1
$75,000
APPLICATIONS DENIED
2
$206,500
5
$214,600
55
$131,836
12
$39,417
1
$90,000
APPLICATIONS WITHDRAWN
1
$215,000
6
$193,000
48
$124,500
6
$27,333
3
$43,333
FILES CLOSED FOR INCOMPLETENESS
0
$0
1
$40,000
4
$136,500
3
$60,000
0
$0
Aggregated Statistics For Year 2000 (Based on 1 full tract)
A) FHA, FSA/RHS & VA Home Purchase Loans
B) Conventional Home Purchase Loans
C) Refinancings
D) Home Improvement Loans
F) Non-occupant Loans on < 5 Family Dwellings (A B C & D)
Number
Average Value
Number
Average Value
Number
Average Value
Number
Average Value
Number
Average Value
LOANS ORIGINATED
7
$145,571
66
$156,803
46
$91,087
24
$42,875
6
$159,833
APPLICATIONS APPROVED, NOT ACCEPTED
0
$0
4
$135,750
17
$89,235
10
$34,900
0
$0
APPLICATIONS DENIED
0
$0
9
$203,222
31
$96,419
12
$55,250
2
$54,000
APPLICATIONS WITHDRAWN
0
$0
6
$157,333
27
$64,963
4
$33,250
0
$0
FILES CLOSED FOR INCOMPLETENESS
0
$0
1
$183,000
6
$115,167
2
$45,000
0
$0
Aggregated Statistics For Year 1999 (Based on 1 full tract)
A) FHA, FSA/RHS & VA Home Purchase Loans
B) Conventional Home Purchase Loans
C) Refinancings
D) Home Improvement Loans
F) Non-occupant Loans on < 5 Family Dwellings (A B C & D)
Detailed PMIC statistics for the following Tracts:1588.02
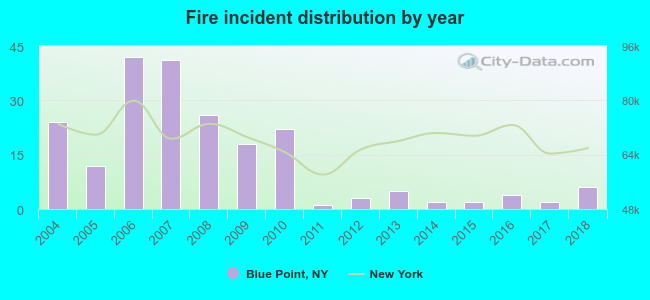
2004 - 2018 National Fire Incident Reporting System (NFIRS) incidents
According to the data from the years 2004 - 2018 the average number of fires per year is 14. The highest number of reported fires - 42 took place in 2006, and the least - 1 in 2011. The data has a declining trend.
When looking into fire subcategories, the most reports belonged to: Outside Fires (50.5%), and Structure Fires (36.2%).
Fire incident types reported to NFIRS in Blue Point, NY


 Recent articles from our blog. Our writers, many of them Ph.D. graduates or candidates, create easy-to-read articles on a wide variety of topics.

 (11.2 miles


 According to the data from the years 2004 - 2018 the average number of fires per year is 14. The highest number of reported fires - 42 took place in 2006, and the least - 1 in 2011. The data has a declining trend.
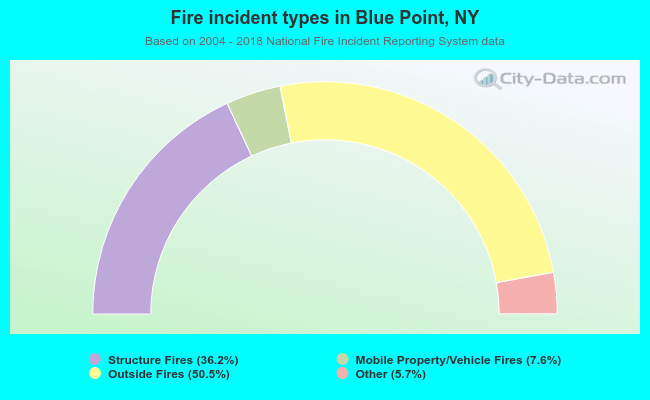 When looking into fire subcategories, the most reports belonged to: Outside Fires (50.5%), and Structure Fires (36.2%).