Watervliet, New York Submit your own pictures of this city and show them to the world
OSM Map
General Map
Google Map
MSN Map
OSM Map
General Map
Google Map
MSN Map
OSM Map
General Map
Google Map
MSN Map
OSM Map
General Map
Google Map
MSN Map
Please wait while loading the map...
Population in 2022: 10,219 (100% urban, 0% rural). Population change since 2000: +0.1%Males: 4,946 Females: 5,273
March 2022 cost of living index in Watervliet: 105.8 (more than average, U.S. average is 100) Percentage of residents living in poverty in 2022: 20.2%for White Non-Hispanic residents , 21.6% for Black residents , 16.5% for Hispanic or Latino residents , 42.2% for two or more races residents )
Profiles of local businesses
Business Search - 14 Million verified businesses
Data:
Median household income ($)
Median household income (% change since 2000)
Household income diversity
Ratio of average income to average house value (%)
Ratio of average income to average rent
Median household income ($) - White
Median household income ($) - Black or African American
Median household income ($) - Asian
Median household income ($) - Hispanic or Latino
Median household income ($) - American Indian and Alaska Native
Median household income ($) - Multirace
Median household income ($) - Other Race
Median household income for houses/condos with a mortgage ($)
Median household income for apartments without a mortgage ($)
Races - White alone (%)
Races - White alone (% change since 2000)
Races - Black alone (%)
Races - Black alone (% change since 2000)
Races - American Indian alone (%)
Races - American Indian alone (% change since 2000)
Races - Asian alone (%)
Races - Asian alone (% change since 2000)
Races - Hispanic (%)
Races - Hispanic (% change since 2000)
Races - Native Hawaiian and Other Pacific Islander alone (%)
Races - Native Hawaiian and Other Pacific Islander alone (% change since 2000)
Races - Two or more races (%)
Races - Two or more races (% change since 2000)
Races - Other race alone (%)
Races - Other race alone (% change since 2000)
Racial diversity
Unemployment (%)
Unemployment (% change since 2000)
Unemployment (%) - White
Unemployment (%) - Black or African American
Unemployment (%) - Asian
Unemployment (%) - Hispanic or Latino
Unemployment (%) - American Indian and Alaska Native
Unemployment (%) - Multirace
Unemployment (%) - Other Race
Population density (people per square mile)
Population - Males (%)
Population - Females (%)
Population - Males (%) - White
Population - Males (%) - Black or African American
Population - Males (%) - Asian
Population - Males (%) - Hispanic or Latino
Population - Males (%) - American Indian and Alaska Native
Population - Males (%) - Multirace
Population - Males (%) - Other Race
Population - Females (%) - White
Population - Females (%) - Black or African American
Population - Females (%) - Asian
Population - Females (%) - Hispanic or Latino
Population - Females (%) - American Indian and Alaska Native
Population - Females (%) - Multirace
Population - Females (%) - Other Race
Coronavirus confirmed cases (Jun 08, 2024)
Deaths caused by coronavirus (Jun 08, 2024)
Coronavirus confirmed cases (per 100k population) (Jun 08, 2024)
Deaths caused by coronavirus (per 100k population) (Jun 08, 2024)
Daily increase in number of cases (Jun 08, 2024)
Weekly increase in number of cases (Jun 08, 2024)
Cases doubled (in days) (Jun 08, 2024)
Hospitalized patients (Apr 18, 2022)
Negative test results (Apr 18, 2022)
Total test results (Apr 18, 2022)
COVID Vaccine doses distributed (per 100k population) (Sep 19, 2023)
COVID Vaccine doses administered (per 100k population) (Sep 19, 2023)
COVID Vaccine doses distributed (Sep 19, 2023)
COVID Vaccine doses administered (Sep 19, 2023)
Likely homosexual households (%)
Likely homosexual households (% change since 2000)
Likely homosexual households - Lesbian couples (%)
Likely homosexual households - Lesbian couples (% change since 2000)
Likely homosexual households - Gay men (%)
Likely homosexual households - Gay men (% change since 2000)
Cost of living index
Median gross rent ($)
Median contract rent ($)
Median monthly housing costs ($)
Median house or condo value ($)
Median house or condo value ($ change since 2000)
Mean house or condo value by units in structure - 1, detached ($)
Mean house or condo value by units in structure - 1, attached ($)
Mean house or condo value by units in structure - 2 ($)
Mean house or condo value by units in structure by units in structure - 3 or 4 ($)
Mean house or condo value by units in structure - 5 or more ($)
Mean house or condo value by units in structure - Boat, RV, van, etc. ($)
Mean house or condo value by units in structure - Mobile home ($)
Median house or condo value ($) - White
Median house or condo value ($) - Black or African American
Median house or condo value ($) - Asian
Median house or condo value ($) - Hispanic or Latino
Median house or condo value ($) - American Indian and Alaska Native
Median house or condo value ($) - Multirace
Median house or condo value ($) - Other Race
Median resident age
Resident age diversity
Median resident age - Males
Median resident age - Females
Median resident age - White
Median resident age - Black or African American
Median resident age - Asian
Median resident age - Hispanic or Latino
Median resident age - American Indian and Alaska Native
Median resident age - Multirace
Median resident age - Other Race
Median resident age - Males - White
Median resident age - Males - Black or African American
Median resident age - Males - Asian
Median resident age - Males - Hispanic or Latino
Median resident age - Males - American Indian and Alaska Native
Median resident age - Males - Multirace
Median resident age - Males - Other Race
Median resident age - Females - White
Median resident age - Females - Black or African American
Median resident age - Females - Asian
Median resident age - Females - Hispanic or Latino
Median resident age - Females - American Indian and Alaska Native
Median resident age - Females - Multirace
Median resident age - Females - Other Race
Commute - mean travel time to work (minutes)
Travel time to work - Less than 5 minutes (%)
Travel time to work - Less than 5 minutes (% change since 2000)
Travel time to work - 5 to 9 minutes (%)
Travel time to work - 5 to 9 minutes (% change since 2000)
Travel time to work - 10 to 19 minutes (%)
Travel time to work - 10 to 19 minutes (% change since 2000)
Travel time to work - 20 to 29 minutes (%)
Travel time to work - 20 to 29 minutes (% change since 2000)
Travel time to work - 30 to 39 minutes (%)
Travel time to work - 30 to 39 minutes (% change since 2000)
Travel time to work - 40 to 59 minutes (%)
Travel time to work - 40 to 59 minutes (% change since 2000)
Travel time to work - 60 to 89 minutes (%)
Travel time to work - 60 to 89 minutes (% change since 2000)
Travel time to work - 90 or more minutes (%)
Travel time to work - 90 or more minutes (% change since 2000)
Marital status - Never married (%)
Marital status - Now married (%)
Marital status - Separated (%)
Marital status - Widowed (%)
Marital status - Divorced (%)
Median family income ($)
Median family income (% change since 2000)
Median non-family income ($)
Median non-family income (% change since 2000)
Median per capita income ($)
Median per capita income (% change since 2000)
Median family income ($) - White
Median family income ($) - Black or African American
Median family income ($) - Asian
Median family income ($) - Hispanic or Latino
Median family income ($) - American Indian and Alaska Native
Median family income ($) - Multirace
Median family income ($) - Other Race
Median year house/condo built
Median year apartment built
Year house built - Built 2005 or later (%)
Year house built - Built 2000 to 2004 (%)
Year house built - Built 1990 to 1999 (%)
Year house built - Built 1980 to 1989 (%)
Year house built - Built 1970 to 1979 (%)
Year house built - Built 1960 to 1969 (%)
Year house built - Built 1950 to 1959 (%)
Year house built - Built 1940 to 1949 (%)
Year house built - Built 1939 or earlier (%)
Average household size
Household density (households per square mile)
Average household size - White
Average household size - Black or African American
Average household size - Asian
Average household size - Hispanic or Latino
Average household size - American Indian and Alaska Native
Average household size - Multirace
Average household size - Other Race
Occupied housing units (%)
Vacant housing units (%)
Owner occupied housing units (%)
Renter occupied housing units (%)
Vacancy status - For rent (%)
Vacancy status - For sale only (%)
Vacancy status - Rented or sold, not occupied (%)
Vacancy status - For seasonal, recreational, or occasional use (%)
Vacancy status - For migrant workers (%)
Vacancy status - Other vacant (%)
Residents with income below the poverty level (%)
Residents with income below 50% of the poverty level (%)
Children below poverty level (%)
Poor families by family type - Married-couple family (%)
Poor families by family type - Male, no wife present (%)
Poor families by family type - Female, no husband present (%)
Poverty status for native-born residents (%)
Poverty status for foreign-born residents (%)
Poverty among high school graduates not in families (%)
Poverty among people who did not graduate high school not in families (%)
Residents with income below the poverty level (%) - White
Residents with income below the poverty level (%) - Black or African American
Residents with income below the poverty level (%) - Asian
Residents with income below the poverty level (%) - Hispanic or Latino
Residents with income below the poverty level (%) - American Indian and Alaska Native
Residents with income below the poverty level (%) - Multirace
Residents with income below the poverty level (%) - Other Race
Air pollution - Air Quality Index (AQI)
Air pollution - CO
Air pollution - NO2
Air pollution - SO2
Air pollution - Ozone
Air pollution - PM10
Air pollution - PM25
Air pollution - Pb
Crime - Murders per 100,000 population
Crime - Rapes per 100,000 population
Crime - Robberies per 100,000 population
Crime - Assaults per 100,000 population
Crime - Burglaries per 100,000 population
Crime - Thefts per 100,000 population
Crime - Auto thefts per 100,000 population
Crime - Arson per 100,000 population
Crime - City-data.com crime index
Crime - Violent crime index
Crime - Property crime index
Crime - Murders per 100,000 population (5 year average)
Crime - Rapes per 100,000 population (5 year average)
Crime - Robberies per 100,000 population (5 year average)
Crime - Assaults per 100,000 population (5 year average)
Crime - Burglaries per 100,000 population (5 year average)
Crime - Thefts per 100,000 population (5 year average)
Crime - Auto thefts per 100,000 population (5 year average)
Crime - Arson per 100,000 population (5 year average)
Crime - City-data.com crime index (5 year average)
Crime - Violent crime index (5 year average)
Crime - Property crime index (5 year average)
1996 Presidential Elections Results (%) - Democratic Party (Clinton)
1996 Presidential Elections Results (%) - Republican Party (Dole)
1996 Presidential Elections Results (%) - Other
2000 Presidential Elections Results (%) - Democratic Party (Gore)
2000 Presidential Elections Results (%) - Republican Party (Bush)
2000 Presidential Elections Results (%) - Other
2004 Presidential Elections Results (%) - Democratic Party (Kerry)
2004 Presidential Elections Results (%) - Republican Party (Bush)
2004 Presidential Elections Results (%) - Other
2008 Presidential Elections Results (%) - Democratic Party (Obama)
2008 Presidential Elections Results (%) - Republican Party (McCain)
2008 Presidential Elections Results (%) - Other
2012 Presidential Elections Results (%) - Democratic Party (Obama)
2012 Presidential Elections Results (%) - Republican Party (Romney)
2012 Presidential Elections Results (%) - Other
2016 Presidential Elections Results (%) - Democratic Party (Clinton)
2016 Presidential Elections Results (%) - Republican Party (Trump)
2016 Presidential Elections Results (%) - Other
2020 Presidential Elections Results (%) - Democratic Party (Biden)
2020 Presidential Elections Results (%) - Republican Party (Trump)
2020 Presidential Elections Results (%) - Other
Ancestries Reported - Arab (%)
Ancestries Reported - Czech (%)
Ancestries Reported - Danish (%)
Ancestries Reported - Dutch (%)
Ancestries Reported - English (%)
Ancestries Reported - French (%)
Ancestries Reported - French Canadian (%)
Ancestries Reported - German (%)
Ancestries Reported - Greek (%)
Ancestries Reported - Hungarian (%)
Ancestries Reported - Irish (%)
Ancestries Reported - Italian (%)
Ancestries Reported - Lithuanian (%)
Ancestries Reported - Norwegian (%)
Ancestries Reported - Polish (%)
Ancestries Reported - Portuguese (%)
Ancestries Reported - Russian (%)
Ancestries Reported - Scotch-Irish (%)
Ancestries Reported - Scottish (%)
Ancestries Reported - Slovak (%)
Ancestries Reported - Subsaharan African (%)
Ancestries Reported - Swedish (%)
Ancestries Reported - Swiss (%)
Ancestries Reported - Ukrainian (%)
Ancestries Reported - United States (%)
Ancestries Reported - Welsh (%)
Ancestries Reported - West Indian (%)
Ancestries Reported - Other (%)
Educational Attainment - No schooling completed (%)
Educational Attainment - Less than high school (%)
Educational Attainment - High school or equivalent (%)
Educational Attainment - Less than 1 year of college (%)
Educational Attainment - 1 or more years of college (%)
Educational Attainment - Associate degree (%)
Educational Attainment - Bachelor's degree (%)
Educational Attainment - Master's degree (%)
Educational Attainment - Professional school degree (%)
Educational Attainment - Doctorate degree (%)
School Enrollment - Nursery, preschool (%)
School Enrollment - Kindergarten (%)
School Enrollment - Grade 1 to 4 (%)
School Enrollment - Grade 5 to 8 (%)
School Enrollment - Grade 9 to 12 (%)
School Enrollment - College undergrad (%)
School Enrollment - Graduate or professional (%)
School Enrollment - Not enrolled in school (%)
School enrollment - Public schools (%)
School enrollment - Private schools (%)
School enrollment - Not enrolled (%)
Median number of rooms in houses and condos
Median number of rooms in apartments
Housing units lacking complete plumbing facilities (%)
Housing units lacking complete kitchen facilities (%)
Density of houses
Urban houses (%)
Rural houses (%)
Households with people 60 years and over (%)
Households with people 65 years and over (%)
Households with people 75 years and over (%)
Households with one or more nonrelatives (%)
Households with no nonrelatives (%)
Population in households (%)
Family households (%)
Nonfamily households (%)
Population in families (%)
Family households with own children (%)
Median number of bedrooms in owner occupied houses
Mean number of bedrooms in owner occupied houses
Median number of bedrooms in renter occupied houses
Mean number of bedrooms in renter occupied houses
Median number of vehichles in owner occupied houses
Mean number of vehichles in owner occupied houses
Median number of vehichles in renter occupied houses
Mean number of vehichles in renter occupied houses
Mortgage status - with mortgage (%)
Mortgage status - with second mortgage (%)
Mortgage status - with home equity loan (%)
Mortgage status - with both second mortgage and home equity loan (%)
Mortgage status - without a mortgage (%)
Average family size
Average family size - White
Average family size - Black or African American
Average family size - Asian
Average family size - Hispanic or Latino
Average family size - American Indian and Alaska Native
Average family size - Multirace
Average family size - Other Race
Geographical mobility - Same house 1 year ago (%)
Geographical mobility - Moved within same county (%)
Geographical mobility - Moved from different county within same state (%)
Geographical mobility - Moved from different state (%)
Geographical mobility - Moved from abroad (%)
Place of birth - Born in state of residence (%)
Place of birth - Born in other state (%)
Place of birth - Native, outside of US (%)
Place of birth - Foreign born (%)
Housing units in structures - 1, detached (%)
Housing units in structures - 1, attached (%)
Housing units in structures - 2 (%)
Housing units in structures - 3 or 4 (%)
Housing units in structures - 5 to 9 (%)
Housing units in structures - 10 to 19 (%)
Housing units in structures - 20 to 49 (%)
Housing units in structures - 50 or more (%)
Housing units in structures - Mobile home (%)
Housing units in structures - Boat, RV, van, etc. (%)
House/condo owner moved in on average (years ago)
Renter moved in on average (years ago)
Year householder moved into unit - Moved in 1999 to March 2000 (%)
Year householder moved into unit - Moved in 1995 to 1998 (%)
Year householder moved into unit - Moved in 1990 to 1994 (%)
Year householder moved into unit - Moved in 1980 to 1989 (%)
Year householder moved into unit - Moved in 1970 to 1979 (%)
Year householder moved into unit - Moved in 1969 or earlier (%)
Means of transportation to work - Drove car alone (%)
Means of transportation to work - Carpooled (%)
Means of transportation to work - Public transportation (%)
Means of transportation to work - Bus or trolley bus (%)
Means of transportation to work - Streetcar or trolley car (%)
Means of transportation to work - Subway or elevated (%)
Means of transportation to work - Railroad (%)
Means of transportation to work - Ferryboat (%)
Means of transportation to work - Taxicab (%)
Means of transportation to work - Motorcycle (%)
Means of transportation to work - Bicycle (%)
Means of transportation to work - Walked (%)
Means of transportation to work - Other means (%)
Working at home (%)
Industry diversity
Most Common Industries - Agriculture, forestry, fishing and hunting, and mining (%)
Most Common Industries - Agriculture, forestry, fishing and hunting (%)
Most Common Industries - Mining, quarrying, and oil and gas extraction (%)
Most Common Industries - Construction (%)
Most Common Industries - Manufacturing (%)
Most Common Industries - Wholesale trade (%)
Most Common Industries - Retail trade (%)
Most Common Industries - Transportation and warehousing, and utilities (%)
Most Common Industries - Transportation and warehousing (%)
Most Common Industries - Utilities (%)
Most Common Industries - Information (%)
Most Common Industries - Finance and insurance, and real estate and rental and leasing (%)
Most Common Industries - Finance and insurance (%)
Most Common Industries - Real estate and rental and leasing (%)
Most Common Industries - Professional, scientific, and management, and administrative and waste management services (%)
Most Common Industries - Professional, scientific, and technical services (%)
Most Common Industries - Management of companies and enterprises (%)
Most Common Industries - Administrative and support and waste management services (%)
Most Common Industries - Educational services, and health care and social assistance (%)
Most Common Industries - Educational services (%)
Most Common Industries - Health care and social assistance (%)
Most Common Industries - Arts, entertainment, and recreation, and accommodation and food services (%)
Most Common Industries - Arts, entertainment, and recreation (%)
Most Common Industries - Accommodation and food services (%)
Most Common Industries - Other services, except public administration (%)
Most Common Industries - Public administration (%)
Occupation diversity
Most Common Occupations - Management, business, science, and arts occupations (%)
Most Common Occupations - Management, business, and financial occupations (%)
Most Common Occupations - Management occupations (%)
Most Common Occupations - Business and financial operations occupations (%)
Most Common Occupations - Computer, engineering, and science occupations (%)
Most Common Occupations - Computer and mathematical occupations (%)
Most Common Occupations - Architecture and engineering occupations (%)
Most Common Occupations - Life, physical, and social science occupations (%)
Most Common Occupations - Education, legal, community service, arts, and media occupations (%)
Most Common Occupations - Community and social service occupations (%)
Most Common Occupations - Legal occupations (%)
Most Common Occupations - Education, training, and library occupations (%)
Most Common Occupations - Arts, design, entertainment, sports, and media occupations (%)
Most Common Occupations - Healthcare practitioners and technical occupations (%)
Most Common Occupations - Health diagnosing and treating practitioners and other technical occupations (%)
Most Common Occupations - Health technologists and technicians (%)
Most Common Occupations - Service occupations (%)
Most Common Occupations - Healthcare support occupations (%)
Most Common Occupations - Protective service occupations (%)
Most Common Occupations - Fire fighting and prevention, and other protective service workers including supervisors (%)
Most Common Occupations - Law enforcement workers including supervisors (%)
Most Common Occupations - Food preparation and serving related occupations (%)
Most Common Occupations - Building and grounds cleaning and maintenance occupations (%)
Most Common Occupations - Personal care and service occupations (%)
Most Common Occupations - Sales and office occupations (%)
Most Common Occupations - Sales and related occupations (%)
Most Common Occupations - Office and administrative support occupations (%)
Most Common Occupations - Natural resources, construction, and maintenance occupations (%)
Most Common Occupations - Farming, fishing, and forestry occupations (%)
Most Common Occupations - Construction and extraction occupations (%)
Most Common Occupations - Installation, maintenance, and repair occupations (%)
Most Common Occupations - Production, transportation, and material moving occupations (%)
Most Common Occupations - Production occupations (%)
Most Common Occupations - Transportation occupations (%)
Most Common Occupations - Material moving occupations (%)
People in Group quarters - Institutionalized population (%)
People in Group quarters - Correctional institutions (%)
People in Group quarters - Federal prisons and detention centers (%)
People in Group quarters - Halfway houses (%)
People in Group quarters - Local jails and other confinement facilities (including police lockups) (%)
People in Group quarters - Military disciplinary barracks (%)
People in Group quarters - State prisons (%)
People in Group quarters - Other types of correctional institutions (%)
People in Group quarters - Nursing homes (%)
People in Group quarters - Hospitals/wards, hospices, and schools for the handicapped (%)
People in Group quarters - Hospitals/wards and hospices for chronically ill (%)
People in Group quarters - Hospices or homes for chronically ill (%)
People in Group quarters - Military hospitals or wards for chronically ill (%)
People in Group quarters - Other hospitals or wards for chronically ill (%)
People in Group quarters - Hospitals or wards for drug/alcohol abuse (%)
People in Group quarters - Mental (Psychiatric) hospitals or wards (%)
People in Group quarters - Schools, hospitals, or wards for the mentally retarded (%)
People in Group quarters - Schools, hospitals, or wards for the physically handicapped (%)
People in Group quarters - Institutions for the deaf (%)
People in Group quarters - Institutions for the blind (%)
People in Group quarters - Orthopedic wards and institutions for the physically handicapped (%)
People in Group quarters - Wards in general hospitals for patients who have no usual home elsewhere (%)
People in Group quarters - Wards in military hospitals for patients who have no usual home elsewhere (%)
People in Group quarters - Juvenile institutions (%)
People in Group quarters - Long-term care (%)
People in Group quarters - Homes for abused, dependent, and neglected children (%)
People in Group quarters - Residential treatment centers for emotionally disturbed children (%)
People in Group quarters - Training schools for juvenile delinquents (%)
People in Group quarters - Short-term care, detention or diagnostic centers for delinquent children (%)
People in Group quarters - Type of juvenile institution unknown (%)
People in Group quarters - Noninstitutionalized population (%)
People in Group quarters - College dormitories (includes college quarters off campus) (%)
People in Group quarters - Military quarters (%)
People in Group quarters - On base (%)
People in Group quarters - Barracks, unaccompanied personnel housing (UPH), (Enlisted/Officer), ;and similar group living quarters for military personnel (%)
People in Group quarters - Transient quarters for temporary residents (%)
People in Group quarters - Military ships (%)
People in Group quarters - Group homes (%)
People in Group quarters - Homes or halfway houses for drug/alcohol abuse (%)
People in Group quarters - Homes for the mentally ill (%)
People in Group quarters - Homes for the mentally retarded (%)
People in Group quarters - Homes for the physically handicapped (%)
People in Group quarters - Other group homes (%)
People in Group quarters - Religious group quarters (%)
People in Group quarters - Dormitories (%)
People in Group quarters - Agriculture workers' dormitories on farms (%)
People in Group quarters - Job Corps and vocational training facilities (%)
People in Group quarters - Other workers' dormitories (%)
People in Group quarters - Crews of maritime vessels (%)
People in Group quarters - Other nonhousehold living situations (%)
People in Group quarters - Other noninstitutional group quarters (%)
Residents speaking English at home (%)
Residents speaking English at home - Born in the United States (%)
Residents speaking English at home - Native, born elsewhere (%)
Residents speaking English at home - Foreign born (%)
Residents speaking Spanish at home (%)
Residents speaking Spanish at home - Born in the United States (%)
Residents speaking Spanish at home - Native, born elsewhere (%)
Residents speaking Spanish at home - Foreign born (%)
Residents speaking other language at home (%)
Residents speaking other language at home - Born in the United States (%)
Residents speaking other language at home - Native, born elsewhere (%)
Residents speaking other language at home - Foreign born (%)
Class of Workers - Employee of private company (%)
Class of Workers - Self-employed in own incorporated business (%)
Class of Workers - Private not-for-profit wage and salary workers (%)
Class of Workers - Local government workers (%)
Class of Workers - State government workers (%)
Class of Workers - Federal government workers (%)
Class of Workers - Self-employed workers in own not incorporated business and Unpaid family workers (%)
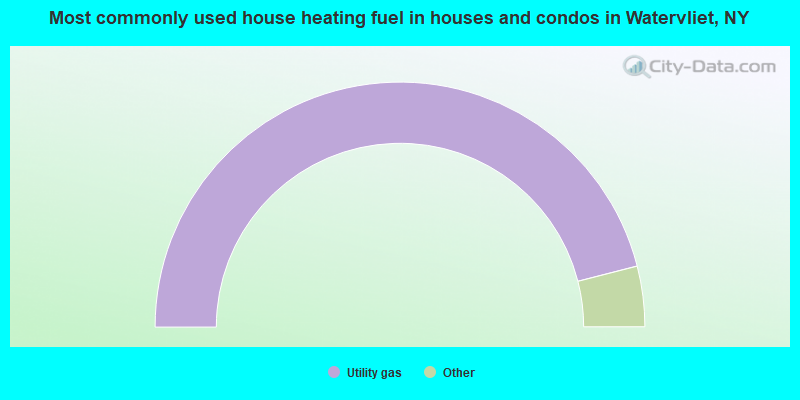
House heating fuel used in houses and condos - Utility gas (%)
House heating fuel used in houses and condos - Bottled, tank, or LP gas (%)
House heating fuel used in houses and condos - Electricity (%)
House heating fuel used in houses and condos - Fuel oil, kerosene, etc. (%)
House heating fuel used in houses and condos - Coal or coke (%)
House heating fuel used in houses and condos - Wood (%)
House heating fuel used in houses and condos - Solar energy (%)
House heating fuel used in houses and condos - Other fuel (%)
House heating fuel used in houses and condos - No fuel used (%)
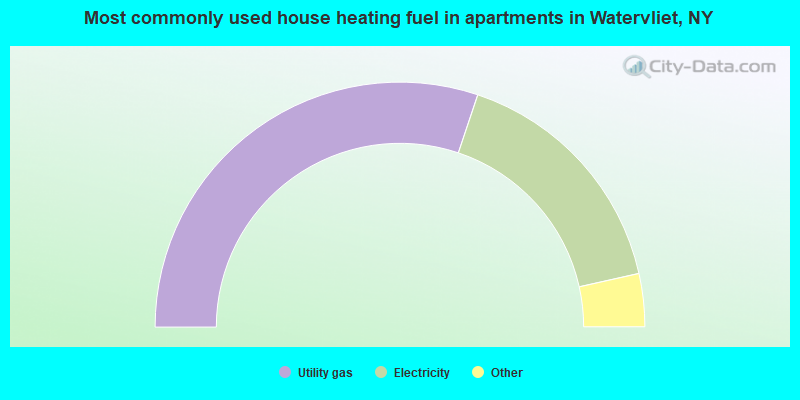
House heating fuel used in apartments - Utility gas (%)
House heating fuel used in apartments - Bottled, tank, or LP gas (%)
House heating fuel used in apartments - Electricity (%)
House heating fuel used in apartments - Fuel oil, kerosene, etc. (%)
House heating fuel used in apartments - Coal or coke (%)
House heating fuel used in apartments - Wood (%)
House heating fuel used in apartments - Solar energy (%)
House heating fuel used in apartments - Other fuel (%)
House heating fuel used in apartments - No fuel used (%)
Armed forces status - In Armed Forces (%)
Armed forces status - Civilian (%)
Armed forces status - Civilian - Veteran (%)
Armed forces status - Civilian - Nonveteran (%)
Fatal accidents locations in years 2005-2021
Fatal accidents locations in 2005
Fatal accidents locations in 2006
Fatal accidents locations in 2007
Fatal accidents locations in 2008
Fatal accidents locations in 2009
Fatal accidents locations in 2010
Fatal accidents locations in 2011
Fatal accidents locations in 2012
Fatal accidents locations in 2013
Fatal accidents locations in 2014
Fatal accidents locations in 2015
Fatal accidents locations in 2016
Fatal accidents locations in 2017
Fatal accidents locations in 2018
Fatal accidents locations in 2019
Fatal accidents locations in 2020
Fatal accidents locations in 2021
Alcohol use - People drinking some alcohol every month (%)
Alcohol use - People not drinking at all (%)
Alcohol use - Average days/month drinking alcohol
Alcohol use - Average drinks/week
Alcohol use - Average days/year people drink much
Audiometry - Average condition of hearing (%)
Audiometry - People that can hear a whisper from across a quiet room (%)
Audiometry - People that can hear normal voice from across a quiet room (%)
Audiometry - Ears ringing, roaring, buzzing (%)
Audiometry - Had a job exposure to loud noise (%)
Audiometry - Had off-work exposure to loud noise (%)
Blood Pressure & Cholesterol - Has high blood pressure (%)
Blood Pressure & Cholesterol - Checking blood pressure at home (%)
Blood Pressure & Cholesterol - Frequently checking blood cholesterol (%)
Blood Pressure & Cholesterol - Has high cholesterol level (%)
Consumer Behavior - Money monthly spent on food at supermarket/grocery store
Consumer Behavior - Money monthly spent on food at other stores
Consumer Behavior - Money monthly spent on eating out
Consumer Behavior - Money monthly spent on carryout/delivered foods
Consumer Behavior - Income spent on food at supermarket/grocery store (%)
Consumer Behavior - Income spent on food at other stores (%)
Consumer Behavior - Income spent on eating out (%)
Consumer Behavior - Income spent on carryout/delivered foods (%)
Current Health Status - General health condition (%)
Current Health Status - Blood donors (%)
Current Health Status - Has blood ever tested for HIV virus (%)
Current Health Status - Left-handed people (%)
Dermatology - People using sunscreen (%)
Diabetes - Diabetics (%)
Diabetes - Had a blood test for high blood sugar (%)
Diabetes - People taking insulin (%)
Diet Behavior & Nutrition - Diet health (%)
Diet Behavior & Nutrition - Milk product consumption (# of products/month)
Diet Behavior & Nutrition - Meals not home prepared (#/week)
Diet Behavior & Nutrition - Meals from fast food or pizza place (#/week)
Diet Behavior & Nutrition - Ready-to-eat foods (#/month)
Diet Behavior & Nutrition - Frozen meals/pizza (#/month)
Drug Use - People that ever used marijuana or hashish (%)
Drug Use - Ever used hard drugs (%)
Drug Use - Ever used any form of cocaine (%)
Drug Use - Ever used heroin (%)
Drug Use - Ever used methamphetamine (%)
Health Insurance - People covered by health insurance (%)
Kidney Conditions-Urology - Avg. # of times urinating at night
Medical Conditions - People with asthma (%)
Medical Conditions - People with anemia (%)
Medical Conditions - People with psoriasis (%)
Medical Conditions - People with overweight (%)
Medical Conditions - Elderly people having difficulties in thinking or remembering (%)
Medical Conditions - People who ever received blood transfusion (%)
Medical Conditions - People having trouble seeing even with glass/contacts (%)
Medical Conditions - People with arthritis (%)
Medical Conditions - People with gout (%)
Medical Conditions - People with congestive heart failure (%)
Medical Conditions - People with coronary heart disease (%)
Medical Conditions - People with angina pectoris (%)
Medical Conditions - People who ever had heart attack (%)
Medical Conditions - People who ever had stroke (%)
Medical Conditions - People with emphysema (%)
Medical Conditions - People with thyroid problem (%)
Medical Conditions - People with chronic bronchitis (%)
Medical Conditions - People with any liver condition (%)
Medical Conditions - People who ever had cancer or malignancy (%)
Mental Health - People who have little interest in doing things (%)
Mental Health - People feeling down, depressed, or hopeless (%)
Mental Health - People who have trouble sleeping or sleeping too much (%)
Mental Health - People feeling tired or having little energy (%)
Mental Health - People with poor appetite or overeating (%)
Mental Health - People feeling bad about themself (%)
Mental Health - People who have trouble concentrating on things (%)
Mental Health - People moving or speaking slowly or too fast (%)
Mental Health - People having thoughts they would be better off dead (%)
Oral Health - Average years since last visit a dentist
Oral Health - People embarrassed because of mouth (%)
Oral Health - People with gum disease (%)
Oral Health - General health of teeth and gums (%)
Oral Health - Average days a week using dental floss/device
Oral Health - Average days a week using mouthwash for dental problem
Oral Health - Average number of teeth
Pesticide Use - Households using pesticides to control insects (%)
Pesticide Use - Households using pesticides to kill weeds (%)
Physical Activity - People doing vigorous-intensity work activities (%)
Physical Activity - People doing moderate-intensity work activities (%)
Physical Activity - People walking or bicycling (%)
Physical Activity - People doing vigorous-intensity recreational activities (%)
Physical Activity - People doing moderate-intensity recreational activities (%)
Physical Activity - Average hours a day doing sedentary activities
Physical Activity - Average hours a day watching TV or videos
Physical Activity - Average hours a day using computer
Physical Functioning - People having limitations keeping them from working (%)
Physical Functioning - People limited in amount of work they can do (%)
Physical Functioning - People that need special equipment to walk (%)
Physical Functioning - People experiencing confusion/memory problems (%)
Physical Functioning - People requiring special healthcare equipment (%)
Prescription Medications - Average number of prescription medicines taking
Preventive Aspirin Use - Adults 40+ taking low-dose aspirin (%)
Reproductive Health - Vaginal deliveries (%)
Reproductive Health - Cesarean deliveries (%)
Reproductive Health - Deliveries resulted in a live birth (%)
Reproductive Health - Pregnancies resulted in a delivery (%)
Reproductive Health - Women breastfeeding newborns (%)
Reproductive Health - Women that had a hysterectomy (%)
Reproductive Health - Women that had both ovaries removed (%)
Reproductive Health - Women that have ever taken birth control pills (%)
Reproductive Health - Women taking birth control pills (%)
Reproductive Health - Women that have ever used Depo-Provera or injectables (%)
Reproductive Health - Women that have ever used female hormones (%)
Sexual Behavior - People 18+ that ever had sex (vaginal, anal, or oral) (%)
Sexual Behavior - Males 18+ that ever had vaginal sex with a woman (%)
Sexual Behavior - Males 18+ that ever performed oral sex on a woman (%)
Sexual Behavior - Males 18+ that ever had anal sex with a woman (%)
Sexual Behavior - Males 18+ that ever had any sex with a man (%)
Sexual Behavior - Females 18+ that ever had vaginal sex with a man (%)
Sexual Behavior - Females 18+ that ever performed oral sex on a man (%)
Sexual Behavior - Females 18+ that ever had anal sex with a man (%)
Sexual Behavior - Females 18+ that ever had any kind of sex with a woman (%)
Sexual Behavior - Average age people first had sex
Sexual Behavior - Average number of female sex partners in lifetime (males 18+)
Sexual Behavior - Average number of female vaginal sex partners in lifetime (males 18+)
Sexual Behavior - Average age people first performed oral sex on a woman (18+)
Sexual Behavior - Average number of woman performed oral sex on in lifetime (18+)
Sexual Behavior - Average number of male sex partners in lifetime (males 18+)
Sexual Behavior - Average number of male anal sex partners in lifetime (males 18+)
Sexual Behavior - Average age people first performed oral sex on a man (18+)
Sexual Behavior - Average number of male oral sex partners in lifetime (18+)
Sexual Behavior - People using protection when performing oral sex (%)
Sexual Behavior - Average number of times people have vaginal or anal sex a year
Sexual Behavior - People having sex without condom (%)
Sexual Behavior - Average number of male sex partners in lifetime (females 18+)
Sexual Behavior - Average number of male vaginal sex partners in lifetime (females 18+)
Sexual Behavior - Average number of female sex partners in lifetime (females 18+)
Sexual Behavior - Circumcised males 18+ (%)
Sleep Disorders - Average hours sleeping at night
Sleep Disorders - People that has trouble sleeping (%)
Smoking-Cigarette Use - People smoking cigarettes (%)
Taste & Smell - People 40+ having problems with smell (%)
Taste & Smell - People 40+ having problems with taste (%)
Taste & Smell - People 40+ that ever had wisdom teeth removed (%)
Taste & Smell - People 40+ that ever had tonsils teeth removed (%)
Taste & Smell - People 40+ that ever had a loss of consciousness because of a head injury (%)
Taste & Smell - People 40+ that ever had a broken nose or other serious injury to face or skull (%)
Taste & Smell - People 40+ that ever had two or more sinus infections (%)
Weight - Average height (inches)
Weight - Average weight (pounds)
Weight - Average BMI
Weight - People that are obese (%)
Weight - People that ever were obese (%)
Weight - People trying to lose weight (%)
Officers per 1,000 residents here:
2.56New York average:
3.28
Latest news from Watervliet, NY collected exclusively by city-data.com from local newspapers, TV, and radio stations
Ancestries: American (17.4%), Irish (13.5%), Italian (10.4%), Afghan (3.4%), German (2.7%), English (2.4%).
Current Local Time:
Land area: 1.34 square miles.
Population density: 7,617 people per square mile (high).
860 residents are foreign born (4.3% Asia , 2.2% Latin America , 1.3% Africa ).
This city:
8.3%New York:
22.6%
Median real estate property taxes paid for housing units with mortgages in 2022: $3,749 (2.1%)Median real estate property taxes paid for housing units with no mortgage in 2022: $3,036 (1.8%)
Nearest city with pop. 50,000+: Albany, NY
Nearest city with pop. 200,000+: Bronx, NY
Nearest cities:
Latitude: 42.72 N, Longitude: 73.71 W
Daytime population change due to commuting: -2,362 (-22.8%)Workers who live and work in this city: 771 (15.5%)
Area code commonly used in this area: 518
Single-family new house construction building permits:
2022: 1 building , cost: $100,0002021: 2 buildings , average cost: $195,9002014: 1 building , cost: $110,0002013: 1 building , cost: $110,0002012: 1 building , cost: $110,0002011: 1 building , cost: $110,0002010: 2 buildings , average cost: $110,0002009: 2 buildings , average cost: $110,0002008: 2 buildings , average cost: $110,0002007: 3 buildings , average cost: $110,0002006: 4 buildings , average cost: $110,0002005: 4 buildings , average cost: $110,0002004: 4 buildings , average cost: $110,0001999: 2 buildings , average cost: $44,0001998: 1 building , cost: $85,0001997: 1 building , cost: $85,000Unemployment in December 2023:
Most common occupations in Watervliet, NY (%)
Both Males Females
Other office and administrative support workers, including supervisors (10.3%)
Secretaries and administrative assistants (4.8%)
Other management occupations, except farmers and farm managers (4.0%)
Building and grounds cleaning and maintenance occupations (3.4%)
Driver/sales workers and truck drivers (3.3%)
Material recording, scheduling, dispatching, and distributing workers (3.3%)
Other sales and related occupations, including supervisors (3.2%)
Other office and administrative support workers, including supervisors (6.4%)
Driver/sales workers and truck drivers (5.8%)
Building and grounds cleaning and maintenance occupations (5.6%)
Electrical equipment mechanics and other installation, maintenance, and repair workers, including supervisors (4.9%)
Laborers and material movers, hand (4.1%)
Computer specialists (3.8%)
Material recording, scheduling, dispatching, and distributing workers (3.5%)
Other office and administrative support workers, including supervisors (14.2%)
Secretaries and administrative assistants (9.3%)
Other management occupations, except farmers and farm managers (4.6%)
Information and record clerks, except customer service representatives (4.1%)
Other sales and related occupations, including supervisors (3.4%)
Nursing, psychiatric, and home health aides (3.3%)
Material recording, scheduling, dispatching, and distributing workers (3.1%)
Tornado activity:
Watervliet-area historical tornado activity is above New York state average. It is 43% smaller than the overall U.S. average.
On 8/28/1973, a category F4 (max. wind speeds 207-260 mph) tornado 25.6 miles away from the Watervliet city center killed 4 people and injured 36 people and caused between $5,000,000 and $50,000,000 in damages.
On 7/10/1989, a category F4 tornado 29.0 miles away from the city center injured 20 people and caused between $5,000,000 and $50,000,000 in damages.
Earthquake activity:
Watervliet-area historical earthquake activity is significantly above New York state average. It is 68% smaller than the overall U.S. average. On 10/7/1983 at 10:18:46, a magnitude 5.3 (5.1 MB, 5.3 LG, 5.1 ML, Class: Moderate, Intensity: VI - VII) earthquake occurred 90.8 miles away from the city center On 4/20/2002 at 10:50:47, a magnitude 5.3 (5.3 ML, Depth: 3.0 mi) earthquake occurred 123.7 miles away from the city center On 4/20/2002 at 10:50:47, a magnitude 5.2 (5.2 MB, 4.2 MS, 5.2 MW, 5.0 MW) earthquake occurred 121.9 miles away from the city center On 1/19/1982 at 00:14:42, a magnitude 4.7 (4.5 MB, 4.7 MD, 4.5 LG, Class: Light, Intensity: IV - V) earthquake occurred 119.1 miles away from the city center On 10/16/2012 at 23:12:25, a magnitude 4.7 (4.7 ML, Depth: 10.0 mi) earthquake occurred 165.3 miles away from the city center On 6/17/1991 at 08:53:16, a magnitude 4.1 (4.0 MB, 4.0 LG, Depth: 3.1 mi) earthquake occurred 49.8 miles away from Watervliet center Magnitude types: regional Lg-wave magnitude (LG), body-wave magnitude (MB), duration magnitude (MD), local magnitude (ML), surface-wave magnitude (MS), moment magnitude (MW) Natural disasters: The number of natural disasters in Albany County (20) is greater than the US average (15).Major Disasters (Presidential) Declared: 10Emergencies Declared: 9Hurricanes: 4, Storms: 4, Winter Storms: 4, Floods: 3, Snowstorms: 3, Blizzards: 2, Power Outage: 1, Tropical Storm: 1, Other: 2 (Note: some incidents may be assigned to more than one category). Hospitals and medical centers near Watervliet: EDDY VISITING NURSE ASSOCIATION CHHA (Home Health Center, about 2 miles away; TROY, NY)
WESLEY VNA/EDDY VNA OF CAP REGION (Home Health Center, about 2 miles away; TROY, NY)
H AND L RUBIN DIALYSIS CENTER (Dialysis Facility, about 2 miles away; TROY, NY)
SAMARITAN HOSPITAL (about 2 miles away; TROY, NY)
JAMES A EDDY MEMORIAL GERIATRIC CENTER (Nursing Home, about 2 miles away; TROY, NY)
THE SPRINGS NURSING AND REHABILITATION CENTRE (Nursing Home, about 2 miles away; TROY, NY)
ST MARY'S HOSPITAL ( TROY ) (about 2 miles away; TROY, NY)
Amtrak stations near Watervliet: 7 miles: ALBANY-RENSSELAER (RENSSELAER, 555 EAST ST.) Services: ticket office, partially wheelchair accessible, enclosed waiting area, public restrooms, public payphones, snack bar, ATM, free short-term parking, free long-term parking, call for car rental service, taxi stand, public transit connection.
14 miles: SCHENECTADY (332 ERIE BLVD.) Services: ticket office, fully wheelchair accessible, enclosed waiting area, public restrooms, public payphones, vending machines, ATM, free short-term parking, free long-term parking, call for car rental service, taxi stand, public transit connection.
Colleges/universities with over 2000 students nearest to Watervliet:
The Sage Colleges (about 1 miles; Troy, NY ; Full-time enrollment: 2,499)
Rensselaer Polytechnic Institute (about 2 miles; Troy, NY ; FT enrollment: 6,940)
Hudson Valley Community College (about 3 miles; Troy, NY ; FT enrollment: 9,346)
Siena College (about 3 miles; Loudonville, NY ; FT enrollment: 3,153)
The College of Saint Rose (about 6 miles; Albany, NY ; FT enrollment: 4,085)
SUNY at Albany (about 7 miles; Albany, NY ; FT enrollment: 15,490)
Excelsior College (about 9 miles; Albany, NY ; FT enrollment: 4,723)
Public high school in Watervliet:
Public elementary/middle school in Watervliet:
See full list of schools located in Watervliet Library in Watervliet: WATERVLIET PUBLIC LIBRARY Operating income: $130,024; Location: 1501 BROADWAY; 14,601 books ; 377 audio materials ; 1,464 video materials ; 22 state licensed databases ; 8 other licensed databases ; 17 print serial subscriptions )
Notable locations in Watervliet: (A) , Boston Square (B) , Watervliet Civic Center (C) , Watervliet City Hall (D) , Watervliet Hose House Number 3 (E) , Saint Brigid's Hall (F) , Watervliet Fire Department (G) . Display/hide their locations on the map
Churches in Watervliet include: (A) , Saint Gabriels Chapel (B) , First Wesleyan Methodist Church (C) , Second Presbyterian Church (D) , Saint Brigid's Roman Catholic Church (E) , Trinity Church of Watervliet (F) , First Avenue Methodist Episcopal Church (G) , North Reformed Dutch Church (H) , First Baptist Church (I) . Display/hide their locations on the map
Park in Watervliet: (1) . Display/hide its location on the map
Tourist attraction:
Hotels:
Birthplace of: Leland Stanford - (1824-1893), businessman, railroad executive, founder of Stanford University, Peter J. Dalessondro - Army Medal of Honor recipient, Joe Alaskey - Actor, Butch Byrd - Football player, George May Phelps - Inventor of automated telegraphy devices., Isaac J. Lansing - Theologian, Jack O'Brien (outfielder) - Baseball player, Pat Simmons (baseball) - Baseball player.
Albany County has a predicted average indoor radon screening level greater than 4 pCi/L (pico curies per liter) - Highest Potential Average household size: This city:
2.1 peopleNew York:
2.6 people
Percentage of family households: This city:
49.4%Whole state:
63.5%
Percentage of households with unmarried partners: This city:
12.1%Whole state:
6.8%
Likely homosexual households (counted as self-reported same-sex unmarried-partner households)
Lesbian couples: 0.6% of all households Gay men: 0.2% of all households
9 people in group homes intended for adults in 2010people in group homes for juveniles (non-correctional) in 2010people in homes for the mentally retarded in 2000people in religious group quarters in 2000
Banks with branches in Watervliet (2011 data):
Bank of America, National Association: Watervliet Branch at 1400 Second Avenue, branch established on 1948/04/05. Info updated 2009/11/18: Bank assets: $1,451,969.3 mil, Deposits: $1,077,176.8 mil, headquarters in Charlotte, NC, positive income , 5782 total offices , Holding Company: Bank Of America Corporation
First Niagara Bank, National Association: Watervliet Branch at 1601 Broadway, branch established on 1984/03/24. Info updated 2011/06/09: Bank assets: $32,750.6 mil, Deposits: $19,595.4 mil, headquarters in Buffalo, NY, positive income , Commercial Lending Specialization, 351 total offices , Holding Company: First Niagara Financial Group, Inc.
Pioneer Savings Bank: Watervliet Branch at 2000 Second Avenue, branch established on 1972/07/01. Info updated 2010/07/23: Bank assets: $767.8 mil, Deposits: $665.8 mil, headquarters in Troy, NY, positive income , Commercial Lending Specialization, 16 total offices
For population 15 years and over in Watervliet:
Never married: 49.5%Now married: 30.8%Separated: 2.2%Widowed: 6.8%Divorced: 10.8% For population 25 years and over in Watervliet:
High school or higher: 89.9%Bachelor's degree or higher: 18.9%Graduate or professional degree: 5.6%Unemployed: 4.4%Mean travel time to work (commute): 20.3 minutes
Education Gini index (Inequality in education) Here:
9.2New York average:
13.9
Religion statistics for Watervliet, NY (based on Albany County data)
Religion Adherents Congregations Catholic 85,267 29 Mainline Protestant 17,188 78 Evangelical Protestant 15,873 72 Other 14,472 31 Black Protestant 2,739 11 Orthodox 2,025 9 None 166,640 -
Source: Clifford Grammich, Kirk Hadaway, Richard Houseal, Dale E.Jones, Alexei Krindatch, Richie Stanley and Richard H.Taylor. 2012. 2010 U.S.Religion Census: Religious Congregations & Membership Study. Association of Statisticians of American Religious Bodies. Jones, Dale E., et al. 2002. Congregations and Membership in the United States 2000. Nashville, TN: Glenmary Research Center. Graphs represent county-level data
Food Environment Statistics: Number of grocery stores : 75Albany County :
2.51 / 10,000 pop.State :
4.13 / 10,000 pop.
Number of supercenters and club stores : 2Albany County :
0.07 / 10,000 pop.New York :
0.06 / 10,000 pop.
Number of convenience stores (no gas) : 32Albany County :
1.07 / 10,000 pop.New York :
0.92 / 10,000 pop.
Number of convenience stores (with gas) : 94Here :
3.15 / 10,000 pop.New York :
1.68 / 10,000 pop.
Number of full-service restaurants : 303Albany County :
10.15 / 10,000 pop.New York :
8.82 / 10,000 pop.
Adult diabetes rate : This county :
7.8%State :
8.2%
Adult obesity rate : Albany County :
25.6%State :
23.8%
Low-income preschool obesity rate : Albany County :
14.0%State :
15.6%
Health and Nutrition:
Average overall health of teeth and gums : Watervliet:
46.3%State:
48.1%
People feeling badly about themselves : People not drinking alcohol at all : This city:
10.4%New York:
11.1%
Average hours sleeping at night : This city:
6.9New York:
6.8
Overweight people : This city:
33.2%New York:
33.4%
General health condition : Average condition of hearing : More about Health and Nutrition of Watervliet, NY Residents
Local government employment and payroll (March 2022)
Function
Full-time employees
Monthly full-time payroll
Average yearly full-time wage
Part-time employees
Monthly part-time payroll
Police Protection - Officers
27 $236,163 $104,961 0 $0 Firefighters
24 $167,541 $83,771 0 $0 Water Supply
12 $75,065 $75,065 0 $0 Streets and Highways
9 $43,701 $58,268 0 $0 Financial Administration
7 $37,970 $65,091 5 $10,325 Other Government Administration
6 $30,286 $60,572 8 $29,088 Police - Other
4 $16,643 $49,929 9 $8,407 Parks and Recreation
3 $15,996 $63,984 2 $2,366 Judicial and Legal
0 $0 2 $21,472 Other and Unallocable
0 $0 1 $2,217
Totals for Government
92 $623,365 $81,308 27 $73,875
Watervliet government finances - Expenditure in 2017 (per resident):
Construction - General - Other: $1,943,000 ($190.14)
Current Operations - General - Other: $4,426,000 ($433.11)
Police Protection: $2,696,000 ($263.82)Local Fire Protection: $2,377,000 ($232.61)Water Utilities: $2,265,000 ($221.65)Sewerage: $1,059,000 ($103.63)Solid Waste Management: $474,000 ($46.38)Regular Highways: $305,000 ($29.85)Central Staff Services: $235,000 ($23.00)Parks and Recreation: $196,000 ($19.18)Financial Administration: $167,000 ($16.34)Protective Inspection and Regulation - Other: $140,000 ($13.70)General Public Buildings: $74,000 ($7.24)Judicial and Legal Services: $63,000 ($6.16)Libraries: $41,000 ($4.01)Housing and Community Development: $36,000 ($3.52)Health - Other: $35,000 ($3.42)General - Interest on Debt: $517,000 ($50.59)
Other Capital Outlay - Regular Highways: $311,000 ($30.43)
Water Utilities: $56,000 ($5.48)Local Fire Protection: $49,000 ($4.79)Total Salaries and Wages: $6,573,000 ($643.21)
Watervliet government finances - Revenue in 2017 (per resident):
Charges - Sewerage: $1,077,000 ($105.39)
Other: $393,000 ($38.46)Housing and Community Development: $34,000 ($3.33)Solid Waste Management: $25,000 ($2.45)Parks and Recreation: $5,000 ($0.49)Local Intergovernmental - General Local Government Support: $3,474,000 ($339.95)
Other: $1,353,000 ($132.40)Miscellaneous - General Revenue - Other: $801,000 ($78.38)
Sale of Property: $105,000 ($10.27)Fines and Forfeits: $18,000 ($1.76)Interest Earnings: $2,000 ($0.20)Revenue - Water Utilities: $2,752,000 ($269.30)
State Intergovernmental - General Local Government Support: $1,210,000 ($118.41)
Other: $460,000 ($45.01)Highways: $311,000 ($30.43)Health and Hospitals: $3,000 ($0.29)Tax - Property: $4,169,000 ($407.97)
Other License: $328,000 ($32.10)Public Utilities Sales: $245,000 ($23.97)
Watervliet government finances - Debt in 2017 (per resident):
Long Term Debt - Outstanding Unspecified Public Purpose: $7,773,000 ($760.64)
Beginning Outstanding - Unspecified Public Purpose: $5,939,000 ($581.17)Issue, Unspecified Public Purpose: $2,509,000 ($245.52)Retired Unspecified Public Purpose: $675,000 ($66.05)Short Term Debt Outstanding - Beginning: $2,696,000 ($263.82)
End of Fiscal Year: $1,000,000 ($97.86)
Watervliet government finances - Cash and Securities in 2017 (per resident):
Bond Funds - Cash and Securities: $69,000 ($6.75)
Other Funds - Cash and Securities: $880,000 ($86.11)
Sinking Funds - Cash and Securities: $362,000 ($35.42)
Businesses in Watervliet, NY
Name Count Name Count
Advance Auto Parts 1 Rite Aid 1 Dunkin Donuts 1 Subway 1 FedEx 1 True Value 1 McDonald's 1 UPS 1 Pizza Hut 1
Strongest AM radio stations in Watervliet:
WPTR (1540 AM; 50 kW; ALBANY, NY; Owner: KIMTRON, INC.)
WGY (810 AM; 50 kW; SCHENECTADY, NY; Owner: CLEAR CHANNEL BROADCASTING LICENSES, INC.)
WOFX (980 AM; 5 kW; TROY, NY)
WROW (590 AM; 5 kW; ALBANY, NY; Owner: 6 JOHNSON ROAD LICENSES, INC.)
WHAZ (1330 AM; 1 kW; TROY, NY; Owner: CAPITAL MEDIA CORPORATION)
WDDY (1460 AM; 5 kW; ALBANY, NY)
WTMM (1300 AM; 5 kW; RENSSELAER, NY; Owner: REGENT LICENSEE OF MANSFIELD, INC.)
WAMC (1400 AM; 1 kW; ALBANY, NY; Owner: WAMC)
WABY (1160 AM; 5 kW; MECHANICVILLE, NY; Owner: ANASTOS MEDIA GROUP, INC.)
WNNZ (640 AM; 50 kW; WESTFIELD, MA; Owner: CLEAR CHANNEL BROADCASTING LICENSES, INC.)
WTIC (1080 AM; 50 kW; HARTFORD, CT; Owner: INFINITY RADIO OPERATIONS INC.)
WCRN (830 AM; 50 kW; WORCESTER, MA; Owner: CARTER BROADCASTING CORPORATION)
WUHN (1110 AM; daytime; 5 kW; PITTSFIELD, MA; Owner: WEINER BROADCASTING, INC.)
Strongest FM radio stations in Watervliet:
WRPI (91.5 FM; TROY, NY; Owner: RENSSELAER POLYTECHNIC INSTITUTE)
WHRL (103.1 FM; ALBANY, NY; Owner: CLEAR CHANNEL BROADCASTING LICENSES, INC.)
WZEC (97.5 FM; HOOSICK FALLS, NY; Owner: GREAT NORTHERN RADIO, LLC)
WYJB (95.5 FM; ALBANY, NY; Owner: 6 JOHNSON ROAD LICENSES, INC.)
WAJZ (96.3 FM; VOORHEESVILLE, NY; Owner: 6 JOHNSON ROAD LICENSES, INC.)
WGNA-FM (107.7 FM; ALBANY, NY; Owner: REGENT LICENSEE OF MANSFIELD, INC.)
WZMR (104.9 FM; ALTAMONT, NY; Owner: 6 JOHNSON ROAD LICENSES, INC.)
WAMC-FM (90.3 FM; ALBANY, NY; Owner: WAMC)
WRVE (99.5 FM; SCHENECTADY, NY; Owner: CLEAR CHANNEL BROADCASTING LICENSES, INC.)
WMHT-FM (89.1 FM; SCHENECTADY, NY; Owner: WMHT EDUCATIONAL TELECOMMUNICATIONS)
WPYX (106.5 FM; ALBANY, NY; Owner: CAPSTAR TX LIMITED PARTNERSHIP)
WFLY (92.3 FM; TROY, NY; Owner: 6 JOHNSON ROAD LICENSES, INC.)
WVCR-FM (88.3 FM; LOUDONVILLE, NY; Owner: SIENA COLLEGE)
WKLI-FM (100.9 FM; ALBANY, NY; Owner: 6 JOHNSON ROAD LICENSES, INC.)
WCDB (90.9 FM; ALBANY, NY; Owner: STATE UNIVERSITY OF NEW YORK)
WEQX (102.7 FM; MANCHESTER, VT; Owner: NORTHSHIRE COMMUNICATIONS, INC.)
WJAN (95.1 FM; SUNDERLAND, VT; Owner: 6 JOHNSON ROAD LICENSES, INC.)
WQBK-FM (103.9 FM; RENSSELAER, NY; Owner: REGENT LICENSEE OF MANSFIELD, INC.)
WKKF (102.3 FM; BALLSTON SPA, NY; Owner: CLEAR CHANNEL BROADCASTING LICENSES, INC.)
WPGL (90.7 FM; PATTERSONVILLE, NY; Owner: SOUND OF LIFE, INC.)
TV broadcast stations around Watervliet:
WRGB (Channel 6; SCHENECTADY, NY; Owner: FREEDOM BROADCASTING OF NEW YORK, INC)
WTEN (Channel 10; ALBANY, NY; Owner: YOUNG BROADCASTING OF ALBANY, INC.)
WNYT (Channel 13; ALBANY, NY; Owner: WNYT-TV, LLC)
WMHT (Channel 17; SCHENECTADY, NY; Owner: WMHT EDUCATIONAL TELECOMMUNICATIONS)
WEWB-TV (Channel 45; SCHENECTADY, NY; Owner: WEWB, L.L.C.)
WXXA-TV (Channel 23; ALBANY, NY; Owner: CLEAR CHANNEL BROADCASTING LICENSES, INC.)
WYPX (Channel 55; AMSTERDAM, NY; Owner: PAXSON ALBANY LICENSE, INC.)
WNGN-LP (Channel 26; TROY, NY; Owner: BRIAN A. LARSON)
W52DF (Channel 52; ALBANY, NY; Owner: TRINITY BROADCASTING NETWORK)
Medal of Honor Recipients
Medal of Honor Recipient born in Watervliet: Peter J. Dalessondro.
FCC Registered Antenna Towers: 4
Bella Harris, 0.32nm Northwest Of The Intersection Of Spring St Rd And Grenada Terrace. (Lat: 42.719556 Lon: -73.722222), Type: 50.0, Structure height: 36001 m, Overall height: 50 m, Registrant: Evolution Site Services, LLC, Chris@evosites.Com, , 2854 Pitts-field, Phone: (413) 447-7712 Bella Harris, 0.32nm Northwest Of The Intersection Of Spring St Rd And Grenada Terrace. (Lat: 42.719556 Lon: -73.722222), Type: 50.0, Structure height: 36001 m, Overall height: 50 m, Registrant: Evolution Site Services, LLC, Chris@evosites.Com, , 2854 Pitts-field, Phone: (413) 447-7712 Bella Harris, 0.32nm Northwest Of The Intersection Of Spring St Rd And Grenada Terrace. (Lat: 42.719556 Lon: -73.722222), Type: 50.0, Structure height: 36001 m, Overall height: 50 m, Registrant: Evolution Site Services, LLC, Chris@evosites.Com, , 2854 Pitts-field, Phone: (413) 447-7712 Bella Harris, 0.32nm Northwest Of The Intersection Of Spring St Rd And Grenada Terrace. (Lat: 42.719556 Lon: -73.722222), Type: 50.0, Structure height: 36001 m, Overall height: 50 m, Registrant: Evolution Site Services, LLC, Chris@evosites.Com, , 2854 Pitts-field, Phone: (413) 447-7712 FCC Registered Broadcast Land Mobile Towers: 12 (
See the full list of FCC Registered Broadcast Land Mobile Towers in Watervliet, NY )
FCC Registered Microwave Towers: 3
STATION, Norton Bldg 25th & 8th Sts Remote Campus (Lat: 42.736444 Lon: -73.707889), Structure height: 13.7 m, Overall height: 16.2 m, Call Sign: WNEX210, Assigned Frequencies: 1880.00 MHz, Grant Date: 02/03/1995, Expiration Date: 02/03/2000, Cancellation Date: 12/03/1996, Phone: (202) 879-3422 WATERVLIET WT, Off Of Rte 2 (Lat: 42.736583 Lon: -73.718778), Type: Tank, Structure height: 22.5 m, Overall height: 29.5 m, Call Sign: WQWW711, Assigned Frequencies: 11245.0 MHz, 11405.0 MHz, Grant Date: 12/10/2015, Expiration Date: 12/10/2025, Certifier: Gregory M Romano, Registrant: Verizon, 1300 I St Nw - Suite 500 East, Washington, DC 20005, Phone: (202) 515-2453, Email:
Maplewood Sub., 67 Crabapple Lane (Lat: 42.745111 Lon: -73.708306), Type: Pole, Structure height: 9.1 m, Call Sign: WRTJ764, Assigned Frequencies: 953.950 MHz, Grant Date: 06/24/2022, Expiration Date: 06/24/2032, Certifier: Robert Tiller, Registrant: Crenshaw Communications Consulting, LLC., Harvey Mitchell Parkway, College Station, TX 77842, Phone: (832) 617-0217, Email:
FCC Registered Amateur Radio Licenses: 63 (
See the full list of FCC Registered Amateur Radio Licenses in Watervliet )
FAA Registered Aircraft: 4
Aircraft: LOGAN ROB LOGAN LANCAIR LEGACY (Category: Land, Seats: 2, Weight: Up to 12,499 Pounds), Engine: CONT MOTOR IO-550 SERIES (300 HP) (Reciprocating)N-Number: 18GG, N18GG, N-18GG, Serial Number: 134, Year manufactured: 2002, Airworthiness Date: 12/19/2002, Certificate Issue Date: 10/02/2002Registrant (Individual): Rob Logan, 45 Verdun St, Watervliet, NY 12189Aircraft: CESSNA 182P (Category: Land, Seats: 4, Weight: Up to 12,499 Pounds, Speed: 120 mph), Engine: CONT MOTOR O-470 SERIES (230 HP) (Reciprocating)N-Number: 6227F, N6227F, N-6227F, Serial Number: 18264132, Year manufactured: 1975, Airworthiness Date: 08/25/1975, Certificate Issue Date: 10/11/2018Registrant (Individual): Timothy Alund, 163 Boght Rd, Watervliet, NY 12189Aircraft: BEECH A36 (Category: Land, Seats: 6, Weight: Up to 12,499 Pounds, Speed: 138 mph), Engine: ReciprocatingN-Number: 6757D, N6757D, N-6757D, Serial Number: E-1698, Year manufactured: 1980, Airworthiness Date: 04/22/1980, Certificate Issue Date: 02/28/1986Registrant (Corporation): Douglas Sales & Promotions Corp, 811 10th St, Watervliet, NY 12189Aircraft: DJI PHANTOM 3 PROFESSION (Category: Land, Engines: 4), Engine: ElectricN-Number: 592BQ, N592BQ, N-592BQ, Serial Number: P78DCG22031688Registrant (Individual): Reported Sale, 910 19th St Apt 2, Watervliet, NY 12189Deregistered: Cancel Date: 05/30/2018
Home Mortgage Disclosure Act Aggregated Statistics For Year 2009(Based on 3 full tracts) A) FHA, FSA/RHS & VA B) Conventional C) Refinancings D) Home Improvement Loans E) Loans on Dwellings For 5+ Families F) Non-occupant Loans on G) Loans On Manufactured Number Average Value Number Average Value Number Average Value Number Average Value Number Average Value Number Average Value Number Average Value
LOANS ORIGINATED 59 $129,441 24 $133,042 103 $114,223 12 $18,917 0 $0 18 $97,333 0 $0 APPLICATIONS APPROVED, NOT ACCEPTED 7 $137,286 1 $100,000 9 $138,222 1 $16,000 0 $0 2 $107,000 0 $0 APPLICATIONS DENIED 6 $133,167 18 $90,778 53 $122,585 11 $16,000 0 $0 12 $88,000 1 $13,000 APPLICATIONS WITHDRAWN 11 $125,727 4 $96,000 26 $121,038 0 $0 1 $9,554,000 1 $65,000 0 $0 FILES CLOSED FOR INCOMPLETENESS 4 $106,500 1 $357,000 6 $88,500 1 $100,000 0 $0 0 $0 0 $0
Aggregated Statistics For Year 2008(Based on 3 full tracts) A) FHA, FSA/RHS & VA B) Conventional C) Refinancings D) Home Improvement Loans E) Loans on Dwellings For 5+ Families F) Non-occupant Loans on G) Loans On Manufactured Number Average Value Number Average Value Number Average Value Number Average Value Number Average Value Number Average Value Number Average Value
LOANS ORIGINATED 47 $138,340 51 $99,667 82 $111,988 23 $42,130 2 $162,500 30 $94,400 0 $0 APPLICATIONS APPROVED, NOT ACCEPTED 6 $128,333 11 $110,182 25 $117,800 4 $70,250 0 $0 7 $97,714 0 $0 APPLICATIONS DENIED 17 $142,294 14 $98,500 81 $103,123 22 $26,136 0 $0 19 $96,158 0 $0 APPLICATIONS WITHDRAWN 8 $143,000 8 $112,750 42 $112,357 3 $58,333 0 $0 8 $98,375 1 $70,000 FILES CLOSED FOR INCOMPLETENESS 2 $135,000 8 $124,250 14 $116,643 1 $108,000 0 $0 7 $91,857 0 $0
Aggregated Statistics For Year 2007(Based on 3 full tracts) A) FHA, FSA/RHS & VA B) Conventional C) Refinancings D) Home Improvement Loans F) Non-occupant Loans on G) Loans On Manufactured Number Average Value Number Average Value Number Average Value Number Average Value Number Average Value Number Average Value
LOANS ORIGINATED 29 $145,483 108 $116,370 117 $103,368 35 $42,257 52 $115,250 0 $0 APPLICATIONS APPROVED, NOT ACCEPTED 6 $152,667 30 $86,000 27 $100,259 5 $50,000 17 $93,235 2 $30,000 APPLICATIONS DENIED 3 $168,333 41 $92,951 112 $106,295 55 $40,873 35 $113,371 2 $50,000 APPLICATIONS WITHDRAWN 4 $120,500 14 $96,429 47 $105,340 11 $60,909 8 $61,625 0 $0 FILES CLOSED FOR INCOMPLETENESS 1 $140,000 8 $103,000 11 $110,818 1 $137,000 3 $105,667 0 $0
Aggregated Statistics For Year 2006(Based on 3 full tracts) A) FHA, FSA/RHS & VA B) Conventional C) Refinancings D) Home Improvement Loans E) Loans on Dwellings For 5+ Families F) Non-occupant Loans on G) Loans On Manufactured Number Average Value Number Average Value Number Average Value Number Average Value Number Average Value Number Average Value Number Average Value
LOANS ORIGINATED 40 $121,025 153 $96,471 173 $97,012 46 $34,630 0 $0 106 $98,462 0 $0 APPLICATIONS APPROVED, NOT ACCEPTED 2 $117,000 20 $91,350 34 $86,118 9 $40,111 2 $277,500 14 $87,429 0 $0 APPLICATIONS DENIED 1 $151,000 58 $112,741 131 $95,145 52 $38,942 1 $76,000 47 $106,851 5 $64,400 APPLICATIONS WITHDRAWN 7 $116,571 32 $120,000 71 $96,408 8 $45,250 0 $0 27 $118,889 3 $107,333 FILES CLOSED FOR INCOMPLETENESS 1 $112,000 12 $138,250 20 $104,350 0 $0 0 $0 8 $86,875 1 $86,000
Aggregated Statistics For Year 2005(Based on 3 full tracts) A) FHA, FSA/RHS & VA B) Conventional C) Refinancings D) Home Improvement Loans E) Loans on Dwellings For 5+ Families F) Non-occupant Loans on G) Loans On Manufactured Number Average Value Number Average Value Number Average Value Number Average Value Number Average Value Number Average Value Number Average Value
LOANS ORIGINATED 18 $113,278 148 $90,851 172 $89,907 37 $23,243 0 $0 74 $89,919 0 $0 APPLICATIONS APPROVED, NOT ACCEPTED 2 $120,000 24 $81,667 30 $80,267 6 $27,500 0 $0 12 $86,417 0 $0 APPLICATIONS DENIED 5 $118,000 49 $100,184 126 $89,230 32 $24,531 1 $190,000 32 $106,094 1 $129,000 APPLICATIONS WITHDRAWN 1 $122,000 11 $86,364 110 $97,827 8 $24,375 1 $200,000 9 $107,222 0 $0 FILES CLOSED FOR INCOMPLETENESS 0 $0 8 $104,375 18 $85,556 1 $80,000 0 $0 6 $62,500 0 $0
Aggregated Statistics For Year 2004(Based on 3 full tracts) A) FHA, FSA/RHS & VA B) Conventional C) Refinancings D) Home Improvement Loans E) Loans on Dwellings For 5+ Families F) Non-occupant Loans on G) Loans On Manufactured Number Average Value Number Average Value Number Average Value Number Average Value Number Average Value Number Average Value Number Average Value
LOANS ORIGINATED 35 $91,514 117 $76,419 149 $83,356 37 $28,297 1 $500,000 56 $81,339 0 $0 APPLICATIONS APPROVED, NOT ACCEPTED 1 $129,000 13 $67,846 26 $83,308 3 $18,667 0 $0 11 $87,364 0 $0 APPLICATIONS DENIED 2 $115,000 29 $79,483 108 $82,093 24 $37,917 1 $144,000 20 $81,100 1 $59,000 APPLICATIONS WITHDRAWN 4 $79,250 16 $75,688 105 $83,790 5 $49,800 1 $81,000 18 $85,889 0 $0 FILES CLOSED FOR INCOMPLETENESS 0 $0 4 $98,750 13 $76,615 0 $0 0 $0 4 $84,000 0 $0
Aggregated Statistics For Year 2003(Based on 3 full tracts) A) FHA, FSA/RHS & VA B) Conventional C) Refinancings D) Home Improvement Loans E) Loans on Dwellings For 5+ Families F) Non-occupant Loans on Number Average Value Number Average Value Number Average Value Number Average Value Number Average Value Number Average Value
LOANS ORIGINATED 46 $89,761 83 $75,265 178 $74,236 11 $24,909 1 $110,000 66 $69,909 APPLICATIONS APPROVED, NOT ACCEPTED 1 $69,000 16 $64,750 31 $79,710 5 $30,800 0 $0 7 $62,286 APPLICATIONS DENIED 1 $108,000 28 $75,500 112 $75,277 25 $18,520 0 $0 29 $75,517 APPLICATIONS WITHDRAWN 3 $94,333 9 $79,333 61 $78,311 7 $25,857 0 $0 8 $70,375 FILES CLOSED FOR INCOMPLETENESS 0 $0 4 $98,000 10 $75,500 0 $0 0 $0 2 $59,500
Aggregated Statistics For Year 2002(Based on 3 full tracts) A) FHA, FSA/RHS & VA B) Conventional C) Refinancings D) Home Improvement Loans E) Loans on Dwellings For 5+ Families F) Non-occupant Loans on Number Average Value Number Average Value Number Average Value Number Average Value Number Average Value Number Average Value
LOANS ORIGINATED 38 $78,974 53 $65,075 101 $68,614 18 $14,778 1 $48,000 29 $57,586 APPLICATIONS APPROVED, NOT ACCEPTED 3 $85,333 5 $61,400 27 $70,630 3 $24,333 0 $0 3 $55,000 APPLICATIONS DENIED 0 $0 21 $64,190 103 $72,379 21 $14,905 0 $0 13 $61,923 APPLICATIONS WITHDRAWN 8 $73,625 3 $111,000 59 $70,593 5 $20,000 0 $0 5 $73,800 FILES CLOSED FOR INCOMPLETENESS 1 $60,000 0 $0 8 $65,500 1 $13,000 0 $0 0 $0
Aggregated Statistics For Year 2001(Based on 3 full tracts) A) FHA, FSA/RHS & VA B) Conventional C) Refinancings D) Home Improvement Loans F) Non-occupant Loans on Number Average Value Number Average Value Number Average Value Number Average Value Number Average Value
LOANS ORIGINATED 33 $78,758 34 $63,853 67 $69,597 13 $12,846 17 $56,824 APPLICATIONS APPROVED, NOT ACCEPTED 0 $0 6 $63,333 12 $53,833 4 $31,000 4 $61,250 APPLICATIONS DENIED 3 $81,333 20 $62,000 108 $63,981 18 $15,222 9 $71,778 APPLICATIONS WITHDRAWN 9 $68,667 8 $52,125 51 $76,137 5 $29,200 5 $55,000 FILES CLOSED FOR INCOMPLETENESS 0 $0 3 $56,000 5 $71,400 0 $0 0 $0
Aggregated Statistics For Year 2000(Based on 3 full tracts) A) FHA, FSA/RHS & VA B) Conventional C) Refinancings D) Home Improvement Loans E) Loans on Dwellings For 5+ Families F) Non-occupant Loans on Number Average Value Number Average Value Number Average Value Number Average Value Number Average Value Number Average Value
LOANS ORIGINATED 42 $71,738 37 $63,027 42 $47,405 24 $16,333 1 $142,000 13 $60,615 APPLICATIONS APPROVED, NOT ACCEPTED 1 $68,000 9 $51,444 10 $57,800 7 $15,571 0 $0 3 $56,667 APPLICATIONS DENIED 3 $62,000 11 $57,636 75 $57,920 15 $14,333 0 $0 4 $56,750 APPLICATIONS WITHDRAWN 3 $76,667 8 $66,000 25 $63,800 2 $10,000 0 $0 3 $44,333 FILES CLOSED FOR INCOMPLETENESS 0 $0 3 $60,000 5 $45,800 0 $0 0 $0 0 $0
Aggregated Statistics For Year 1999(Based on 2 full and 1 partial tracts) A) FHA, FSA/RHS & VA B) Conventional C) Refinancings D) Home Improvement Loans F) Non-occupant Loans on Number Average Value Number Average Value Number Average Value Number Average Value Number Average Value
LOANS ORIGINATED 43 $68,916 27 $60,692 68 $61,274 31 $7,409 11 $51,273 APPLICATIONS APPROVED, NOT ACCEPTED 2 $61,625 6 $59,740 20 $65,179 5 $27,488 4 $59,712 APPLICATIONS DENIED 1 $85,000 10 $39,596 75 $55,737 19 $29,908 7 $28,187 APPLICATIONS WITHDRAWN 3 $74,000 5 $67,196 44 $62,239 8 $22,515 5 $64,508 FILES CLOSED FOR INCOMPLETENESS 1 $66,340 0 $0 8 $69,105 0 $0 0 $0
Detailed HMDA statistics for the following Tracts:
0132.00
, 0133.00 , 0134.00
Private Mortgage Insurance Companies Aggregated Statistics For Year 2009(Based on 2 full tracts) A) Conventional B) Refinancings C) Non-occupant Loans on Number Average Value Number Average Value Number Average Value
LOANS ORIGINATED 2 $125,500 1 $126,000 0 $0 APPLICATIONS APPROVED, NOT ACCEPTED 3 $106,333 0 $0 1 $54,000 APPLICATIONS DENIED 2 $139,500 1 $110,000 0 $0 APPLICATIONS WITHDRAWN 0 $0 0 $0 0 $0 FILES CLOSED FOR INCOMPLETENESS 0 $0 0 $0 0 $0
Aggregated Statistics For Year 2008(Based on 3 full tracts) A) Conventional B) Refinancings C) Non-occupant Loans on Number Average Value Number Average Value Number Average Value
LOANS ORIGINATED 22 $113,545 6 $124,333 6 $105,000 APPLICATIONS APPROVED, NOT ACCEPTED 10 $120,300 6 $140,833 2 $104,000 APPLICATIONS DENIED 2 $128,500 0 $0 1 $133,000 APPLICATIONS WITHDRAWN 2 $160,000 0 $0 0 $0 FILES CLOSED FOR INCOMPLETENESS 1 $129,000 0 $0 0 $0
Aggregated Statistics For Year 2007(Based on 3 full tracts) A) Conventional B) Refinancings C) Non-occupant Loans on Number Average Value Number Average Value Number Average Value
LOANS ORIGINATED 48 $122,375 3 $127,000 9 $121,778 APPLICATIONS APPROVED, NOT ACCEPTED 8 $127,500 3 $130,000 0 $0 APPLICATIONS DENIED 2 $98,500 1 $117,000 0 $0 APPLICATIONS WITHDRAWN 0 $0 0 $0 0 $0 FILES CLOSED FOR INCOMPLETENESS 0 $0 0 $0 0 $0
Aggregated Statistics For Year 2006(Based on 3 full tracts) A) Conventional B) Refinancings C) Non-occupant Loans on Number Average Value Number Average Value Number Average Value
LOANS ORIGINATED 27 $127,704 9 $119,444 7 $130,714 APPLICATIONS APPROVED, NOT ACCEPTED 5 $119,400 8 $109,000 4 $77,500 APPLICATIONS DENIED 0 $0 0 $0 0 $0 APPLICATIONS WITHDRAWN 0 $0 0 $0 0 $0 FILES CLOSED FOR INCOMPLETENESS 0 $0 0 $0 0 $0
Aggregated Statistics For Year 2005(Based on 3 full tracts) A) Conventional B) Refinancings C) Non-occupant Loans on Number Average Value Number Average Value Number Average Value
LOANS ORIGINATED 31 $98,516 10 $101,100 12 $100,750 APPLICATIONS APPROVED, NOT ACCEPTED 5 $89,400 1 $77,000 4 $79,500 APPLICATIONS DENIED 1 $157,000 0 $0 0 $0 APPLICATIONS WITHDRAWN 2 $95,500 1 $108,000 0 $0 FILES CLOSED FOR INCOMPLETENESS 2 $110,000 0 $0 1 $110,000
Aggregated Statistics For Year 2004(Based on 3 full tracts) A) Conventional B) Refinancings C) Non-occupant Loans on Number Average Value Number Average Value Number Average Value
LOANS ORIGINATED 32 $86,094 6 $84,667 7 $87,429 APPLICATIONS APPROVED, NOT ACCEPTED 8 $88,250 8 $91,000 1 $107,000 APPLICATIONS DENIED 1 $80,000 0 $0 1 $80,000 APPLICATIONS WITHDRAWN 5 $53,400 2 $85,500 0 $0 FILES CLOSED FOR INCOMPLETENESS 0 $0 0 $0 0 $0
Aggregated Statistics For Year 2003(Based on 3 full tracts) A) Conventional B) Refinancings C) Non-occupant Loans on Number Average Value Number Average Value Number Average Value
LOANS ORIGINATED 32 $81,844 23 $80,783 10 $72,700 APPLICATIONS APPROVED, NOT ACCEPTED 8 $85,625 14 $81,929 2 $88,000 APPLICATIONS DENIED 1 $87,000 1 $78,000 0 $0 APPLICATIONS WITHDRAWN 1 $117,000 7 $88,571 0 $0 FILES CLOSED FOR INCOMPLETENESS 0 $0 0 $0 0 $0
Aggregated Statistics For Year 2002(Based on 3 full tracts) A) Conventional B) Refinancings C) Non-occupant Loans on Number Average Value Number Average Value Number Average Value
LOANS ORIGINATED 16 $65,812 13 $78,308 8 $64,625 APPLICATIONS APPROVED, NOT ACCEPTED 2 $49,500 6 $81,833 1 $50,000 APPLICATIONS DENIED 2 $69,500 0 $0 0 $0 APPLICATIONS WITHDRAWN 0 $0 2 $85,500 0 $0 FILES CLOSED FOR INCOMPLETENESS 0 $0 0 $0 0 $0
Aggregated Statistics For Year 2001(Based on 3 full tracts) A) Conventional B) Refinancings C) Non-occupant Loans on Number Average Value Number Average Value Number Average Value
LOANS ORIGINATED 17 $70,412 5 $78,000 4 $48,000 APPLICATIONS APPROVED, NOT ACCEPTED 3 $77,333 3 $74,667 2 $69,000 APPLICATIONS DENIED 1 $62,000 1 $89,000 0 $0 APPLICATIONS WITHDRAWN 0 $0 0 $0 0 $0 FILES CLOSED FOR INCOMPLETENESS 0 $0 0 $0 0 $0
Aggregated Statistics For Year 2000(Based on 3 full tracts) A) Conventional B) Refinancings C) Non-occupant Loans on Number Average Value Number Average Value Number Average Value
LOANS ORIGINATED 10 $73,100 3 $72,000 0 $0 APPLICATIONS APPROVED, NOT ACCEPTED 3 $69,667 0 $0 2 $72,000 APPLICATIONS DENIED 3 $86,667 0 $0 2 $91,500 APPLICATIONS WITHDRAWN 0 $0 0 $0 0 $0 FILES CLOSED FOR INCOMPLETENESS 0 $0 0 $0 0 $0
Aggregated Statistics For Year 1999(Based on 2 full and 1 partial tracts) A) Conventional B) Refinancings C) Non-occupant Loans on Number Average Value Number Average Value Number Average Value
LOANS ORIGINATED 9 $60,846 7 $71,226 3 $50,357 APPLICATIONS APPROVED, NOT ACCEPTED 0 $0 0 $0 0 $0 APPLICATIONS DENIED 1 $77,740 0 $0 0 $0 APPLICATIONS WITHDRAWN 0 $0 0 $0 0 $0 FILES CLOSED FOR INCOMPLETENESS 0 $0 1 $102,390 0 $0
Detailed PMIC statistics for the following Tracts:
0132.00
, 0133.00 , 0134.00
Most common first names in Watervliet, NY among deceased individuals Name Count Lived (average)
Mary 320 79.9 years John 297 72.5 years William 179 74.1 years Joseph 171 74.7 years Anna 133 82.3 years Margaret 110 79.5 years Helen 109 80.1 years James 106 70.3 years Edward 88 71.4 years Robert 79 69.5 years
Most common last names in Watervliet, NY among deceased individuals Last name Count Lived (average)
Spiak 33 78.7 years Murphy 28 73.7 years Smith 27 77.4 years Wilson 21 78.2 years Kelly 21 78.3 years Jones 19 74.4 years Burke 18 82.8 years Williams 18 76.1 years Obrien 18 78.3 years Miller 18 74.8 years
Watervliet compared to New York state average:
Median household income below state average. Median house value significantly below state average. Unemployed percentage significantly below state average. Hispanic race population percentage below state average. Median age below state average. Foreign-born population percentage significantly below state average. Length of stay since moving in significantly above state average. Watervliet on our top lists :
#27 on the list of "Top 101 cities with largest percentage of females in occupations: office and administrative support occupations (population 5,000+)"
#34 on the list of "Top 101 cities with the largest percentage of unmarried partner households (population 5,000+)"
#63 on the list of "Top 101 cities with the most residents born in Chile (population 500+)"
#81 on the list of "Top 100 cities with old houses but young residents (pop. 5,000+)"
#93 on the list of "Top 100 cities with oldest houses (pop. 5,000+)"
#28 on the list of "Top 101 counties with the highest number of infant deaths per 1000 residents 2007-2013 (pop. 50,000+)"
#36 on the list of "Top 101 counties with the largest increase in the number of infant deaths per 1000 residents 2000-2006 to 2007-2013 (pop. 50,000+)"
#59 on the list of "Top 101 counties with the lowest number of births per 1000 residents 2007-2013"
#75 on the list of "Top 101 counties with the most Orthodox congregations"
#78 on the list of "Top 101 counties with the largest decrease in the number of deaths per 1000 residents 2000-2006 to 2007-2013 (pop. 50,000+)"
Top Patent Applicants
Balasubramanian S. Haran (84)
Balasubramanian Pranatharthiharan (48)
Ajey Poovannummoottil Jacob (45)
Qing Liu (32)
Patrick Joseph Mccloskey (22)
Kisik Choi (18)
Tadahiro Ishizaka (16)
Mark P. Wentland (15)
Robert T. Bondokov (15)
Dae Geun Yang (13)
Total of 567 patent applications in 2008-2024.
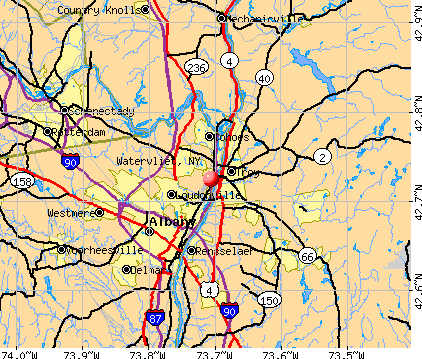


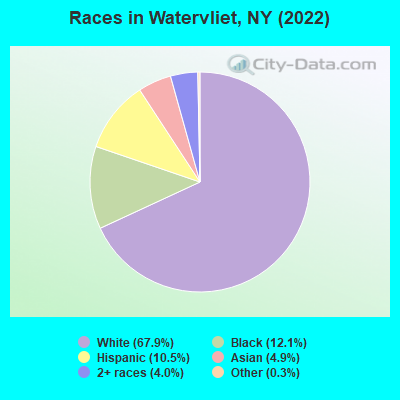
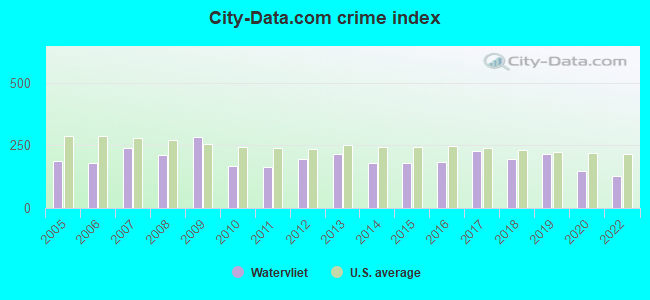
 Recent articles from our blog. Our writers, many of them Ph.D. graduates or candidates, create easy-to-read articles on a wide variety of topics.

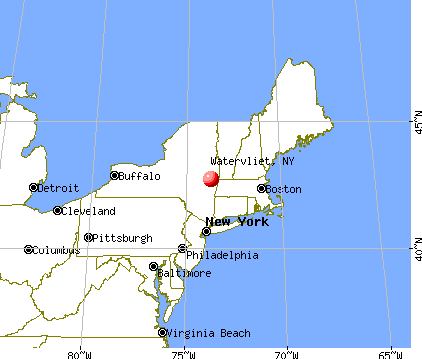
 (5.9 miles
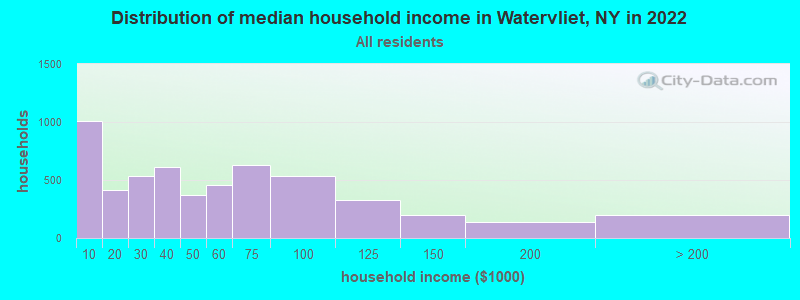
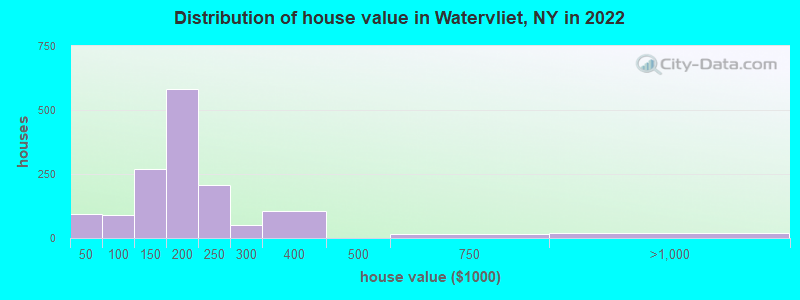

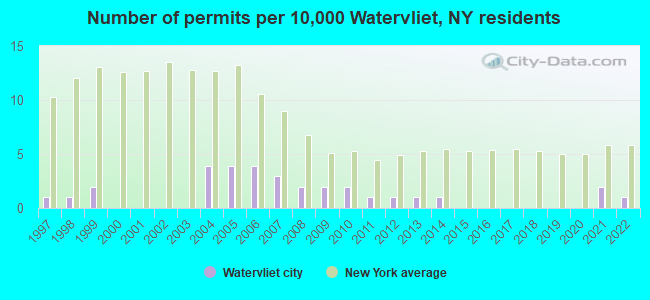
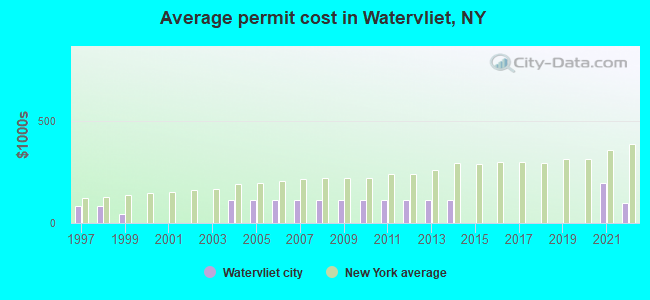
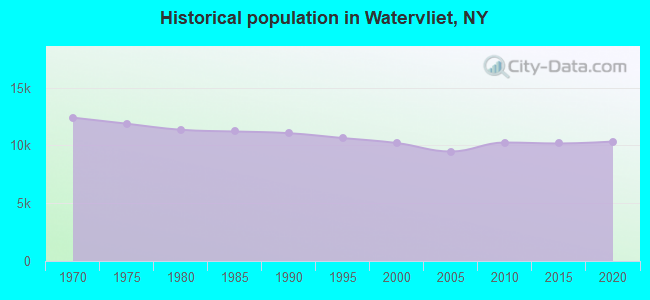
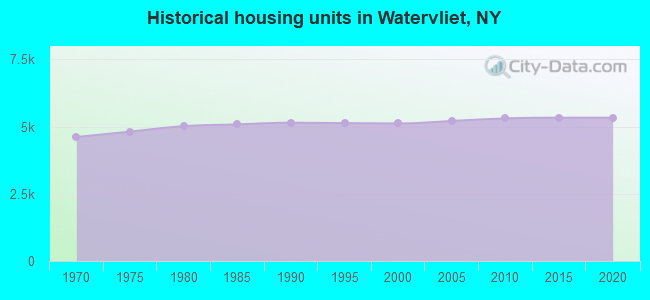
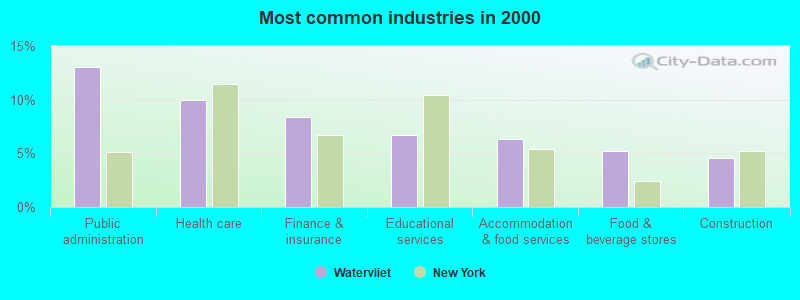
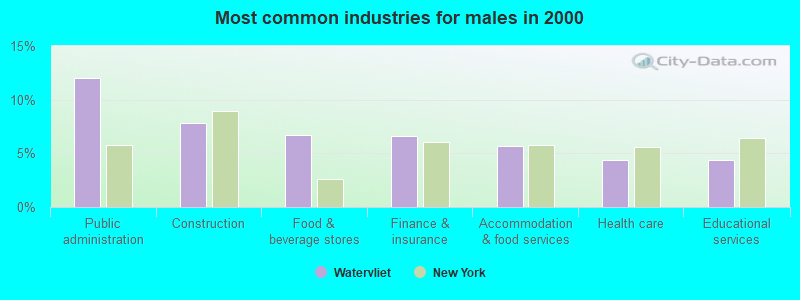
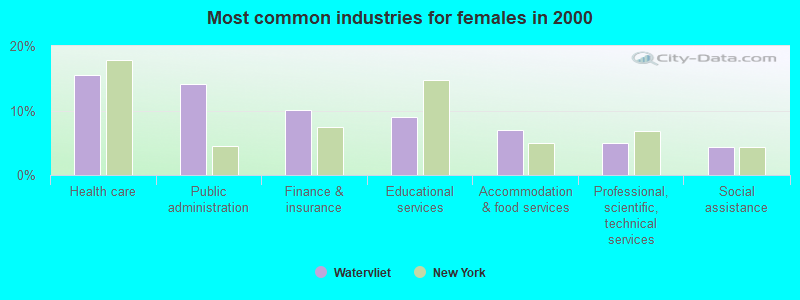
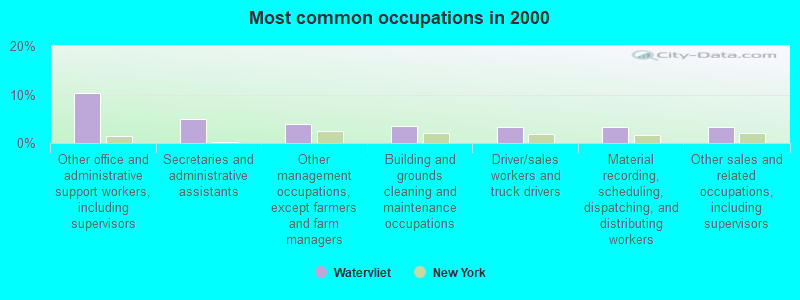
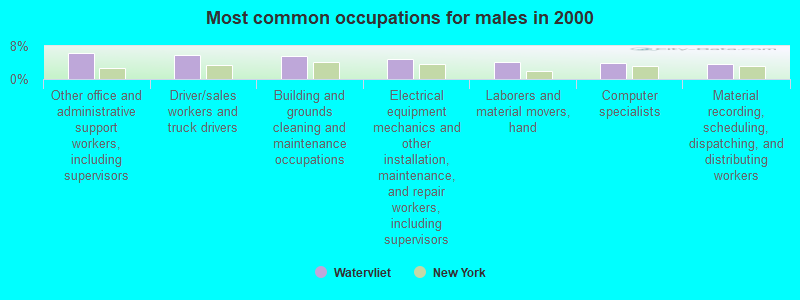
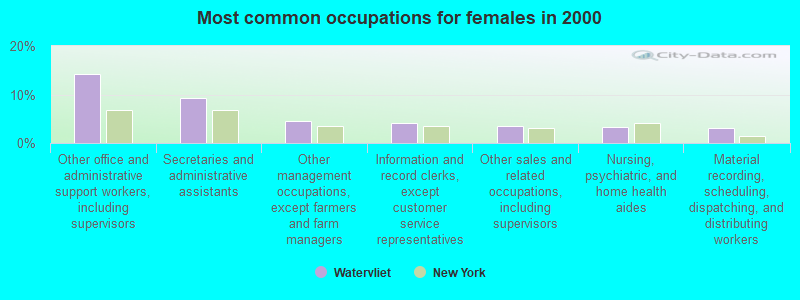


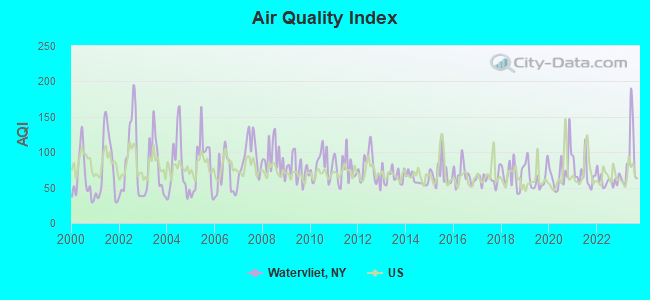
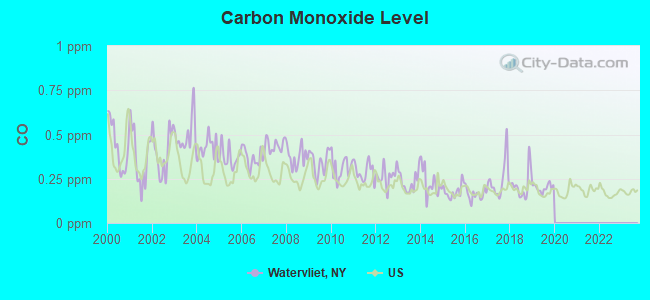
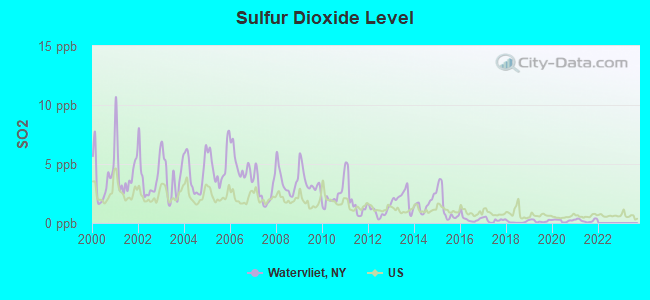
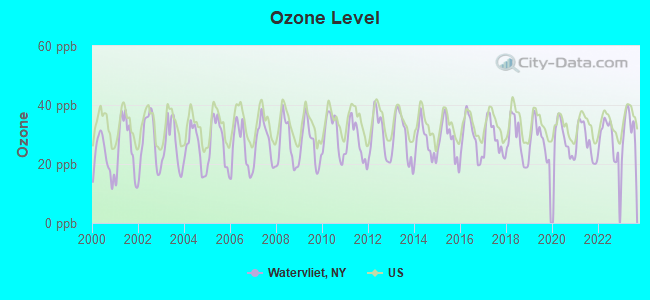
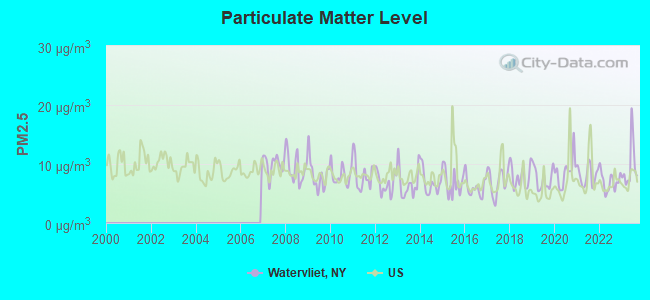

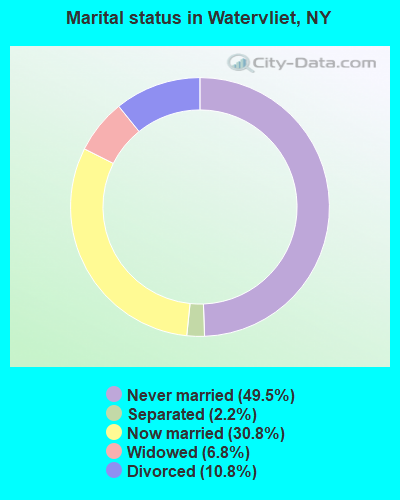
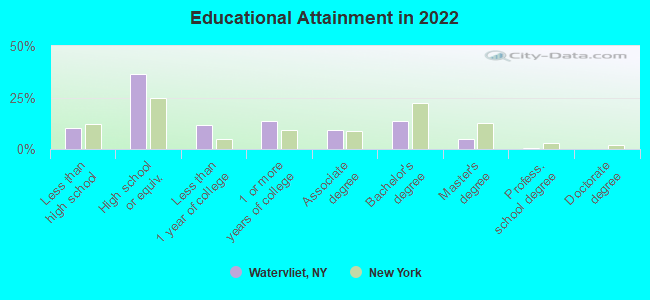
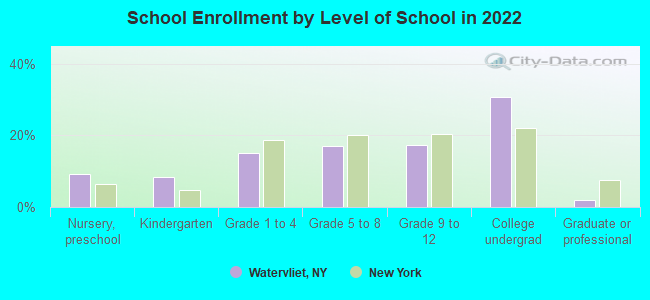
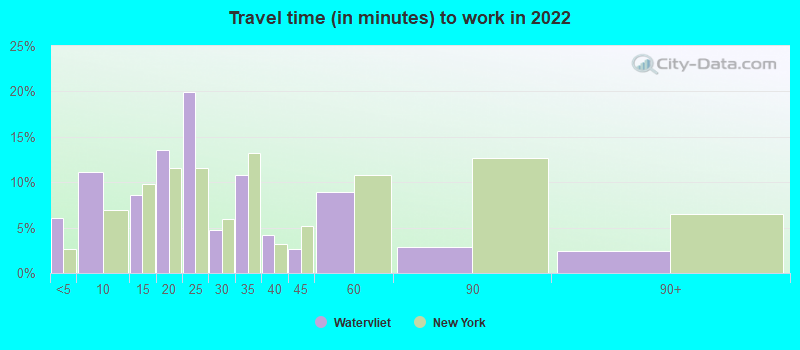
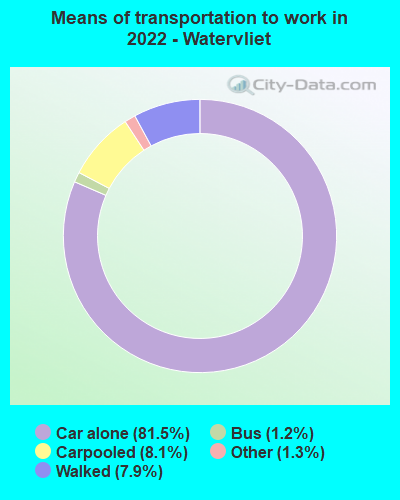
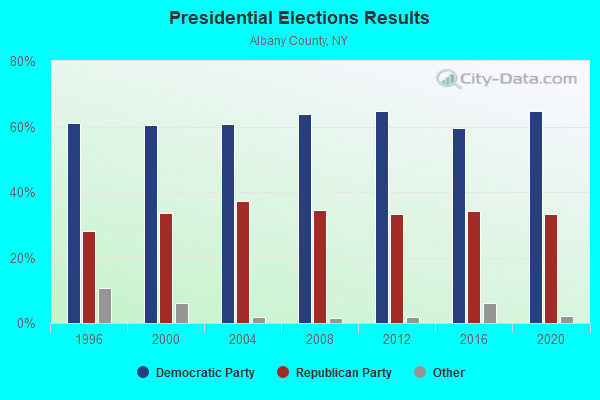
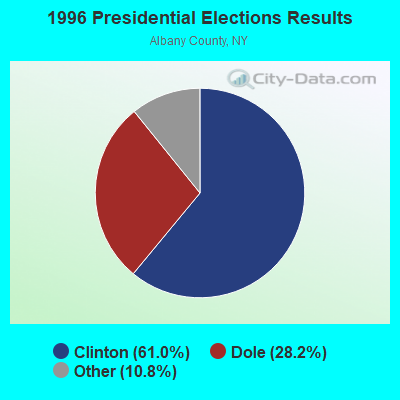
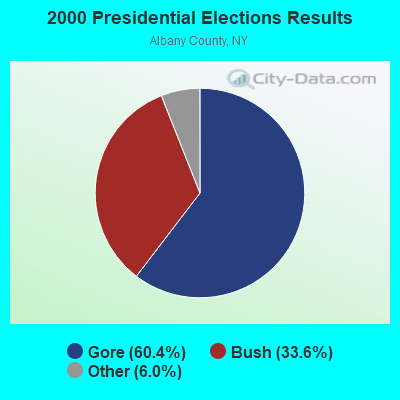
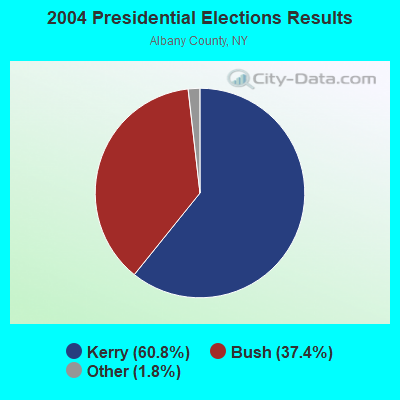
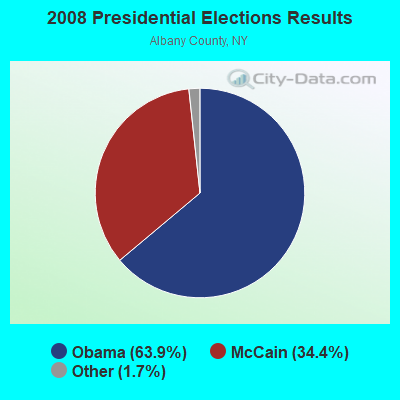
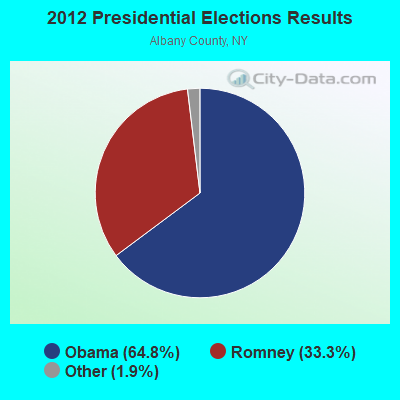
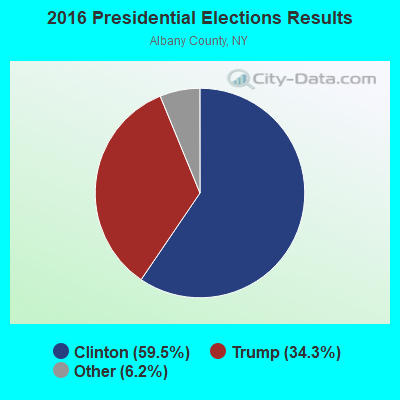
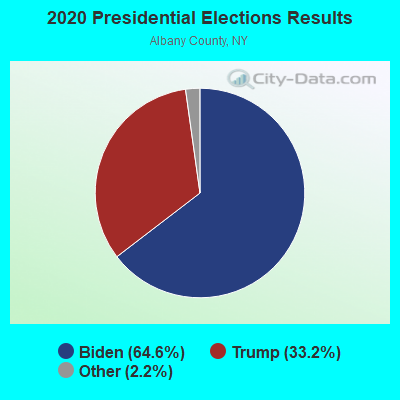
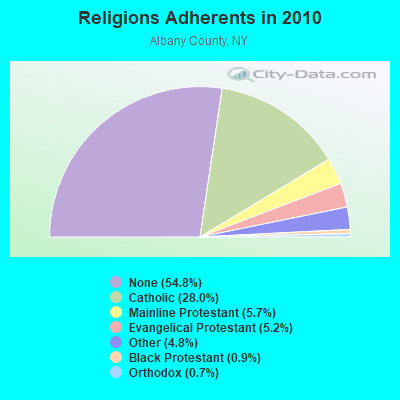
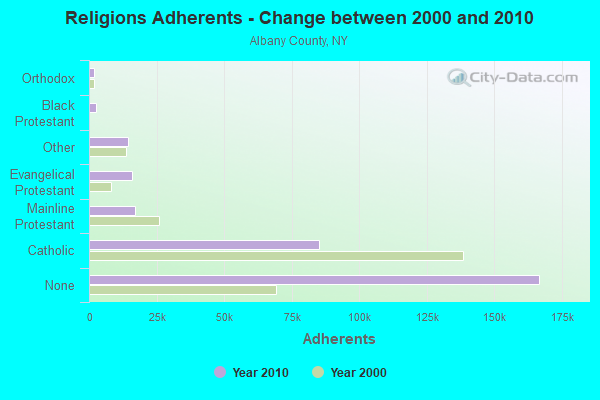
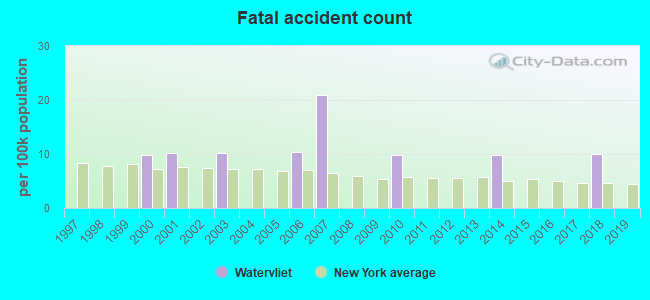
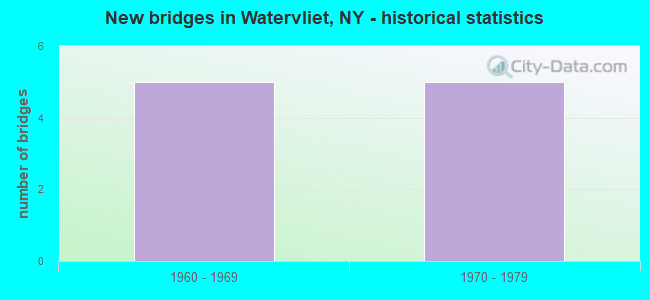
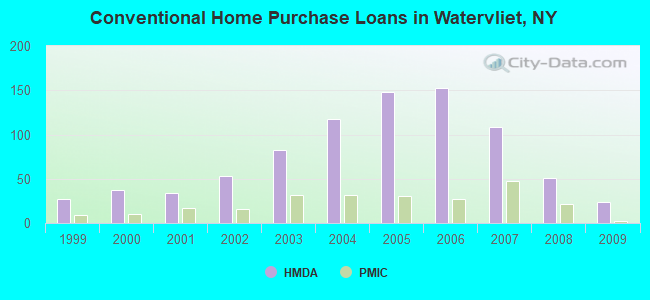
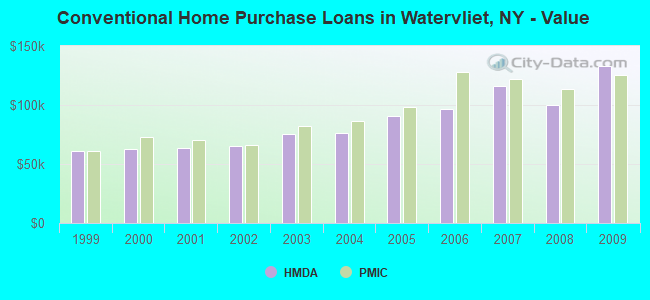
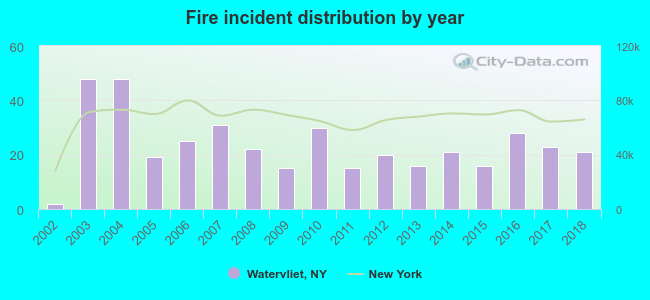 According to the data from the years 2002 - 2018 the average number of fire incidents per year is 24. The highest number of reported fires - 48 took place in 2003, and the least - 2 in 2002. The data has a rising trend.
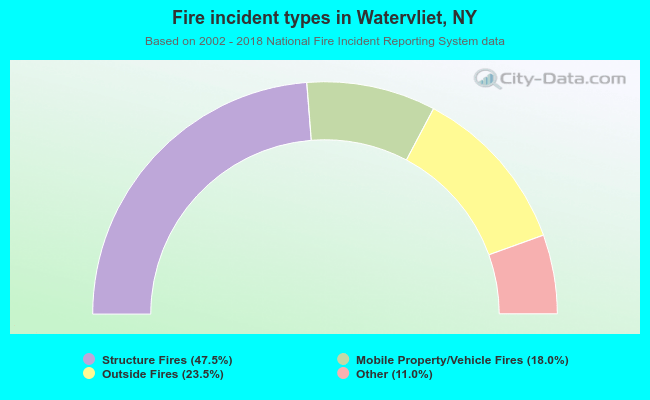 When looking into fire subcategories, the most incidents belonged to: Structure Fires (47.5%), and Outside Fires (23.5%).