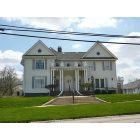
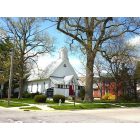
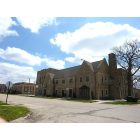
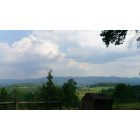
Kewanee, Illinois Submit your own pictures of this city and show them to the world
OSM Map
General Map
Google Map
MSN Map
OSM Map
General Map
Google Map
MSN Map
OSM Map
General Map
Google Map
MSN Map
OSM Map
General Map
Google Map
MSN Map
Please wait while loading the map...
Population in 2022: 12,229 (99% urban, 1% rural). Population change since 2000: -5.5%Males: 6,073 Females: 6,156
March 2022 cost of living index in Kewanee: 83.5 (less than average, U.S. average is 100) Percentage of residents living in poverty in 2022: 20.0%for White Non-Hispanic residents , 19.4% for Black residents , 32.1% for Hispanic or Latino residents , 26.3% for other race residents , 23.0% for two or more races residents )
Profiles of local businesses
Business Search - 14 Million verified businesses
Data:
Median household income ($)
Median household income (% change since 2000)
Household income diversity
Ratio of average income to average house value (%)
Ratio of average income to average rent
Median household income ($) - White
Median household income ($) - Black or African American
Median household income ($) - Asian
Median household income ($) - Hispanic or Latino
Median household income ($) - American Indian and Alaska Native
Median household income ($) - Multirace
Median household income ($) - Other Race
Median household income for houses/condos with a mortgage ($)
Median household income for apartments without a mortgage ($)
Races - White alone (%)
Races - White alone (% change since 2000)
Races - Black alone (%)
Races - Black alone (% change since 2000)
Races - American Indian alone (%)
Races - American Indian alone (% change since 2000)
Races - Asian alone (%)
Races - Asian alone (% change since 2000)
Races - Hispanic (%)
Races - Hispanic (% change since 2000)
Races - Native Hawaiian and Other Pacific Islander alone (%)
Races - Native Hawaiian and Other Pacific Islander alone (% change since 2000)
Races - Two or more races (%)
Races - Two or more races (% change since 2000)
Races - Other race alone (%)
Races - Other race alone (% change since 2000)
Racial diversity
Unemployment (%)
Unemployment (% change since 2000)
Unemployment (%) - White
Unemployment (%) - Black or African American
Unemployment (%) - Asian
Unemployment (%) - Hispanic or Latino
Unemployment (%) - American Indian and Alaska Native
Unemployment (%) - Multirace
Unemployment (%) - Other Race
Population density (people per square mile)
Population - Males (%)
Population - Females (%)
Population - Males (%) - White
Population - Males (%) - Black or African American
Population - Males (%) - Asian
Population - Males (%) - Hispanic or Latino
Population - Males (%) - American Indian and Alaska Native
Population - Males (%) - Multirace
Population - Males (%) - Other Race
Population - Females (%) - White
Population - Females (%) - Black or African American
Population - Females (%) - Asian
Population - Females (%) - Hispanic or Latino
Population - Females (%) - American Indian and Alaska Native
Population - Females (%) - Multirace
Population - Females (%) - Other Race
Coronavirus confirmed cases (Jun 08, 2024)
Deaths caused by coronavirus (Jun 08, 2024)
Coronavirus confirmed cases (per 100k population) (Jun 08, 2024)
Deaths caused by coronavirus (per 100k population) (Jun 08, 2024)
Daily increase in number of cases (Jun 08, 2024)
Weekly increase in number of cases (Jun 08, 2024)
Cases doubled (in days) (Jun 08, 2024)
Hospitalized patients (Apr 18, 2022)
Negative test results (Apr 18, 2022)
Total test results (Apr 18, 2022)
COVID Vaccine doses distributed (per 100k population) (Sep 19, 2023)
COVID Vaccine doses administered (per 100k population) (Sep 19, 2023)
COVID Vaccine doses distributed (Sep 19, 2023)
COVID Vaccine doses administered (Sep 19, 2023)
Likely homosexual households (%)
Likely homosexual households (% change since 2000)
Likely homosexual households - Lesbian couples (%)
Likely homosexual households - Lesbian couples (% change since 2000)
Likely homosexual households - Gay men (%)
Likely homosexual households - Gay men (% change since 2000)
Cost of living index
Median gross rent ($)
Median contract rent ($)
Median monthly housing costs ($)
Median house or condo value ($)
Median house or condo value ($ change since 2000)
Mean house or condo value by units in structure - 1, detached ($)
Mean house or condo value by units in structure - 1, attached ($)
Mean house or condo value by units in structure - 2 ($)
Mean house or condo value by units in structure by units in structure - 3 or 4 ($)
Mean house or condo value by units in structure - 5 or more ($)
Mean house or condo value by units in structure - Boat, RV, van, etc. ($)
Mean house or condo value by units in structure - Mobile home ($)
Median house or condo value ($) - White
Median house or condo value ($) - Black or African American
Median house or condo value ($) - Asian
Median house or condo value ($) - Hispanic or Latino
Median house or condo value ($) - American Indian and Alaska Native
Median house or condo value ($) - Multirace
Median house or condo value ($) - Other Race
Median resident age
Resident age diversity
Median resident age - Males
Median resident age - Females
Median resident age - White
Median resident age - Black or African American
Median resident age - Asian
Median resident age - Hispanic or Latino
Median resident age - American Indian and Alaska Native
Median resident age - Multirace
Median resident age - Other Race
Median resident age - Males - White
Median resident age - Males - Black or African American
Median resident age - Males - Asian
Median resident age - Males - Hispanic or Latino
Median resident age - Males - American Indian and Alaska Native
Median resident age - Males - Multirace
Median resident age - Males - Other Race
Median resident age - Females - White
Median resident age - Females - Black or African American
Median resident age - Females - Asian
Median resident age - Females - Hispanic or Latino
Median resident age - Females - American Indian and Alaska Native
Median resident age - Females - Multirace
Median resident age - Females - Other Race
Commute - mean travel time to work (minutes)
Travel time to work - Less than 5 minutes (%)
Travel time to work - Less than 5 minutes (% change since 2000)
Travel time to work - 5 to 9 minutes (%)
Travel time to work - 5 to 9 minutes (% change since 2000)
Travel time to work - 10 to 19 minutes (%)
Travel time to work - 10 to 19 minutes (% change since 2000)
Travel time to work - 20 to 29 minutes (%)
Travel time to work - 20 to 29 minutes (% change since 2000)
Travel time to work - 30 to 39 minutes (%)
Travel time to work - 30 to 39 minutes (% change since 2000)
Travel time to work - 40 to 59 minutes (%)
Travel time to work - 40 to 59 minutes (% change since 2000)
Travel time to work - 60 to 89 minutes (%)
Travel time to work - 60 to 89 minutes (% change since 2000)
Travel time to work - 90 or more minutes (%)
Travel time to work - 90 or more minutes (% change since 2000)
Marital status - Never married (%)
Marital status - Now married (%)
Marital status - Separated (%)
Marital status - Widowed (%)
Marital status - Divorced (%)
Median family income ($)
Median family income (% change since 2000)
Median non-family income ($)
Median non-family income (% change since 2000)
Median per capita income ($)
Median per capita income (% change since 2000)
Median family income ($) - White
Median family income ($) - Black or African American
Median family income ($) - Asian
Median family income ($) - Hispanic or Latino
Median family income ($) - American Indian and Alaska Native
Median family income ($) - Multirace
Median family income ($) - Other Race
Median year house/condo built
Median year apartment built
Year house built - Built 2005 or later (%)
Year house built - Built 2000 to 2004 (%)
Year house built - Built 1990 to 1999 (%)
Year house built - Built 1980 to 1989 (%)
Year house built - Built 1970 to 1979 (%)
Year house built - Built 1960 to 1969 (%)
Year house built - Built 1950 to 1959 (%)
Year house built - Built 1940 to 1949 (%)
Year house built - Built 1939 or earlier (%)
Average household size
Household density (households per square mile)
Average household size - White
Average household size - Black or African American
Average household size - Asian
Average household size - Hispanic or Latino
Average household size - American Indian and Alaska Native
Average household size - Multirace
Average household size - Other Race
Occupied housing units (%)
Vacant housing units (%)
Owner occupied housing units (%)
Renter occupied housing units (%)
Vacancy status - For rent (%)
Vacancy status - For sale only (%)
Vacancy status - Rented or sold, not occupied (%)
Vacancy status - For seasonal, recreational, or occasional use (%)
Vacancy status - For migrant workers (%)
Vacancy status - Other vacant (%)
Residents with income below the poverty level (%)
Residents with income below 50% of the poverty level (%)
Children below poverty level (%)
Poor families by family type - Married-couple family (%)
Poor families by family type - Male, no wife present (%)
Poor families by family type - Female, no husband present (%)
Poverty status for native-born residents (%)
Poverty status for foreign-born residents (%)
Poverty among high school graduates not in families (%)
Poverty among people who did not graduate high school not in families (%)
Residents with income below the poverty level (%) - White
Residents with income below the poverty level (%) - Black or African American
Residents with income below the poverty level (%) - Asian
Residents with income below the poverty level (%) - Hispanic or Latino
Residents with income below the poverty level (%) - American Indian and Alaska Native
Residents with income below the poverty level (%) - Multirace
Residents with income below the poverty level (%) - Other Race
Air pollution - Air Quality Index (AQI)
Air pollution - CO
Air pollution - NO2
Air pollution - SO2
Air pollution - Ozone
Air pollution - PM10
Air pollution - PM25
Air pollution - Pb
Crime - Murders per 100,000 population
Crime - Rapes per 100,000 population
Crime - Robberies per 100,000 population
Crime - Assaults per 100,000 population
Crime - Burglaries per 100,000 population
Crime - Thefts per 100,000 population
Crime - Auto thefts per 100,000 population
Crime - Arson per 100,000 population
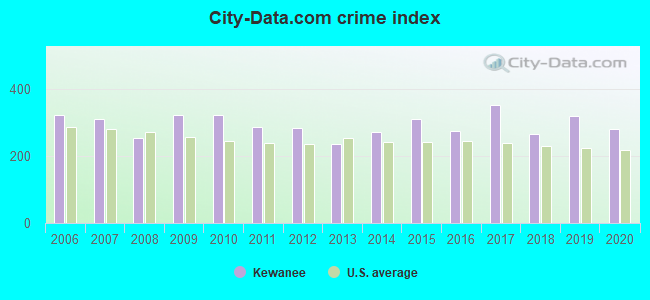
Crime - City-data.com crime index
Crime - Violent crime index
Crime - Property crime index
Crime - Murders per 100,000 population (5 year average)
Crime - Rapes per 100,000 population (5 year average)
Crime - Robberies per 100,000 population (5 year average)
Crime - Assaults per 100,000 population (5 year average)
Crime - Burglaries per 100,000 population (5 year average)
Crime - Thefts per 100,000 population (5 year average)
Crime - Auto thefts per 100,000 population (5 year average)
Crime - Arson per 100,000 population (5 year average)
Crime - City-data.com crime index (5 year average)
Crime - Violent crime index (5 year average)
Crime - Property crime index (5 year average)
1996 Presidential Elections Results (%) - Democratic Party (Clinton)
1996 Presidential Elections Results (%) - Republican Party (Dole)
1996 Presidential Elections Results (%) - Other
2000 Presidential Elections Results (%) - Democratic Party (Gore)
2000 Presidential Elections Results (%) - Republican Party (Bush)
2000 Presidential Elections Results (%) - Other
2004 Presidential Elections Results (%) - Democratic Party (Kerry)
2004 Presidential Elections Results (%) - Republican Party (Bush)
2004 Presidential Elections Results (%) - Other
2008 Presidential Elections Results (%) - Democratic Party (Obama)
2008 Presidential Elections Results (%) - Republican Party (McCain)
2008 Presidential Elections Results (%) - Other
2012 Presidential Elections Results (%) - Democratic Party (Obama)
2012 Presidential Elections Results (%) - Republican Party (Romney)
2012 Presidential Elections Results (%) - Other
2016 Presidential Elections Results (%) - Democratic Party (Clinton)
2016 Presidential Elections Results (%) - Republican Party (Trump)
2016 Presidential Elections Results (%) - Other
2020 Presidential Elections Results (%) - Democratic Party (Biden)
2020 Presidential Elections Results (%) - Republican Party (Trump)
2020 Presidential Elections Results (%) - Other
Ancestries Reported - Arab (%)
Ancestries Reported - Czech (%)
Ancestries Reported - Danish (%)
Ancestries Reported - Dutch (%)
Ancestries Reported - English (%)
Ancestries Reported - French (%)
Ancestries Reported - French Canadian (%)
Ancestries Reported - German (%)
Ancestries Reported - Greek (%)
Ancestries Reported - Hungarian (%)
Ancestries Reported - Irish (%)
Ancestries Reported - Italian (%)
Ancestries Reported - Lithuanian (%)
Ancestries Reported - Norwegian (%)
Ancestries Reported - Polish (%)
Ancestries Reported - Portuguese (%)
Ancestries Reported - Russian (%)
Ancestries Reported - Scotch-Irish (%)
Ancestries Reported - Scottish (%)
Ancestries Reported - Slovak (%)
Ancestries Reported - Subsaharan African (%)
Ancestries Reported - Swedish (%)
Ancestries Reported - Swiss (%)
Ancestries Reported - Ukrainian (%)
Ancestries Reported - United States (%)
Ancestries Reported - Welsh (%)
Ancestries Reported - West Indian (%)
Ancestries Reported - Other (%)
Educational Attainment - No schooling completed (%)
Educational Attainment - Less than high school (%)
Educational Attainment - High school or equivalent (%)
Educational Attainment - Less than 1 year of college (%)
Educational Attainment - 1 or more years of college (%)
Educational Attainment - Associate degree (%)
Educational Attainment - Bachelor's degree (%)
Educational Attainment - Master's degree (%)
Educational Attainment - Professional school degree (%)
Educational Attainment - Doctorate degree (%)
School Enrollment - Nursery, preschool (%)
School Enrollment - Kindergarten (%)
School Enrollment - Grade 1 to 4 (%)
School Enrollment - Grade 5 to 8 (%)
School Enrollment - Grade 9 to 12 (%)
School Enrollment - College undergrad (%)
School Enrollment - Graduate or professional (%)
School Enrollment - Not enrolled in school (%)
School enrollment - Public schools (%)
School enrollment - Private schools (%)
School enrollment - Not enrolled (%)
Median number of rooms in houses and condos
Median number of rooms in apartments
Housing units lacking complete plumbing facilities (%)
Housing units lacking complete kitchen facilities (%)
Density of houses
Urban houses (%)
Rural houses (%)
Households with people 60 years and over (%)
Households with people 65 years and over (%)
Households with people 75 years and over (%)
Households with one or more nonrelatives (%)
Households with no nonrelatives (%)
Population in households (%)
Family households (%)
Nonfamily households (%)
Population in families (%)
Family households with own children (%)
Median number of bedrooms in owner occupied houses
Mean number of bedrooms in owner occupied houses
Median number of bedrooms in renter occupied houses
Mean number of bedrooms in renter occupied houses
Median number of vehichles in owner occupied houses
Mean number of vehichles in owner occupied houses
Median number of vehichles in renter occupied houses
Mean number of vehichles in renter occupied houses
Mortgage status - with mortgage (%)
Mortgage status - with second mortgage (%)
Mortgage status - with home equity loan (%)
Mortgage status - with both second mortgage and home equity loan (%)
Mortgage status - without a mortgage (%)
Average family size
Average family size - White
Average family size - Black or African American
Average family size - Asian
Average family size - Hispanic or Latino
Average family size - American Indian and Alaska Native
Average family size - Multirace
Average family size - Other Race
Geographical mobility - Same house 1 year ago (%)
Geographical mobility - Moved within same county (%)
Geographical mobility - Moved from different county within same state (%)
Geographical mobility - Moved from different state (%)
Geographical mobility - Moved from abroad (%)
Place of birth - Born in state of residence (%)
Place of birth - Born in other state (%)
Place of birth - Native, outside of US (%)
Place of birth - Foreign born (%)
Housing units in structures - 1, detached (%)
Housing units in structures - 1, attached (%)
Housing units in structures - 2 (%)
Housing units in structures - 3 or 4 (%)
Housing units in structures - 5 to 9 (%)
Housing units in structures - 10 to 19 (%)
Housing units in structures - 20 to 49 (%)
Housing units in structures - 50 or more (%)
Housing units in structures - Mobile home (%)
Housing units in structures - Boat, RV, van, etc. (%)
House/condo owner moved in on average (years ago)
Renter moved in on average (years ago)
Year householder moved into unit - Moved in 1999 to March 2000 (%)
Year householder moved into unit - Moved in 1995 to 1998 (%)
Year householder moved into unit - Moved in 1990 to 1994 (%)
Year householder moved into unit - Moved in 1980 to 1989 (%)
Year householder moved into unit - Moved in 1970 to 1979 (%)
Year householder moved into unit - Moved in 1969 or earlier (%)
Means of transportation to work - Drove car alone (%)
Means of transportation to work - Carpooled (%)
Means of transportation to work - Public transportation (%)
Means of transportation to work - Bus or trolley bus (%)
Means of transportation to work - Streetcar or trolley car (%)
Means of transportation to work - Subway or elevated (%)
Means of transportation to work - Railroad (%)
Means of transportation to work - Ferryboat (%)
Means of transportation to work - Taxicab (%)
Means of transportation to work - Motorcycle (%)
Means of transportation to work - Bicycle (%)
Means of transportation to work - Walked (%)
Means of transportation to work - Other means (%)
Working at home (%)
Industry diversity
Most Common Industries - Agriculture, forestry, fishing and hunting, and mining (%)
Most Common Industries - Agriculture, forestry, fishing and hunting (%)
Most Common Industries - Mining, quarrying, and oil and gas extraction (%)
Most Common Industries - Construction (%)
Most Common Industries - Manufacturing (%)
Most Common Industries - Wholesale trade (%)
Most Common Industries - Retail trade (%)
Most Common Industries - Transportation and warehousing, and utilities (%)
Most Common Industries - Transportation and warehousing (%)
Most Common Industries - Utilities (%)
Most Common Industries - Information (%)
Most Common Industries - Finance and insurance, and real estate and rental and leasing (%)
Most Common Industries - Finance and insurance (%)
Most Common Industries - Real estate and rental and leasing (%)
Most Common Industries - Professional, scientific, and management, and administrative and waste management services (%)
Most Common Industries - Professional, scientific, and technical services (%)
Most Common Industries - Management of companies and enterprises (%)
Most Common Industries - Administrative and support and waste management services (%)
Most Common Industries - Educational services, and health care and social assistance (%)
Most Common Industries - Educational services (%)
Most Common Industries - Health care and social assistance (%)
Most Common Industries - Arts, entertainment, and recreation, and accommodation and food services (%)
Most Common Industries - Arts, entertainment, and recreation (%)
Most Common Industries - Accommodation and food services (%)
Most Common Industries - Other services, except public administration (%)
Most Common Industries - Public administration (%)
Occupation diversity
Most Common Occupations - Management, business, science, and arts occupations (%)
Most Common Occupations - Management, business, and financial occupations (%)
Most Common Occupations - Management occupations (%)
Most Common Occupations - Business and financial operations occupations (%)
Most Common Occupations - Computer, engineering, and science occupations (%)
Most Common Occupations - Computer and mathematical occupations (%)
Most Common Occupations - Architecture and engineering occupations (%)
Most Common Occupations - Life, physical, and social science occupations (%)
Most Common Occupations - Education, legal, community service, arts, and media occupations (%)
Most Common Occupations - Community and social service occupations (%)
Most Common Occupations - Legal occupations (%)
Most Common Occupations - Education, training, and library occupations (%)
Most Common Occupations - Arts, design, entertainment, sports, and media occupations (%)
Most Common Occupations - Healthcare practitioners and technical occupations (%)
Most Common Occupations - Health diagnosing and treating practitioners and other technical occupations (%)
Most Common Occupations - Health technologists and technicians (%)
Most Common Occupations - Service occupations (%)
Most Common Occupations - Healthcare support occupations (%)
Most Common Occupations - Protective service occupations (%)
Most Common Occupations - Fire fighting and prevention, and other protective service workers including supervisors (%)
Most Common Occupations - Law enforcement workers including supervisors (%)
Most Common Occupations - Food preparation and serving related occupations (%)
Most Common Occupations - Building and grounds cleaning and maintenance occupations (%)
Most Common Occupations - Personal care and service occupations (%)
Most Common Occupations - Sales and office occupations (%)
Most Common Occupations - Sales and related occupations (%)
Most Common Occupations - Office and administrative support occupations (%)
Most Common Occupations - Natural resources, construction, and maintenance occupations (%)
Most Common Occupations - Farming, fishing, and forestry occupations (%)
Most Common Occupations - Construction and extraction occupations (%)
Most Common Occupations - Installation, maintenance, and repair occupations (%)
Most Common Occupations - Production, transportation, and material moving occupations (%)
Most Common Occupations - Production occupations (%)
Most Common Occupations - Transportation occupations (%)
Most Common Occupations - Material moving occupations (%)
People in Group quarters - Institutionalized population (%)
People in Group quarters - Correctional institutions (%)
People in Group quarters - Federal prisons and detention centers (%)
People in Group quarters - Halfway houses (%)
People in Group quarters - Local jails and other confinement facilities (including police lockups) (%)
People in Group quarters - Military disciplinary barracks (%)
People in Group quarters - State prisons (%)
People in Group quarters - Other types of correctional institutions (%)
People in Group quarters - Nursing homes (%)
People in Group quarters - Hospitals/wards, hospices, and schools for the handicapped (%)
People in Group quarters - Hospitals/wards and hospices for chronically ill (%)
People in Group quarters - Hospices or homes for chronically ill (%)
People in Group quarters - Military hospitals or wards for chronically ill (%)
People in Group quarters - Other hospitals or wards for chronically ill (%)
People in Group quarters - Hospitals or wards for drug/alcohol abuse (%)
People in Group quarters - Mental (Psychiatric) hospitals or wards (%)
People in Group quarters - Schools, hospitals, or wards for the mentally retarded (%)
People in Group quarters - Schools, hospitals, or wards for the physically handicapped (%)
People in Group quarters - Institutions for the deaf (%)
People in Group quarters - Institutions for the blind (%)
People in Group quarters - Orthopedic wards and institutions for the physically handicapped (%)
People in Group quarters - Wards in general hospitals for patients who have no usual home elsewhere (%)
People in Group quarters - Wards in military hospitals for patients who have no usual home elsewhere (%)
People in Group quarters - Juvenile institutions (%)
People in Group quarters - Long-term care (%)
People in Group quarters - Homes for abused, dependent, and neglected children (%)
People in Group quarters - Residential treatment centers for emotionally disturbed children (%)
People in Group quarters - Training schools for juvenile delinquents (%)
People in Group quarters - Short-term care, detention or diagnostic centers for delinquent children (%)
People in Group quarters - Type of juvenile institution unknown (%)
People in Group quarters - Noninstitutionalized population (%)
People in Group quarters - College dormitories (includes college quarters off campus) (%)
People in Group quarters - Military quarters (%)
People in Group quarters - On base (%)
People in Group quarters - Barracks, unaccompanied personnel housing (UPH), (Enlisted/Officer), ;and similar group living quarters for military personnel (%)
People in Group quarters - Transient quarters for temporary residents (%)
People in Group quarters - Military ships (%)
People in Group quarters - Group homes (%)
People in Group quarters - Homes or halfway houses for drug/alcohol abuse (%)
People in Group quarters - Homes for the mentally ill (%)
People in Group quarters - Homes for the mentally retarded (%)
People in Group quarters - Homes for the physically handicapped (%)
People in Group quarters - Other group homes (%)
People in Group quarters - Religious group quarters (%)
People in Group quarters - Dormitories (%)
People in Group quarters - Agriculture workers' dormitories on farms (%)
People in Group quarters - Job Corps and vocational training facilities (%)
People in Group quarters - Other workers' dormitories (%)
People in Group quarters - Crews of maritime vessels (%)
People in Group quarters - Other nonhousehold living situations (%)
People in Group quarters - Other noninstitutional group quarters (%)
Residents speaking English at home (%)
Residents speaking English at home - Born in the United States (%)
Residents speaking English at home - Native, born elsewhere (%)
Residents speaking English at home - Foreign born (%)
Residents speaking Spanish at home (%)
Residents speaking Spanish at home - Born in the United States (%)
Residents speaking Spanish at home - Native, born elsewhere (%)
Residents speaking Spanish at home - Foreign born (%)
Residents speaking other language at home (%)
Residents speaking other language at home - Born in the United States (%)
Residents speaking other language at home - Native, born elsewhere (%)
Residents speaking other language at home - Foreign born (%)
Class of Workers - Employee of private company (%)
Class of Workers - Self-employed in own incorporated business (%)
Class of Workers - Private not-for-profit wage and salary workers (%)
Class of Workers - Local government workers (%)
Class of Workers - State government workers (%)
Class of Workers - Federal government workers (%)
Class of Workers - Self-employed workers in own not incorporated business and Unpaid family workers (%)
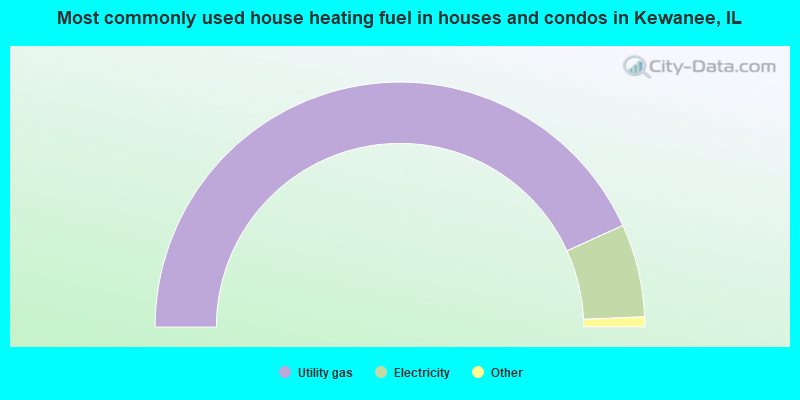
House heating fuel used in houses and condos - Utility gas (%)
House heating fuel used in houses and condos - Bottled, tank, or LP gas (%)
House heating fuel used in houses and condos - Electricity (%)
House heating fuel used in houses and condos - Fuel oil, kerosene, etc. (%)
House heating fuel used in houses and condos - Coal or coke (%)
House heating fuel used in houses and condos - Wood (%)
House heating fuel used in houses and condos - Solar energy (%)
House heating fuel used in houses and condos - Other fuel (%)
House heating fuel used in houses and condos - No fuel used (%)
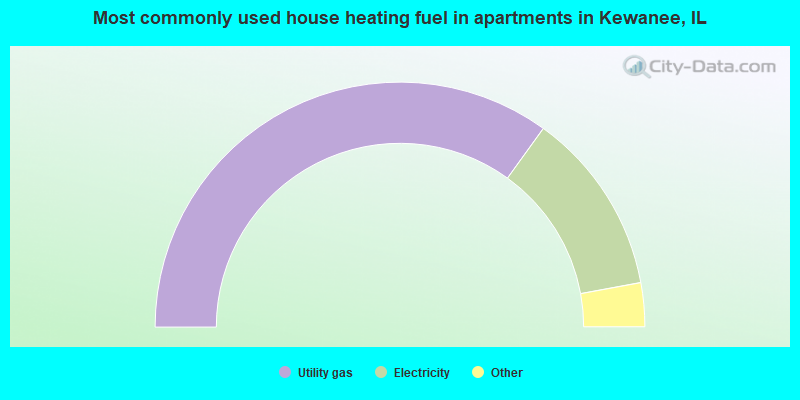
House heating fuel used in apartments - Utility gas (%)
House heating fuel used in apartments - Bottled, tank, or LP gas (%)
House heating fuel used in apartments - Electricity (%)
House heating fuel used in apartments - Fuel oil, kerosene, etc. (%)
House heating fuel used in apartments - Coal or coke (%)
House heating fuel used in apartments - Wood (%)
House heating fuel used in apartments - Solar energy (%)
House heating fuel used in apartments - Other fuel (%)
House heating fuel used in apartments - No fuel used (%)
Armed forces status - In Armed Forces (%)
Armed forces status - Civilian (%)
Armed forces status - Civilian - Veteran (%)
Armed forces status - Civilian - Nonveteran (%)
Fatal accidents locations in years 2005-2021
Fatal accidents locations in 2005
Fatal accidents locations in 2006
Fatal accidents locations in 2007
Fatal accidents locations in 2008
Fatal accidents locations in 2009
Fatal accidents locations in 2010
Fatal accidents locations in 2011
Fatal accidents locations in 2012
Fatal accidents locations in 2013
Fatal accidents locations in 2014
Fatal accidents locations in 2015
Fatal accidents locations in 2016
Fatal accidents locations in 2017
Fatal accidents locations in 2018
Fatal accidents locations in 2019
Fatal accidents locations in 2020
Fatal accidents locations in 2021
Alcohol use - People drinking some alcohol every month (%)
Alcohol use - People not drinking at all (%)
Alcohol use - Average days/month drinking alcohol
Alcohol use - Average drinks/week
Alcohol use - Average days/year people drink much
Audiometry - Average condition of hearing (%)
Audiometry - People that can hear a whisper from across a quiet room (%)
Audiometry - People that can hear normal voice from across a quiet room (%)
Audiometry - Ears ringing, roaring, buzzing (%)
Audiometry - Had a job exposure to loud noise (%)
Audiometry - Had off-work exposure to loud noise (%)
Blood Pressure & Cholesterol - Has high blood pressure (%)
Blood Pressure & Cholesterol - Checking blood pressure at home (%)
Blood Pressure & Cholesterol - Frequently checking blood cholesterol (%)
Blood Pressure & Cholesterol - Has high cholesterol level (%)
Consumer Behavior - Money monthly spent on food at supermarket/grocery store
Consumer Behavior - Money monthly spent on food at other stores
Consumer Behavior - Money monthly spent on eating out
Consumer Behavior - Money monthly spent on carryout/delivered foods
Consumer Behavior - Income spent on food at supermarket/grocery store (%)
Consumer Behavior - Income spent on food at other stores (%)
Consumer Behavior - Income spent on eating out (%)
Consumer Behavior - Income spent on carryout/delivered foods (%)
Current Health Status - General health condition (%)
Current Health Status - Blood donors (%)
Current Health Status - Has blood ever tested for HIV virus (%)
Current Health Status - Left-handed people (%)
Dermatology - People using sunscreen (%)
Diabetes - Diabetics (%)
Diabetes - Had a blood test for high blood sugar (%)
Diabetes - People taking insulin (%)
Diet Behavior & Nutrition - Diet health (%)
Diet Behavior & Nutrition - Milk product consumption (# of products/month)
Diet Behavior & Nutrition - Meals not home prepared (#/week)
Diet Behavior & Nutrition - Meals from fast food or pizza place (#/week)
Diet Behavior & Nutrition - Ready-to-eat foods (#/month)
Diet Behavior & Nutrition - Frozen meals/pizza (#/month)
Drug Use - People that ever used marijuana or hashish (%)
Drug Use - Ever used hard drugs (%)
Drug Use - Ever used any form of cocaine (%)
Drug Use - Ever used heroin (%)
Drug Use - Ever used methamphetamine (%)
Health Insurance - People covered by health insurance (%)
Kidney Conditions-Urology - Avg. # of times urinating at night
Medical Conditions - People with asthma (%)
Medical Conditions - People with anemia (%)
Medical Conditions - People with psoriasis (%)
Medical Conditions - People with overweight (%)
Medical Conditions - Elderly people having difficulties in thinking or remembering (%)
Medical Conditions - People who ever received blood transfusion (%)
Medical Conditions - People having trouble seeing even with glass/contacts (%)
Medical Conditions - People with arthritis (%)
Medical Conditions - People with gout (%)
Medical Conditions - People with congestive heart failure (%)
Medical Conditions - People with coronary heart disease (%)
Medical Conditions - People with angina pectoris (%)
Medical Conditions - People who ever had heart attack (%)
Medical Conditions - People who ever had stroke (%)
Medical Conditions - People with emphysema (%)
Medical Conditions - People with thyroid problem (%)
Medical Conditions - People with chronic bronchitis (%)
Medical Conditions - People with any liver condition (%)
Medical Conditions - People who ever had cancer or malignancy (%)
Mental Health - People who have little interest in doing things (%)
Mental Health - People feeling down, depressed, or hopeless (%)
Mental Health - People who have trouble sleeping or sleeping too much (%)
Mental Health - People feeling tired or having little energy (%)
Mental Health - People with poor appetite or overeating (%)
Mental Health - People feeling bad about themself (%)
Mental Health - People who have trouble concentrating on things (%)
Mental Health - People moving or speaking slowly or too fast (%)
Mental Health - People having thoughts they would be better off dead (%)
Oral Health - Average years since last visit a dentist
Oral Health - People embarrassed because of mouth (%)
Oral Health - People with gum disease (%)
Oral Health - General health of teeth and gums (%)
Oral Health - Average days a week using dental floss/device
Oral Health - Average days a week using mouthwash for dental problem
Oral Health - Average number of teeth
Pesticide Use - Households using pesticides to control insects (%)
Pesticide Use - Households using pesticides to kill weeds (%)
Physical Activity - People doing vigorous-intensity work activities (%)
Physical Activity - People doing moderate-intensity work activities (%)
Physical Activity - People walking or bicycling (%)
Physical Activity - People doing vigorous-intensity recreational activities (%)
Physical Activity - People doing moderate-intensity recreational activities (%)
Physical Activity - Average hours a day doing sedentary activities
Physical Activity - Average hours a day watching TV or videos
Physical Activity - Average hours a day using computer
Physical Functioning - People having limitations keeping them from working (%)
Physical Functioning - People limited in amount of work they can do (%)
Physical Functioning - People that need special equipment to walk (%)
Physical Functioning - People experiencing confusion/memory problems (%)
Physical Functioning - People requiring special healthcare equipment (%)
Prescription Medications - Average number of prescription medicines taking
Preventive Aspirin Use - Adults 40+ taking low-dose aspirin (%)
Reproductive Health - Vaginal deliveries (%)
Reproductive Health - Cesarean deliveries (%)
Reproductive Health - Deliveries resulted in a live birth (%)
Reproductive Health - Pregnancies resulted in a delivery (%)
Reproductive Health - Women breastfeeding newborns (%)
Reproductive Health - Women that had a hysterectomy (%)
Reproductive Health - Women that had both ovaries removed (%)
Reproductive Health - Women that have ever taken birth control pills (%)
Reproductive Health - Women taking birth control pills (%)
Reproductive Health - Women that have ever used Depo-Provera or injectables (%)
Reproductive Health - Women that have ever used female hormones (%)
Sexual Behavior - People 18+ that ever had sex (vaginal, anal, or oral) (%)
Sexual Behavior - Males 18+ that ever had vaginal sex with a woman (%)
Sexual Behavior - Males 18+ that ever performed oral sex on a woman (%)
Sexual Behavior - Males 18+ that ever had anal sex with a woman (%)
Sexual Behavior - Males 18+ that ever had any sex with a man (%)
Sexual Behavior - Females 18+ that ever had vaginal sex with a man (%)
Sexual Behavior - Females 18+ that ever performed oral sex on a man (%)
Sexual Behavior - Females 18+ that ever had anal sex with a man (%)
Sexual Behavior - Females 18+ that ever had any kind of sex with a woman (%)
Sexual Behavior - Average age people first had sex
Sexual Behavior - Average number of female sex partners in lifetime (males 18+)
Sexual Behavior - Average number of female vaginal sex partners in lifetime (males 18+)
Sexual Behavior - Average age people first performed oral sex on a woman (18+)
Sexual Behavior - Average number of woman performed oral sex on in lifetime (18+)
Sexual Behavior - Average number of male sex partners in lifetime (males 18+)
Sexual Behavior - Average number of male anal sex partners in lifetime (males 18+)
Sexual Behavior - Average age people first performed oral sex on a man (18+)
Sexual Behavior - Average number of male oral sex partners in lifetime (18+)
Sexual Behavior - People using protection when performing oral sex (%)
Sexual Behavior - Average number of times people have vaginal or anal sex a year
Sexual Behavior - People having sex without condom (%)
Sexual Behavior - Average number of male sex partners in lifetime (females 18+)
Sexual Behavior - Average number of male vaginal sex partners in lifetime (females 18+)
Sexual Behavior - Average number of female sex partners in lifetime (females 18+)
Sexual Behavior - Circumcised males 18+ (%)
Sleep Disorders - Average hours sleeping at night
Sleep Disorders - People that has trouble sleeping (%)
Smoking-Cigarette Use - People smoking cigarettes (%)
Taste & Smell - People 40+ having problems with smell (%)
Taste & Smell - People 40+ having problems with taste (%)
Taste & Smell - People 40+ that ever had wisdom teeth removed (%)
Taste & Smell - People 40+ that ever had tonsils teeth removed (%)
Taste & Smell - People 40+ that ever had a loss of consciousness because of a head injury (%)
Taste & Smell - People 40+ that ever had a broken nose or other serious injury to face or skull (%)
Taste & Smell - People 40+ that ever had two or more sinus infections (%)
Weight - Average height (inches)
Weight - Average weight (pounds)
Weight - Average BMI
Weight - People that are obese (%)
Weight - People that ever were obese (%)
Weight - People trying to lose weight (%)
Officers per 1,000 residents here:
1.70Illinois average:
3.15
Latest news from Kewanee, IL collected exclusively by city-data.com from local newspapers, TV, and radio stations
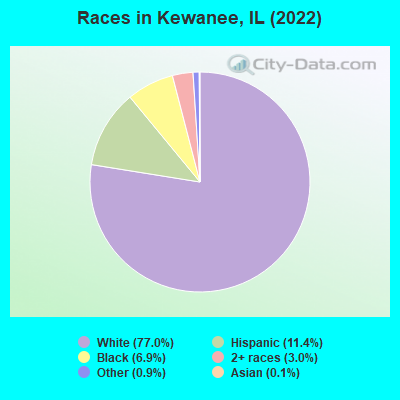
Ancestries: German (12.1%), Irish (11.4%), English (10.7%), American (9.4%), European (4.6%), Polish (3.2%).
Current Local Time:
Incorporated on 11/02/1872
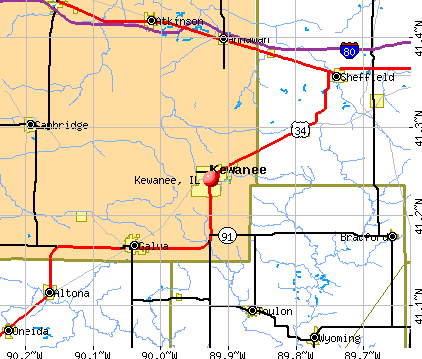
Land area: 6.28 square miles.
Population density: 1,948 people per square mile (low).
425 residents are foreign born (3.0% Latin America ).
This city:
3.5%Illinois:
14.1%
Median real estate property taxes paid for housing units with mortgages in 2022: $1,510 (1.9%)Median real estate property taxes paid for housing units with no mortgage in 2022: $1,112 (1.8%)
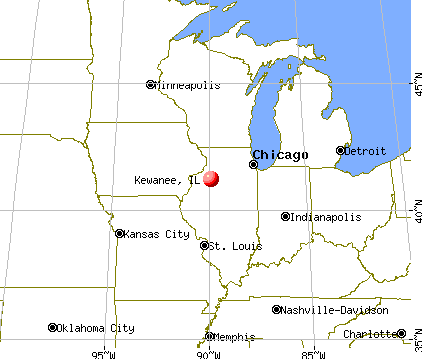
Nearest city with pop. 50,000+: Peoria, IL
Nearest city with pop. 200,000+: Chicago, IL
Nearest cities:
Bishop Hill, IL (3.2 miles),
Latitude: 41.24 N, Longitude: 89.93 W
Nickname or alias (official or unofficial): Hog Capital of the World
Daytime population change due to commuting: -508 (-4.2%)Workers who live and work in this city: 2,662 (56.7%)
Single-family new house construction building permits:
2022: 1 building , cost: $351,7002019: 1 building , cost: $296,9002018: 2 buildings , average cost: $179,8002017: 3 buildings , average cost: $299,2002016: 3 buildings , average cost: $125,8002015: 1 building , cost: $135,0002014: 3 buildings , average cost: $279,8002013: 2 buildings , average cost: $191,0002012: 3 buildings , average cost: $157,9002011: 1 building , cost: $208,8002010: 4 buildings , average cost: $243,0002009: 6 buildings , average cost: $171,7002008: 6 buildings , average cost: $149,9002007: 7 buildings , average cost: $132,1002006: 5 buildings , average cost: $162,0002005: 6 buildings , average cost: $118,5002004: 4 buildings , average cost: $92,3002003: 3 buildings , average cost: $136,1002002: 1 building , cost: $100,0002001: 4 buildings , average cost: $119,4002000: 10 buildings , average cost: $105,8001999: 19 buildings , average cost: $99,5001998: 16 buildings , average cost: $78,6001997: 4 buildings , average cost: $76,500Unemployment in December 2023:
Most common occupations in Kewanee, IL (%)
Both Males Females
Metal workers and plastic workers (4.9%)
Other sales and related occupations, including supervisors (4.6%)
Building and grounds cleaning and maintenance occupations (4.1%)
Laborers and material movers, hand (3.9%)
Material recording, scheduling, dispatching, and distributing workers (3.8%)
Other production occupations, including supervisors (3.5%)
Assemblers and fabricators (3.4%)
Metal workers and plastic workers (7.8%)
Laborers and material movers, hand (6.1%)
Driver/sales workers and truck drivers (5.3%)
Assemblers and fabricators (5.1%)
Other production occupations, including supervisors (4.9%)
Other sales and related occupations, including supervisors (4.3%)
Material recording, scheduling, dispatching, and distributing workers (4.2%)
Secretaries and administrative assistants (5.2%)
Waiters and waitresses (5.0%)
Other sales and related occupations, including supervisors (4.9%)
Building and grounds cleaning and maintenance occupations (4.8%)
Other office and administrative support workers, including supervisors (4.3%)
Nursing, psychiatric, and home health aides (4.1%)
Cooks and food preparation workers (4.1%)
Tornado activity:
Kewanee-area historical tornado activity is near Illinois state average. It is 68% greater than the overall U.S. average.
On 3/29/1981, a category F4 (max. wind speeds 207-260 mph) tornado 30.4 miles away from the Kewanee city center caused between $500,000 and $5,000,000 in damages.
On 5/9/1995, a category F3 (max. wind speeds 158-206 mph) tornado 7.7 miles away from the city center caused between $500,000 and $5,000,000 in damages.
Earthquake activity:
Kewanee-area historical earthquake activity is significantly above Illinois state average. It is 119% greater than the overall U.S. average. On 4/18/2008 at 09:36:59, a magnitude 5.4 (5.1 MB, 4.8 MS, 5.4 MW, 5.2 MW, Class: Moderate, Intensity: VI - VII) earthquake occurred 221.2 miles away from Kewanee center On 6/10/1987 at 23:48:54, a magnitude 5.1 (4.9 MB, 4.4 MS, 4.6 MS, 5.1 LG) earthquake occurred 199.2 miles away from Kewanee center On 4/18/2008 at 09:36:59, a magnitude 5.2 (5.2 MW, Depth: 8.9 mi) earthquake occurred 221.3 miles away from Kewanee center On 6/28/2004 at 06:10:52, a magnitude 4.2 (4.2 MW, Depth: 6.2 mi, Class: Light, Intensity: IV - V) earthquake occurred 55.4 miles away from the city center On 6/18/2002 at 17:37:15, a magnitude 5.0 (4.3 MB, 4.6 MW, 5.0 LG) earthquake occurred 252.4 miles away from Kewanee center On 4/18/2008 at 15:14:16, a magnitude 4.8 (4.5 MB, 4.8 MW, 4.6 MW) earthquake occurred 220.8 miles away from Kewanee center Magnitude types: regional Lg-wave magnitude (LG), body-wave magnitude (MB), surface-wave magnitude (MS), moment magnitude (MW) Natural disasters: The number of natural disasters in Henry County (14) is near the US average (15).Major Disasters (Presidential) Declared: 7Emergencies Declared: 5Storms: 8, Floods: 6, Snows: 2, Snowstorms: 2, Tornadoes: 2, Winter Storms: 2, Blizzard: 1, Hurricane: 1, Wind: 1, Other: 1 (Note: some incidents may be assigned to more than one category). Main business address for: BOSS HOLDINGS INC APPAREL & OTHER FINISHED PRODS OF FABRICS & SIMILAR MATERIAL ).
Hospitals and medical centers in Kewanee: KEWANEE HOSPITAL (Voluntary non-profit - Private, provides emergency services, 1051 WEST SOUTH STREET) KEWANEE HOSPITAL HOSPICE (125 N TREMONT ST, 2ND FLOOR) KEWANEE CARE HOME (144 JUNIOR AVENUE)
KEWANEE HOSPITAL ASSOC (719 ELLIOTT STREET)
ROYAL OAKS CARE CENTER (605 EAST CHURCH STREET, P O BOX 600)
FMC - MIDWEST - KEWANEE (230 WEST SOUTH ST.)
HENRY COUNTY HEALTH DEPARTMENT (4424 U.S. HIGHWAY 34)
Amtrak station: KEWANEE (3RD & DEPOT ST.)
.
Services: enclosed waiting area, public payphones, free short-term parking, free long-term parking, call for taxi service.
Colleges/universities with over 2000 students nearest to Kewanee:
Black Hawk College (about 32 miles; Moline, IL ; Full-time enrollment: 5,086)
Augustana College (about 38 miles; Rock Island, IL ; FT enrollment: 2,555)
Eastern Iowa Community College District (about 39 miles; Davenport, IA ; FT enrollment: 5,507)
Kaplan University-Davenport Campus (about 40 miles; Davenport, IA ; FT enrollment: 60,376)
Saint Ambrose University (about 40 miles; Davenport, IA ; FT enrollment: 3,053)
Bradley University (about 41 miles; Peoria, IL ; FT enrollment: 5,152)
Illinois Central College (about 43 miles; East Peoria, IL ; FT enrollment: 7,158)
Public high schools in Kewanee:
Public elementary/middle schools in Kewanee: WETHERSFIELD ELEM SCHOOL Students: 393, Location: 439 WILLARD ST, Grades: PK-6)CENTRAL JUNIOR HIGH Students: 247, Location: 215 E CENTRAL BLVD, Grades: 7-8)BELLE ALEXANDER ELEM SCHOOL Students: 229, Location: 1401 LAKE ST, Grades: KG-1)IRVING ELEM SCHOOL Location: 609 W CENTRAL BLVD, Grades: 2-3)
CENTRAL ELEM Location: 215 E CENTRAL BLVD, Grades: 4-6)
Private elementary/middle school in Kewanee: VISITATION CATHOLIC SCHOOL Students: 116, Location: 107 S LEXINGTON AVE, Grades: PK-8)
See full list of schools located in Kewanee Library in Kewanee: KEWANEE PUBLIC LIBRARY DISTRICT Operating income: $718,044; Location: 102 SOUTH TREMONT STREET; 68,450 books ; 5,345 audio materials ; 5,030 video materials ; 4 local licensed databases ; 14 state licensed databases ; 196 print serial subscriptions )
Notable locations in Kewanee: (A) , Kewanee City Hall (B) , Kewanee Ambulance Service (C) , Kewanee Community Fire Protection District (D) , Kewanee Fire Department (E) . Display/hide their locations on the map
Main business address in Kewanee: (A) . Display/hide its location on the map
Churches in Kewanee include: (A) , Bethel African Methodist Episcopal Church (B) , Bethel Church of God (C) , Christ Deliverance Church (D) , First Baptist Church (E) , First Christian Church (F) , First Church of Christ Scientist (G) , First Congregational Church (H) , First Presbyterian Church (I) . Display/hide their locations on the map
Cemeteries: (1) , Orthodox Cemetery (2) , Mount Olivet Cemetery (3) , Pleasant View Cemetery (4) , South Pleasant View Cemetery (5) , Wethersfield Cemetery (6) . Display/hide their locations on the map
Parks in Kewanee include: (1) , Windmont Park (2) , West Park (3) , McKinley Park (4) , Chautauqua Park (5) , Baker Park (6) , Northeast Park (7) . Display/hide their locations on the map
Hotels:
Court:
Birthplace of: Edward Robb Ellis - Journalist, Richard Estes - Artist, Gust E. Lundberg - Food industry businessman, Belden Hill - Baseball player, Don Peden - Football player and coach, Em Lindbeck - Baseball player, Glenn McDonald - Basketball player-coach.
Henry County has a predicted average indoor radon screening level greater than 4 pCi/L (pico curies per liter) - Highest Potential Drinking water stations with addresses in Kewanee and their reported violations in the past:
COUNTRY CLUB ESTATES SUBDIVISION (Address: 13 Pine Tree Rd. Population served: 63, Groundwater):
Past monitoring violations:
Monitoring and Reporting (DBP) - Between OCT-2012 and DEC-2012, Contaminant: Chlorine. Follow-up actions: St Public Notif requested (NOV-16-2012), St Violation/Reminder Notice (NOV-16-2012), St Compliance achieved (DEC-10-2012), St Public Notif received (DEC-10-2012)
One routine major monitoring violation
Population served: 50, Groundwater):
Past monitoring violations:
Monitoring, Repeat Major (TCR) - Between JAN-2009 and DEC-2009, Contaminant: Coliform (TCR). Follow-up actions: St Compliance achieved (DEC-15-2009)
Drinking water stations with addresses in Kewanee that have no violations reported:
ST PETERS EVANGELICAL CHURCH (Population served: 60, Primary Water Source Type: Groundwater)
HAWKEYE COMMERCIAL PARK (Population served: 60, Primary Water Source Type: Groundwater)
SHELL EXPRESS VENDING MACHINE (135749) (Population served: 60, Primary Water Source Type: Purch groundwater)
OAKWOOD COUNTRY CLUB (Population served: 50, Primary Water Source Type: Groundwater)
ORION CHRISTIAN CHURCH (Population served: 30, Primary Water Source Type: Groundwater)
KEWANEE MUNICIPAL AIRPORT (Population served: 30, Primary Water Source Type: Groundwater)
Average household size: This city:
2.4 peopleIllinois:
2.6 people
Percentage of family households: This city:
62.0%Whole state:
65.8%
Percentage of households with unmarried partners: This city:
7.9%Whole state:
6.3%
Likely homosexual households (counted as self-reported same-sex unmarried-partner households)
Lesbian couples: 0.3% of all households Gay men: 0.2% of all households
People in group quarters in Kewanee in 2010:
210 people in nursing facilities/skilled-nursing facilities
205 people in federal detention centers
17 people in group homes intended for adults
10 people in residential treatment centers for adults
People in group quarters in Kewanee in 2000:
187 people in nursing homes
30 people in other group homes
12 people in other noninstitutional group quarters
Banks with branches in Kewanee (2011 data):
Peoples National Bank of Kewanee: Peoples National Bank Of Kewanee at 207 North Tremont Street, branch established on 1928/03/01; South Tenney Facility at 737 South Tenney Street, branch established on 1977/11/25. Info updated 2008/07/18: Bank assets: $252.0 mil, Deposits: $209.2 mil, local headquarters , positive income , Agricultural Specialization, 7 total offices , Holding Company: Peoples Financial Corp. Of Illinois, Inc.
Community State Bank: Kewanee Branch at 409 Tenney St, branch established on 1997/06/30; Main Street Kewanee Branch at 300 North Main Street, branch established on 2007/06/18. Info updated 2010/06/22: Bank assets: $127.5 mil, Deposits: $111.1 mil, headquarters in Galva, IL, positive income , Commercial Lending Specialization, 5 total offices , Holding Company: Galva Investment, Inc.
State Bank of Toulon: Kewanee Branch at 635 South Tenney Street, branch established on 1997/09/19. Info updated 2006/11/03: Bank assets: $185.1 mil, Deposits: $156.1 mil, headquarters in Toulon, IL, positive income , Agricultural Specialization, 3 total offices , Holding Company: Stark County Bancorp, Inc.
First Federal Savings and Loan Association of Kewanee: First Federal Savings And Loan Assoc at 101 W Central Blvd, branch established on 1882/01/01. Info updated 2011/07/21: Bank assets: $73.7 mil, Deposits: $65.1 mil, local headquarters , negative income in the last year , 3 total offices
Woodforest National Bank: Kewanee Wal-Mart Branch at 730 Tenney Street, branch established on 2007/05/05. Info updated 2011/05/10: Bank assets: $3,488.9 mil, Deposits: $3,097.6 mil, headquarters in Houston, TX, positive income , Commercial Lending Specialization, 766 total offices , Holding Company: Woodforest Financial Group Employee Stock Ownership Plan (With 401(K) Provisions)
Union Federal Savings and Loan Association: Union Federal Savings And Loan Assoc at 104 North Tremont Street, branch established on 1890/01/01. Info updated 2011/07/21: Bank assets: $122.1 mil, Deposits: $102.2 mil, local headquarters , positive income , Mortgage Lending Specialization, 7 total offices
For population 15 years and over in Kewanee:
Never married: 38.2%Now married: 41.9%Separated: 1.2%Widowed: 7.6%Divorced: 11.1% For population 25 years and over in Kewanee:
High school or higher: 83.8%Bachelor's degree or higher: 14.1%Graduate or professional degree: 4.8%Unemployed: 7.1%Mean travel time to work (commute): 16.6 minutes
Education Gini index (Inequality in education) Here:
11.9Illinois average:
12.5
Religion statistics for Kewanee, IL (based on Henry County data)
Religion Adherents Congregations Mainline Protestant 11,117 35 Catholic 6,390 11 Evangelical Protestant 4,617 38 Other 390 4 Black Protestant 305 2 None 27,667 -
Source: Clifford Grammich, Kirk Hadaway, Richard Houseal, Dale E.Jones, Alexei Krindatch, Richie Stanley and Richard H.Taylor. 2012. 2010 U.S.Religion Census: Religious Congregations & Membership Study. Association of Statisticians of American Religious Bodies. Jones, Dale E., et al. 2002. Congregations and Membership in the United States 2000. Nashville, TN: Glenmary Research Center. Graphs represent county-level data
Food Environment Statistics: Number of grocery stores : 12Henry County :
2.42 / 10,000 pop.Illinois :
2.24 / 10,000 pop.
Number of supercenters and club stores : 1This county :
0.20 / 10,000 pop.Illinois :
0.08 / 10,000 pop.
Number of convenience stores (no gas) : 4Henry County :
0.81 / 10,000 pop.State :
0.75 / 10,000 pop.
Number of convenience stores (with gas) : 33Here :
6.65 / 10,000 pop.Illinois :
2.61 / 10,000 pop.
Number of full-service restaurants : 44Henry County :
8.87 / 10,000 pop.Illinois :
6.86 / 10,000 pop.
Adult diabetes rate : This county :
8.5%Illinois :
8.3%
Low-income preschool obesity rate : Health and Nutrition: Healthy diet rate : This city:
47.3%Illinois:
49.5%
Average overall health of teeth and gums : This city:
42.3%State:
47.2%
Average BMI : Kewanee:
28.5Illinois:
28.6
People feeling badly about themselves : Kewanee:
22.5%Illinois:
20.5%
People not drinking alcohol at all : Average hours sleeping at night : Overweight people : Kewanee:
33.0%Illinois:
33.4%
General health condition : This city:
52.2%Illinois:
56.4%
Average condition of hearing : This city:
75.5%State:
79.9%
More about Health and Nutrition of Kewanee, IL Residents
Local government employment and payroll (March 2022)
Function
Full-time employees
Monthly full-time payroll
Average yearly full-time wage
Part-time employees
Monthly part-time payroll
Police Protection - Officers
27 $157,294 $69,908 0 $0 Firefighters
18 $113,070 $75,380 0 $0 Water Supply
8 $37,200 $55,800 0 $0 Sewerage
8 $75,286 $112,929 0 $0 Streets and Highways
5 $25,464 $61,114 0 $0 Solid Waste Management
5 $19,929 $47,830 0 $0 Financial Administration
3 $12,469 $49,876 0 $0 Other and Unallocable
3 $22,807 $91,228 0 $0 Other Government Administration
1 $11,133 $133,596 0 $0 Housing and Community Development (Local)
1 $5,713 $68,556 1 $1,107 Electric Power
1 $7,389 $88,668 0 $0
Totals for Government
80 $487,754 $73,163 1 $1,107
Kewanee government finances - Expenditure in 2017 (per resident):
Construction - Regular Highways: $381,000 ($31.16)
General Public Buildings: $61,000 ($4.99)Current Operations - Police Protection: $3,082,000 ($252.02)
Local Fire Protection: $2,616,000 ($213.92)Sewerage: $2,562,000 ($209.50)Water Utilities: $1,388,000 ($113.50)Regular Highways: $1,106,000 ($90.44)General - Other: $1,040,000 ($85.04)Solid Waste Management: $1,024,000 ($83.74)Central Staff Services: $520,000 ($42.52)Housing and Community Development: $308,000 ($25.19)Miscellaneous Commercial Activities - Other: $255,000 ($20.85)Parks and Recreation: $78,000 ($6.38)General - Interest on Debt: $440,000 ($35.98)
Total Salaries and Wages: $4,846,000 ($396.27)
Kewanee government finances - Revenue in 2017 (per resident):
Charges - Sewerage: $1,586,000 ($129.69)
Solid Waste Management: $1,017,000 ($83.16)Other: $641,000 ($52.42)Federal Intergovernmental - Other: $4,000 ($0.33)
Miscellaneous - General Revenue - Other: $679,000 ($55.52)
Fines and Forfeits: $258,000 ($21.10)Interest Earnings: $100,000 ($8.18)Revenue - Water Utilities: $2,172,000 ($177.61)
State Intergovernmental - General Local Government Support: $3,976,000 ($325.13)
Highways: $329,000 ($26.90)Tax - Property: $2,568,000 ($209.99)
Other Selective Sales: $700,000 ($57.24)Public Utilities Sales: $414,000 ($33.85)Other License: $374,000 ($30.58)
Kewanee government finances - Debt in 2017 (per resident):
Long Term Debt - Beginning Outstanding - Unspecified Public Purpose: $14,062,000 ($1149.89)
Outstanding Unspecified Public Purpose: $12,799,000 ($1046.61)Retired Unspecified Public Purpose: $1,561,000 ($127.65)Outstanding Nonguaranteed - Industrial Revenue: $737,000 ($60.27)Beginning Outstanding - Public Debt for Private Purpose: $737,000 ($60.27)Issue, Unspecified Public Purpose: $298,000 ($24.37)
Kewanee government finances - Cash and Securities in 2017 (per resident):
Other Funds - Cash and Securities: $18,278,000 ($1494.64)
Sinking Funds - Cash and Securities: $737,000 ($60.27)
Businesses in Kewanee, IL
Name Count Name Count
ALDI 1 McDonald's 1 AmericInn 1 Menards 1 AutoZone 1 New Balance 1 Burger King 1 Nike 3 CVS 1 Payless 1 Chevrolet 1 Pizza Hut 1 Dairy Queen 1 RadioShack 1 FedEx 1 SAS Shoes 1 Ford 1 Super 8 1 GameStop 1 Taco Bell 1 Goodwill 2 U-Haul 1 H&R Block 1 U.S. Cellular 1 Kincaid 1 UPS 2 Lane Furniture 1 Walgreens 1 MasterBrand Cabinets 1 Walmart 1 Maurices 1 YMCA 1
Strongest AM radio stations in Kewanee:
WKEI (1450 AM; 1 kW; KEWANEE, IL; Owner: VIRDEN BROADCASTING CORP.)
WSCR (670 AM; 50 kW; CHICAGO, IL; Owner: INFINITY BROADCASTING OPERATIONS, INC.)
WGN (720 AM; 50 kW; CHICAGO, IL; Owner: WGN CONTINENTAL BROADCASTING CO.)
WBBM (780 AM; 50 kW; CHICAGO, IL; Owner: INFINITY BROADCASTING OPERATIONS, INC.)
WLS (890 AM; 50 kW; CHICAGO, IL; Owner: WLS, INC.)
WMVP (1000 AM; 50 kW; CHICAGO, IL; Owner: ABC, INC.)
WAIK (1590 AM; 5 kW; GALESBURG, IL; Owner: WPW BROADCASTING, INC.)
WYLL (1160 AM; 50 kW; CHICAGO, IL; Owner: SCA LICENSE CORPORATION)
WTMJ (620 AM; 50 kW; MILWAUKEE, WI; Owner: JOURNAL BROADCAST CORPORATION)
WKBF (1270 AM; 5 kW; ROCK ISLAND, IL; Owner: MERCURY BROADCASTING COMPANY, INC.)
WOC (1420 AM; 5 kW; DAVENPORT, IA; Owner: CITICASTERS LICENSES, L.P.)
WISN (1130 AM; 50 kW; MILWAUKEE, WI; Owner: CAPSTAR TX LIMITED PARTNERSHIP)
WVEL (1140 AM; daytime; 5 kW; PEKIN, IL)
Strongest FM radio stations in Kewanee:
WYEC (93.9 FM; KEWANEE, IL; Owner: VIRDEN BROADCASTING CORPORATION)
WJRE (102.5 FM; GALVA, IL; Owner: VIRDEN BROADCASTING CORP.)
WHTS (98.9 FM; ROCK ISLAND, IL; Owner: MERCURY BROADCASTING COMPANY, INC.)
WLLR-FM (103.7 FM; DAVENPORT, IA; Owner: CITICASTERS LICENSES, L.P.)
KUUL (101.3 FM; EAST MOLINE, IL; Owner: CITICASTERS LICENSES, L.P.)
WVIK (90.3 FM; ROCK ISLAND, IL; Owner: AUGUSTANA COLLEGE)
KCQQ (106.5 FM; DAVENPORT, IA; Owner: CITICASTERS LICENSES, L.P.)
KMXG (96.1 FM; CLINTON, IA; Owner: CITICASTERS LICENSES, L.P.)
WKAY (105.3 FM; KNOXVILLE, IL; Owner: GALESBURG BROADCASTING COMPANY)
WXLP (96.9 FM; MOLINE, IL; Owner: CUMULUS LICENSING CORP.)
WAAG (94.9 FM; GALESBURG, IL; Owner: GALESBURG BROADCASTING CO.)
WLSR (92.7 FM; GALESBURG, IL; Owner: GALESBURG BROADCASTING COMPANY)
WAXR (88.1 FM; GENESEO, IL; Owner: AMERICAN FAMILY ASSOCIATION)
TV broadcast stations around Kewanee:
KWQC-TV (Channel 6; DAVENPORT, IA; Owner: YOUNG BROADCASTING OF DAVENPORT, INC.)
WQAD-TV (Channel 8; MOLINE, IL; Owner: NEW YORK TIMES MANAGEMENT SERVICES)
KLJB-TV (Channel 18; DAVENPORT, IA; Owner: QUAD CITIES TELEVISION ACQUISITION CORP.)
WQPT-TV (Channel 24; MOLINE, IL; Owner: BLACK HAWK COLLEGE)
WHBF-TV (Channel 4; ROCK ISLAND, IL; Owner: CORONET COMMUNICATIONS COMPANY)
WBQD-LP (Channel 26; DAVENPORT, IA; Owner: FOUR SEASONS PEORIA, LLC)
WWTO-TV (Channel 35; LASALLE, IL; Owner: TRINITY BROADCASTING NETWORK)
National Bridge Inventory (NBI) Statistics 24 Number of bridges144ft / 44.2m Total length $90,000 Total costs18,060 Total average daily traffic1,715 Total average daily truck traffic
New bridges - historical statistics
2 1920-1929 1 1930-1939 1 1940-1949 3 1950-1959 5 1960-1969 4 1970-1979 2 1980-1989 4 1990-1999 2 2010-2019
See full National Bridge Inventory statistics for Kewanee, IL
Home Mortgage Disclosure Act Aggregated Statistics For Year 2009(Based on 1 full and 2 partial tracts) A) FHA, FSA/RHS & VA B) Conventional C) Refinancings D) Home Improvement Loans E) Loans on Dwellings For 5+ Families F) Non-occupant Loans on Number Average Value Number Average Value Number Average Value Number Average Value Number Average Value Number Average Value
LOANS ORIGINATED 6 $77,307 32 $42,220 58 $55,337 29 $26,456 1 $32,000 36 $29,091 APPLICATIONS APPROVED, NOT ACCEPTED 1 $64,000 2 $43,500 5 $61,804 1 $6,000 0 $0 0 $0 APPLICATIONS DENIED 14 $64,587 6 $29,103 28 $57,059 4 $45,485 0 $0 2 $38,640 APPLICATIONS WITHDRAWN 0 $0 2 $27,000 13 $69,032 0 $0 0 $0 0 $0 FILES CLOSED FOR INCOMPLETENESS 0 $0 0 $0 5 $70,964 0 $0 0 $0 0 $0
Aggregated Statistics For Year 2008(Based on 1 full and 2 partial tracts) A) FHA, FSA/RHS & VA B) Conventional C) Refinancings D) Home Improvement Loans F) Non-occupant Loans on G) Loans On Manufactured Number Average Value Number Average Value Number Average Value Number Average Value Number Average Value Number Average Value
LOANS ORIGINATED 25 $63,198 48 $38,936 48 $59,489 23 $23,663 33 $32,943 0 $0 APPLICATIONS APPROVED, NOT ACCEPTED 0 $0 2 $26,075 10 $67,054 2 $29,155 1 $24,930 0 $0 APPLICATIONS DENIED 10 $68,807 8 $34,712 45 $63,200 10 $29,992 2 $33,375 1 $31,520 APPLICATIONS WITHDRAWN 1 $108,000 5 $81,670 11 $56,537 1 $62,330 1 $73,620 1 $6,000 FILES CLOSED FOR INCOMPLETENESS 0 $0 0 $0 3 $55,983 0 $0 0 $0 0 $0
Aggregated Statistics For Year 2007(Based on 1 full and 2 partial tracts) A) FHA, FSA/RHS & VA B) Conventional C) Refinancings D) Home Improvement Loans F) Non-occupant Loans on Number Average Value Number Average Value Number Average Value Number Average Value Number Average Value
LOANS ORIGINATED 11 $56,979 59 $46,438 59 $52,852 33 $25,428 41 $34,681 APPLICATIONS APPROVED, NOT ACCEPTED 0 $0 3 $64,203 16 $73,502 3 $52,837 0 $0 APPLICATIONS DENIED 0 $0 23 $47,011 63 $69,971 16 $41,925 6 $52,542 APPLICATIONS WITHDRAWN 1 $106,000 2 $74,820 16 $62,246 6 $39,465 0 $0 FILES CLOSED FOR INCOMPLETENESS 0 $0 0 $0 6 $56,972 0 $0 0 $0
Aggregated Statistics For Year 2006(Based on 1 full and 2 partial tracts) A) FHA, FSA/RHS & VA B) Conventional C) Refinancings D) Home Improvement Loans F) Non-occupant Loans on Number Average Value Number Average Value Number Average Value Number Average Value Number Average Value
LOANS ORIGINATED 8 $51,062 81 $40,704 74 $47,487 37 $23,626 43 $27,693 APPLICATIONS APPROVED, NOT ACCEPTED 0 $0 7 $67,877 11 $70,595 2 $17,000 2 $35,440 APPLICATIONS DENIED 0 $0 18 $37,884 42 $59,055 19 $27,295 5 $17,860 APPLICATIONS WITHDRAWN 0 $0 6 $64,030 19 $70,681 1 $58,710 0 $0 FILES CLOSED FOR INCOMPLETENESS 0 $0 0 $0 4 $57,642 0 $0 0 $0
Aggregated Statistics For Year 2005(Based on 1 full and 2 partial tracts) A) FHA, FSA/RHS & VA B) Conventional C) Refinancings D) Home Improvement Loans F) Non-occupant Loans on G) Loans On Manufactured Number Average Value Number Average Value Number Average Value Number Average Value Number Average Value Number Average Value
LOANS ORIGINATED 7 $56,114 74 $44,296 79 $45,706 33 $27,451 35 $28,086 1 $6,350 APPLICATIONS APPROVED, NOT ACCEPTED 1 $42,000 7 $46,106 10 $44,090 1 $40,000 1 $25,000 0 $0 APPLICATIONS DENIED 0 $0 12 $44,682 61 $59,836 23 $25,336 3 $33,717 0 $0 APPLICATIONS WITHDRAWN 1 $85,000 4 $47,990 25 $64,021 7 $68,599 3 $56,207 0 $0 FILES CLOSED FOR INCOMPLETENESS 0 $0 2 $71,620 3 $58,817 2 $37,000 0 $0 0 $0
Aggregated Statistics For Year 2004(Based on 1 full and 2 partial tracts) A) FHA, FSA/RHS & VA B) Conventional C) Refinancings D) Home Improvement Loans F) Non-occupant Loans on G) Loans On Manufactured Number Average Value Number Average Value Number Average Value Number Average Value Number Average Value Number Average Value
LOANS ORIGINATED 11 $49,267 90 $42,485 93 $50,078 37 $27,124 55 $31,729 2 $41,725 APPLICATIONS APPROVED, NOT ACCEPTED 0 $0 4 $50,252 7 $63,667 3 $40,883 0 $0 0 $0 APPLICATIONS DENIED 0 $0 18 $42,898 60 $52,551 21 $24,658 3 $49,350 0 $0 APPLICATIONS WITHDRAWN 0 $0 2 $44,985 22 $57,758 2 $42,200 1 $70,300 0 $0 FILES CLOSED FOR INCOMPLETENESS 0 $0 1 $77,000 0 $0 0 $0 0 $0 0 $0
Aggregated Statistics For Year 2003(Based on 1 full and 2 partial tracts) A) FHA, FSA/RHS & VA B) Conventional C) Refinancings D) Home Improvement Loans F) Non-occupant Loans on Number Average Value Number Average Value Number Average Value Number Average Value Number Average Value
LOANS ORIGINATED 14 $53,002 58 $39,075 147 $48,666 28 $11,760 38 $34,115 APPLICATIONS APPROVED, NOT ACCEPTED 0 $0 2 $65,425 8 $51,720 2 $10,850 0 $0 APPLICATIONS DENIED 1 $59,810 8 $36,569 57 $61,338 10 $15,884 2 $37,915 APPLICATIONS WITHDRAWN 0 $0 5 $34,068 35 $58,264 0 $0 2 $35,765 FILES CLOSED FOR INCOMPLETENESS 0 $0 0 $0 2 $62,500 0 $0 0 $0
Aggregated Statistics For Year 2002(Based on 1 full and 2 partial tracts) A) FHA, FSA/RHS & VA B) Conventional C) Refinancings D) Home Improvement Loans F) Non-occupant Loans on Number Average Value Number Average Value Number Average Value Number Average Value Number Average Value
LOANS ORIGINATED 14 $47,439 53 $38,635 119 $41,600 37 $8,613 36 $25,183 APPLICATIONS APPROVED, NOT ACCEPTED 1 $42,000 1 $23,270 11 $44,614 0 $0 1 $40,000 APPLICATIONS DENIED 3 $44,000 8 $29,169 44 $47,773 6 $17,820 2 $44,360 APPLICATIONS WITHDRAWN 2 $48,500 4 $64,118 28 $51,710 1 $24,000 2 $35,165 FILES CLOSED FOR INCOMPLETENESS 0 $0 0 $0 5 $52,196 0 $0 0 $0
Aggregated Statistics For Year 2001(Based on 1 full and 2 partial tracts) A) FHA, FSA/RHS & VA B) Conventional C) Refinancings D) Home Improvement Loans F) Non-occupant Loans on Number Average Value Number Average Value Number Average Value Number Average Value Number Average Value
LOANS ORIGINATED 26 $52,081 60 $37,966 113 $44,373 28 $10,713 35 $29,057 APPLICATIONS APPROVED, NOT ACCEPTED 0 $0 1 $51,470 11 $39,921 1 $41,630 0 $0 APPLICATIONS DENIED 1 $55,980 6 $64,027 59 $41,384 14 $11,506 0 $0 APPLICATIONS WITHDRAWN 0 $0 4 $28,422 37 $40,046 1 $4,000 0 $0 FILES CLOSED FOR INCOMPLETENESS 0 $0 0 $0 3 $56,953 0 $0 0 $0
Aggregated Statistics For Year 2000(Based on 1 full and 2 partial tracts) A) FHA, FSA/RHS & VA B) Conventional C) Refinancings D) Home Improvement Loans F) Non-occupant Loans on Number Average Value Number Average Value Number Average Value Number Average Value Number Average Value
LOANS ORIGINATED 15 $42,606 83 $39,830 86 $35,442 34 $7,899 38 $26,008 APPLICATIONS APPROVED, NOT ACCEPTED 1 $31,000 1 $36,520 4 $51,735 5 $35,718 1 $32,000 APPLICATIONS DENIED 0 $0 9 $43,914 41 $40,372 11 $11,578 1 $18,860 APPLICATIONS WITHDRAWN 2 $39,000 2 $30,410 48 $36,812 0 $0 0 $0 FILES CLOSED FOR INCOMPLETENESS 0 $0 2 $11,500 4 $34,552 1 $20,000 0 $0
Aggregated Statistics For Year 1999(Based on 1 full and 3 partial tracts) A) FHA, FSA/RHS & VA B) Conventional C) Refinancings D) Home Improvement Loans E) Loans on Dwellings For 5+ Families F) Non-occupant Loans on Number Average Value Number Average Value Number Average Value Number Average Value Number Average Value Number Average Value
LOANS ORIGINATED 23 $45,657 69 $36,187 123 $35,087 49 $10,770 1 $64,420 43 $27,812 APPLICATIONS APPROVED, NOT ACCEPTED 1 $54,840 2 $23,790 21 $36,207 8 $22,812 0 $0 1 $37,180 APPLICATIONS DENIED 0 $0 14 $32,953 63 $31,386 22 $11,014 0 $0 4 $27,715 APPLICATIONS WITHDRAWN 1 $38,390 4 $39,698 48 $38,918 7 $27,347 0 $0 0 $0 FILES CLOSED FOR INCOMPLETENESS 0 $0 0 $0 7 $47,541 0 $0 0 $0 0 $0
Detailed HMDA statistics for the following Tracts:
0306.00
, 0308.00 , 0309.00
Private Mortgage Insurance Companies Aggregated Statistics For Year 2009(Based on 1 full and 2 partial tracts) A) Conventional B) Refinancings Number Average Value Number Average Value
LOANS ORIGINATED 1 $86,000 2 $103,125 APPLICATIONS APPROVED, NOT ACCEPTED 2 $62,100 0 $0 APPLICATIONS DENIED 0 $0 2 $80,500 APPLICATIONS WITHDRAWN 0 $0 1 $99,000 FILES CLOSED FOR INCOMPLETENESS 0 $0 0 $0
Aggregated Statistics For Year 2008(Based on 1 full and 2 partial tracts) A) Conventional B) Refinancings C) Non-occupant Loans on Number Average Value Number Average Value Number Average Value
LOANS ORIGINATED 3 $59,500 4 $85,138 1 $41,000 APPLICATIONS APPROVED, NOT ACCEPTED 1 $53,640 2 $93,050 0 $0 APPLICATIONS DENIED 1 $104,000 0 $0 0 $0 APPLICATIONS WITHDRAWN 0 $0 0 $0 0 $0 FILES CLOSED FOR INCOMPLETENESS 0 $0 0 $0 0 $0
Aggregated Statistics For Year 2007(Based on 1 full and 2 partial tracts) A) Conventional B) Refinancings C) Non-occupant Loans on Number Average Value Number Average Value Number Average Value
LOANS ORIGINATED 21 $55,568 5 $69,968 2 $43,055 APPLICATIONS APPROVED, NOT ACCEPTED 1 $164,000 0 $0 0 $0 APPLICATIONS DENIED 0 $0 0 $0 0 $0 APPLICATIONS WITHDRAWN 2 $90,000 1 $72,250 0 $0 FILES CLOSED FOR INCOMPLETENESS 0 $0 0 $0 0 $0
Aggregated Statistics For Year 2006(Based on 1 full and 2 partial tracts) A) Conventional B) Refinancings Number Average Value Number Average Value
LOANS ORIGINATED 8 $57,329 7 $70,464 APPLICATIONS APPROVED, NOT ACCEPTED 2 $44,930 0 $0 APPLICATIONS DENIED 0 $0 0 $0 APPLICATIONS WITHDRAWN 1 $88,620 2 $101,500 FILES CLOSED FOR INCOMPLETENESS 0 $0 0 $0
Aggregated Statistics For Year 2005(Based on 1 full and 2 partial tracts) A) Conventional B) Refinancings C) Non-occupant Loans on Number Average Value Number Average Value Number Average Value
LOANS ORIGINATED 23 $52,718 5 $58,378 2 $45,120 APPLICATIONS APPROVED, NOT ACCEPTED 3 $69,333 2 $63,000 0 $0 APPLICATIONS DENIED 0 $0 0 $0 0 $0 APPLICATIONS WITHDRAWN 1 $47,320 0 $0 1 $44,000 FILES CLOSED FOR INCOMPLETENESS 0 $0 0 $0 0 $0
Aggregated Statistics For Year 2004(Based on 1 full and 2 partial tracts) A) Conventional B) Refinancings C) Non-occupant Loans on Number Average Value Number Average Value Number Average Value
LOANS ORIGINATED 18 $58,492 7 $56,424 3 $54,667 APPLICATIONS APPROVED, NOT ACCEPTED 3 $48,683 4 $57,790 0 $0 APPLICATIONS DENIED 2 $74,000 0 $0 0 $0 APPLICATIONS WITHDRAWN 2 $92,780 0 $0 2 $88,125 FILES CLOSED FOR INCOMPLETENESS 0 $0 0 $0 0 $0
Aggregated Statistics For Year 2003(Based on 1 full and 2 partial tracts) A) Conventional B) Refinancings Number Average Value Number Average Value
LOANS ORIGINATED 16 $44,352 17 $60,339 APPLICATIONS APPROVED, NOT ACCEPTED 0 $0 0 $0 APPLICATIONS DENIED 1 $67,000 0 $0 APPLICATIONS WITHDRAWN 0 $0 1 $54,000 FILES CLOSED FOR INCOMPLETENESS 1 $42,000 0 $0
Aggregated Statistics For Year 2002(Based on 1 full and 2 partial tracts) A) Conventional B) Refinancings Number Average Value Number Average Value
LOANS ORIGINATED 15 $52,200 7 $64,991 APPLICATIONS APPROVED, NOT ACCEPTED 0 $0 0 $0 APPLICATIONS DENIED 0 $0 0 $0 APPLICATIONS WITHDRAWN 0 $0 1 $29,000 FILES CLOSED FOR INCOMPLETENESS 0 $0 0 $0
Aggregated Statistics For Year 2001(Based on 1 full and 2 partial tracts) A) Conventional B) Refinancings Number Average Value Number Average Value
LOANS ORIGINATED 8 $59,856 7 $69,576 APPLICATIONS APPROVED, NOT ACCEPTED 0 $0 1 $85,410 APPLICATIONS DENIED 0 $0 0 $0 APPLICATIONS WITHDRAWN 0 $0 0 $0 FILES CLOSED FOR INCOMPLETENESS 0 $0 1 $45,000
Aggregated Statistics For Year 2000(Based on 1 full and 2 partial tracts) A) Conventional B) Refinancings Number Average Value Number Average Value
LOANS ORIGINATED 14 $52,274 2 $55,985 APPLICATIONS APPROVED, NOT ACCEPTED 4 $38,502 0 $0 APPLICATIONS DENIED 2 $39,790 1 $74,000 APPLICATIONS WITHDRAWN 0 $0 0 $0 FILES CLOSED FOR INCOMPLETENESS 0 $0 0 $0
Aggregated Statistics For Year 1999(Based on 1 full and 3 partial tracts) A) Conventional B) Refinancings Number Average Value Number Average Value
LOANS ORIGINATED 10 $55,420 4 $52,892 APPLICATIONS APPROVED, NOT ACCEPTED 2 $60,780 1 $38,000 APPLICATIONS DENIED 0 $0 0 $0 APPLICATIONS WITHDRAWN 2 $33,435 0 $0 FILES CLOSED FOR INCOMPLETENESS 0 $0 0 $0
Detailed PMIC statistics for the following Tracts:
0306.00
, 0308.00 , 0309.00 Fire-safe hotels and motels in Kewanee, Illinois:
Super 8, 901 S Tenney St, Kewanee, Illinois 61443 Phone: (309) 853-8800, Fax: (309) 856-5319
Americinn Lodge & Suites - Kewanee, 925 Tenney St, Kewanee, Illinois 61443 Phone: (309) 856-7200, Fax: (309) 856-7202
All 2 fire-safe hotels and motels in Kewanee, Illinois
Most common first names in Kewanee, IL among deceased individuals Name Count Lived (average)
John 209 74.8 years Mary 180 81.0 years William 159 77.5 years Robert 129 71.7 years Charles 105 74.3 years Helen 96 81.6 years George 94 78.0 years James 90 71.5 years Margaret 84 80.2 years Anna 81 84.2 years
Most common last names in Kewanee, IL among deceased individuals Last name Count Lived (average)
Johnson 105 78.1 years Anderson 69 81.6 years Smith 60 76.8 years Peterson 53 77.8 years Nelson 52 80.0 years Brown 46 74.8 years Miller 41 77.6 years Jones 35 77.1 years Olson 29 74.2 years Martin 27 78.5 years
Kewanee compared to Illinois state average:
Median household income below state average. Median house value significantly below state average. Unemployed percentage below state average. Black race population percentage below state average. Hispanic race population percentage below state average. Foreign-born population percentage significantly below state average. Length of stay since moving in significantly above state average. House age above state average. Institutionalized population percentage above state average. Percentage of population with a bachelor's degree or higher below state average.
#59 on the list of "Top 100 cities with lowest ratio of median house value to median household income (pop. 5,000+)"
#19 on the list of "Top 101 counties with the largest number of people without health insurance coverage in 2000 (pop. 50,000+)"
#68 on the list of "Top 101 counties with the lowest total withdrawal of fresh water for public supply (pop. 50,000+)"
#85 on the list of "Top 101 counties with the largest number of people moving out compared to moving in (pop. 50,000+)"
Top Patent Applicants
Bradley E. Pronschinske (4)
Stephen R. Corban (1)
Kenneth Dean Themanson (1)
Christopher Kent Hoadley (1)
Steve Eugene Brody (1)
Martin Andrew Yepsen (1)
Andrew J. Waters (1)
Martin A. Yepsen (1)
Steven R. Spahn (1)
James V. Martin (1)
Total of 17 patent applications in 2008-2024.


 Recent articles from our blog. Our writers, many of them Ph.D. graduates or candidates, create easy-to-read articles on a wide variety of topics.

 (39.6 miles
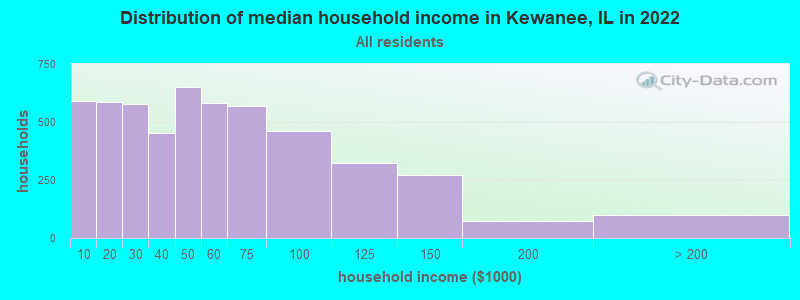
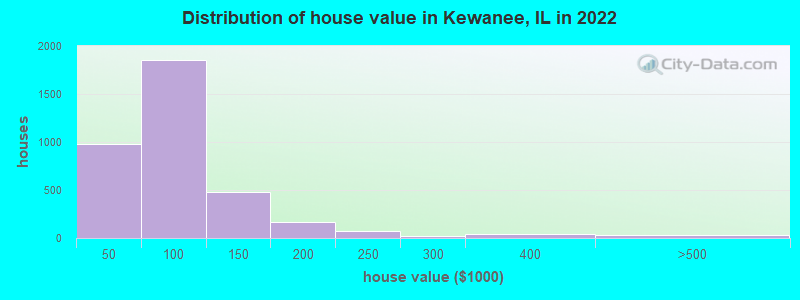

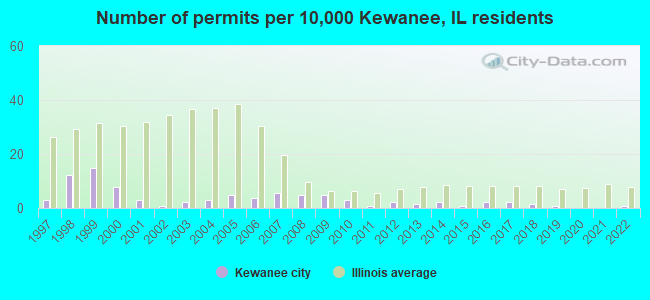
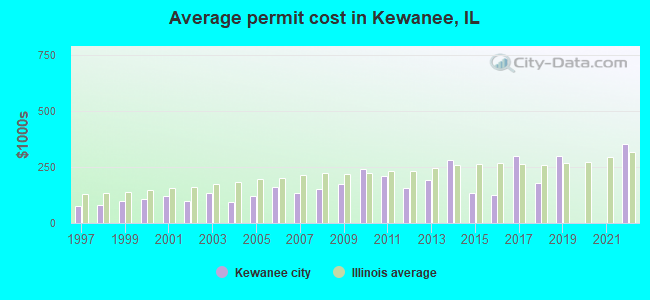
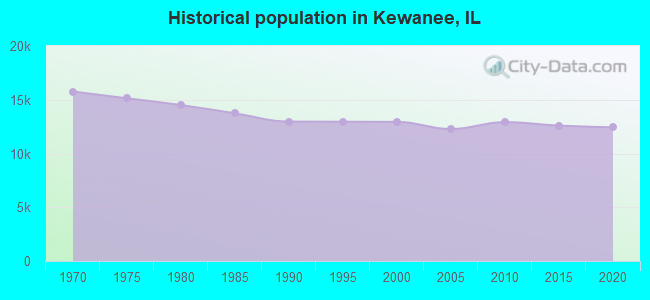
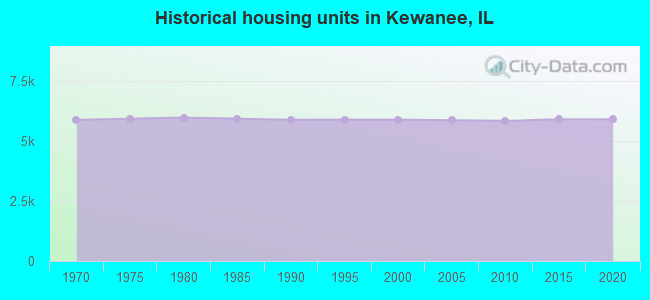
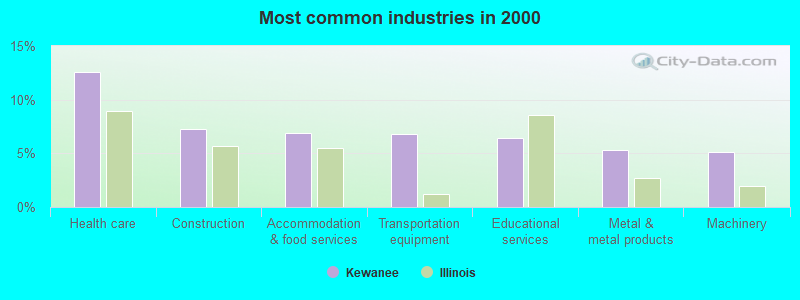
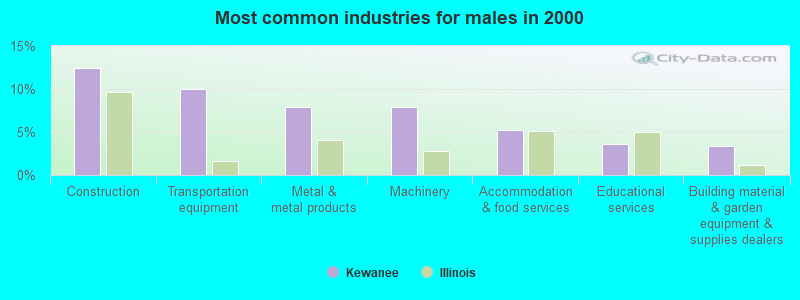
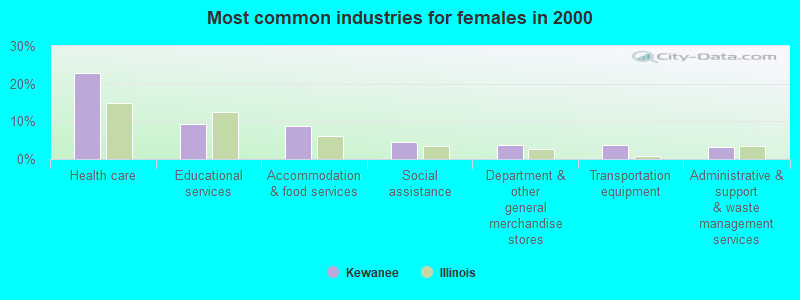
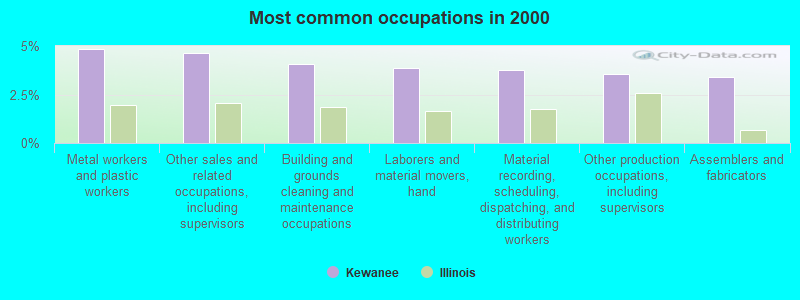
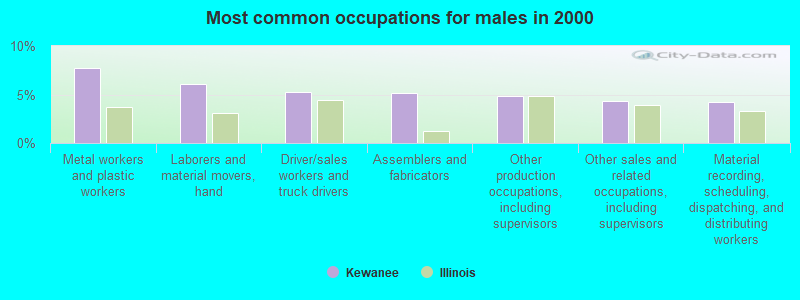
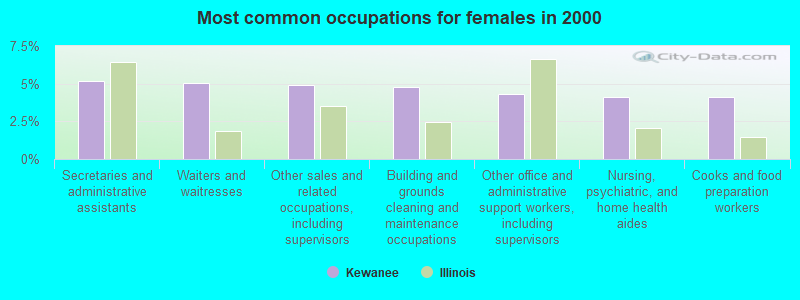


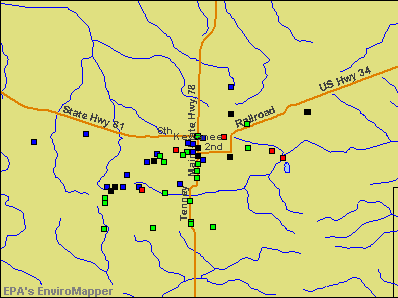


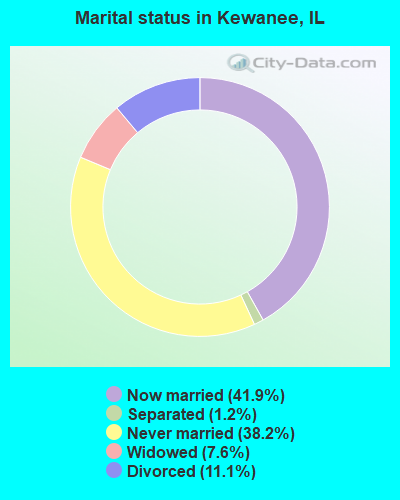
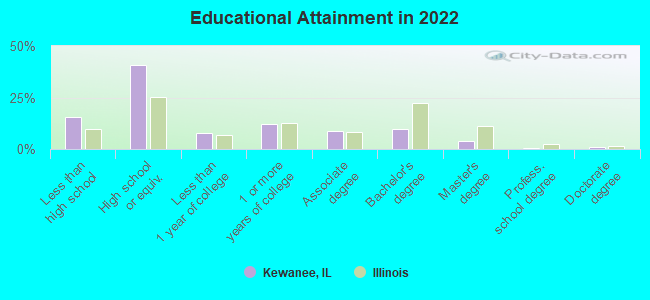
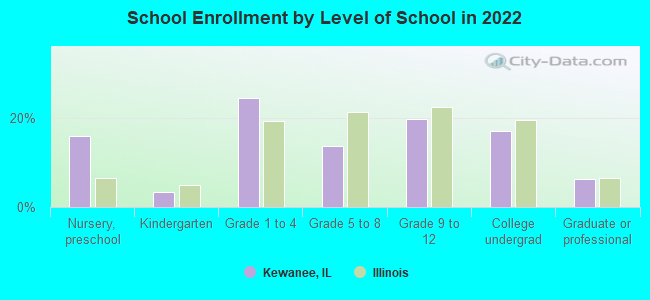
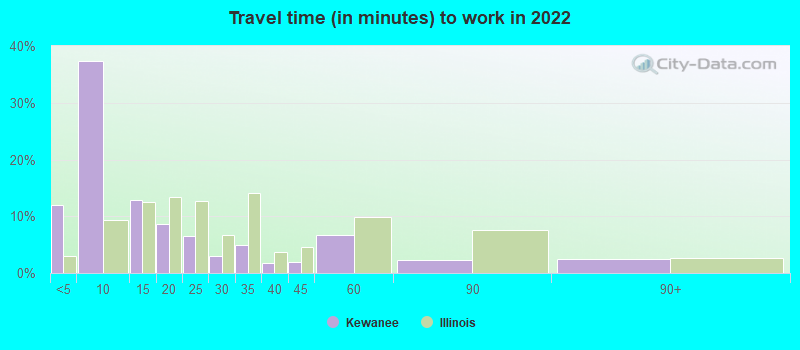
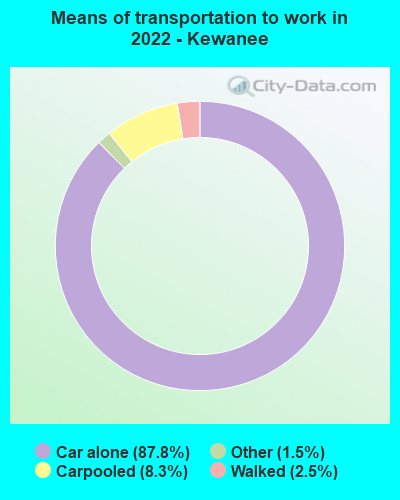
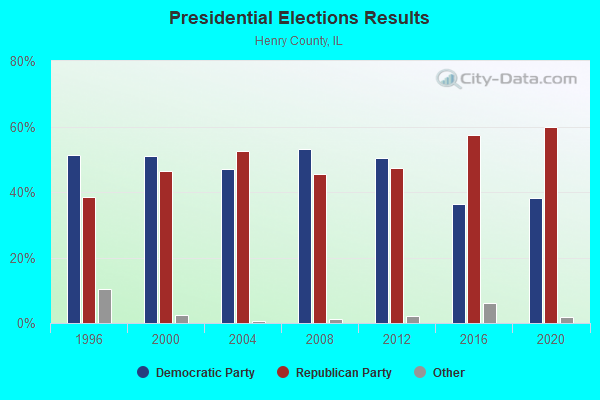
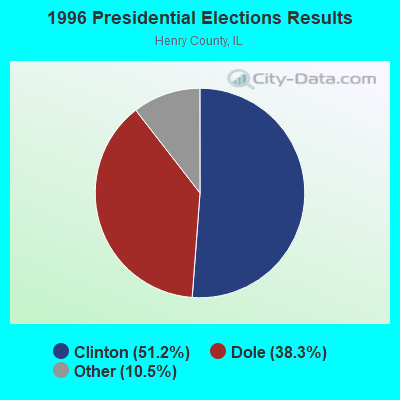
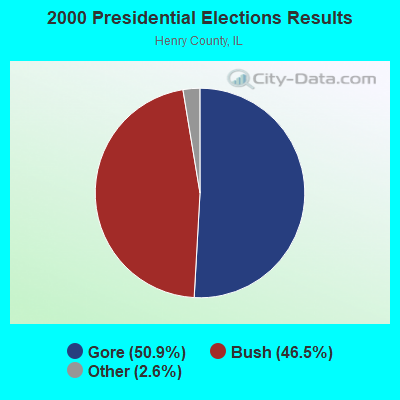
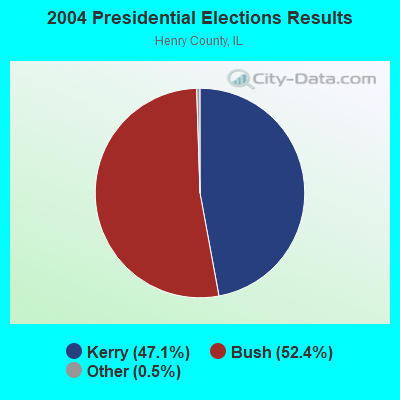
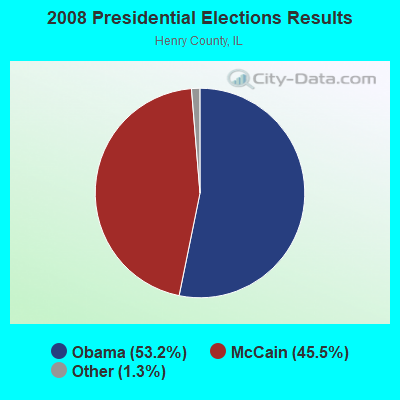
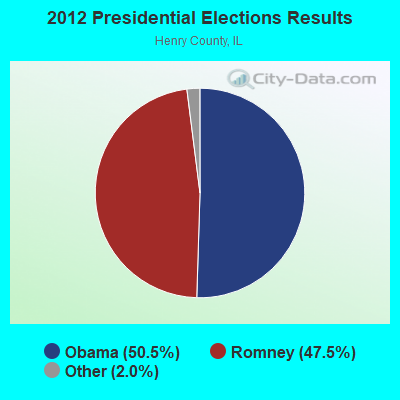
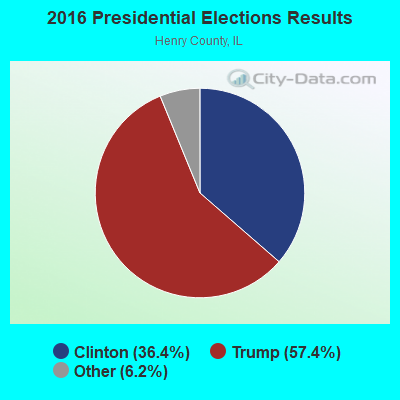
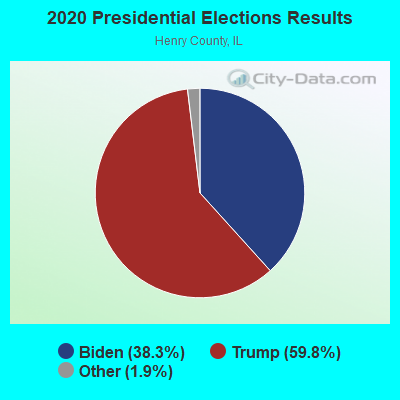
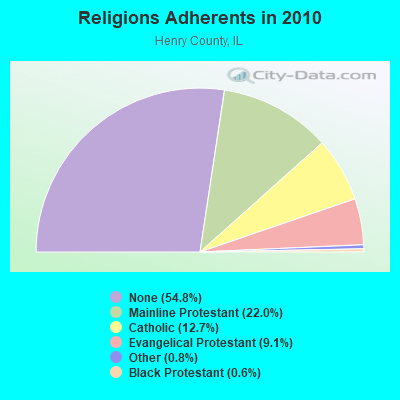
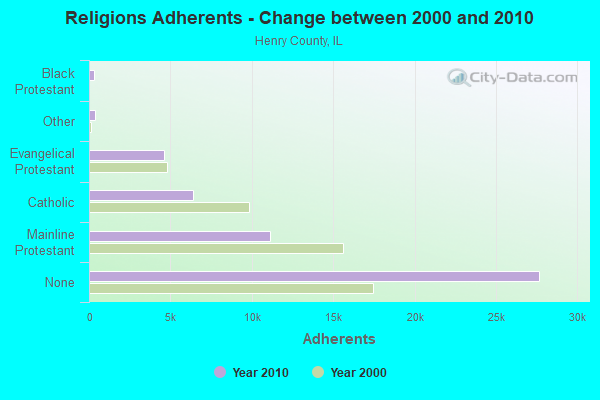
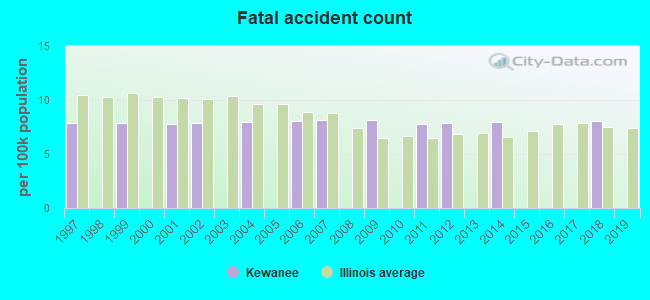
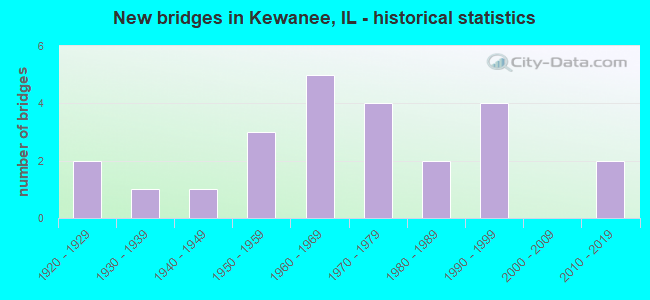
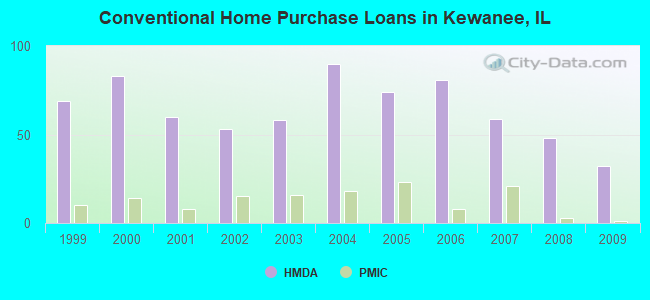
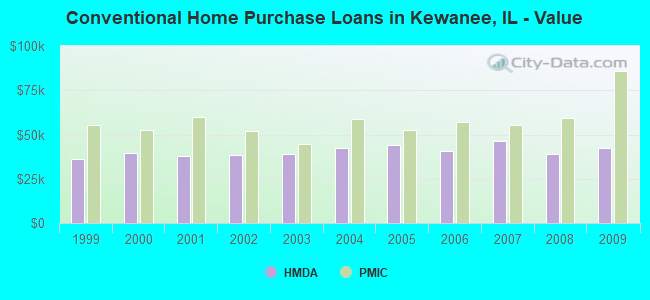
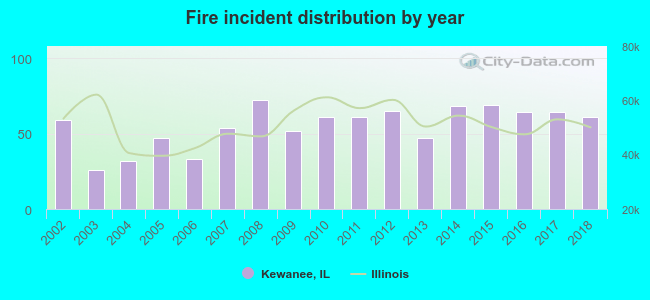 According to the data from the years 2002 - 2018 the average number of fire incidents per year is 55. The highest number of fire incidents - 72 took place in 2008, and the least - 26 in 2003. The data has an increasing trend.
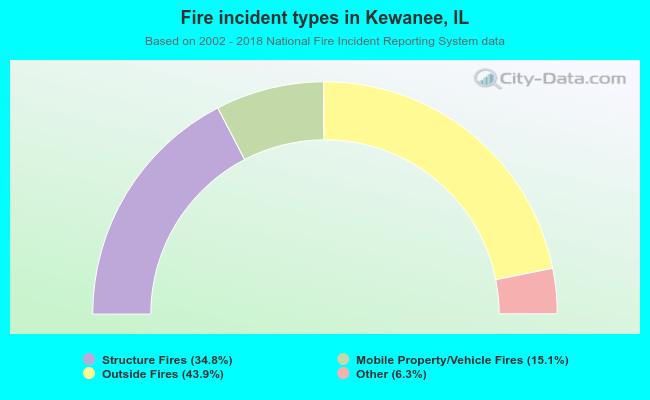 When looking into fire subcategories, the most incidents belonged to: Outside Fires (43.9%), and Structure Fires (34.8%).