Hayward: Fire Incidents, California (CA)
Where are fire incidents reported in Hayward, CA
Something went wrong! Please refresh the page.
|
| |||||||||||||||||||||||||||||||||||||||||||||||||||||||||||||||||||||||||||||||||||||||||||||||||||||||||||||
2005 - 2018 National Fire Incident Reporting System (NFIRS) incidents
- Incident types reported to NFIRS in Hayward, CA
- 6,12072.3%Rescue & EMS
- 8109.6%Good Intent Call
- 5516.5%Fire
- 4184.9%Service Call
- 3784.5%Hazardous Condition
- 1802.1%False Alarm
- Fire incident types reported to NFIRS in Hayward, CA
- 25746.6%Structure Fires
- 18433.4%Outside Fires
- 10318.7%Mobile Property/Vehicle Fires
- 71.3%Other
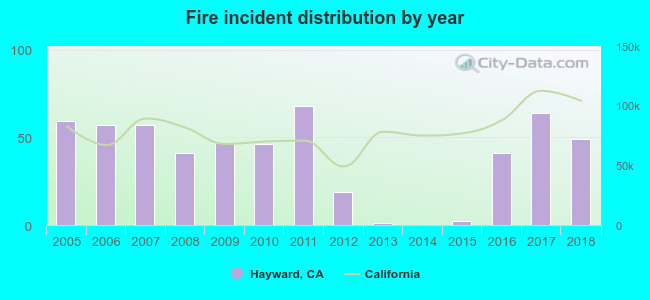 Based on the data from the years 2005 - 2018 the average number of fires per year is 39. The highest number of fires - 68 took place in 2011, and the least - 0 in 2014. The data has a dropping trend.
The average number of yearly fire incidents per 10k residents in Hayward, CA compared to nearest cities:
(Note: Based on data for the last 3 years, including only cities with population 5,000 and above)
| Hayward: | 3.3 |
| San Lorenzo: | 27.3 |
| Union City: | 18.2 |
| Castro Valley: | 14.8 |
| San Leandro: | 33.1 |
| Newark: | 22.2 |
| Fremont: | 19.8 |
| Dublin: | 24.0 |
| San Ramon: | 12.6 |
 The median response time based on all reported fire incidents is 4 minutes. This is lower compared to the state median value.
The median response time in Hayward, CA compared to nearest cities:
(Note: Based on data for all years, including only cities with at least 500 fire incidents)
| Hayward: | 4 minutes |
| San Lorenzo: | 4 minutes |
| Union City: | 5 minutes |
| Castro Valley: | 5 minutes |
| San Leandro: | 4 minutes |
| Newark: | 4 minutes |
| Fremont: | 5 minutes |
| Dublin: | 5 minutes |
| San Ramon: | 5 minutes |
 33.8% incidents where reported in the morning and 66.2% in the evening. The most fires (15.2%) took place on Tuesday, and the least (11.8%) on Friday.
 Based on the 551 reports from years 2005 - 2018 most fires (12.0%) took place during August, and the least (6.2%) in November.
 Out of all 8,463 cases reported during the years 2005 - 2018, the most belonged to the categories: Rescue & EMS (72.3%), Good Intent Call (9.6%), and Fire (6.5%).
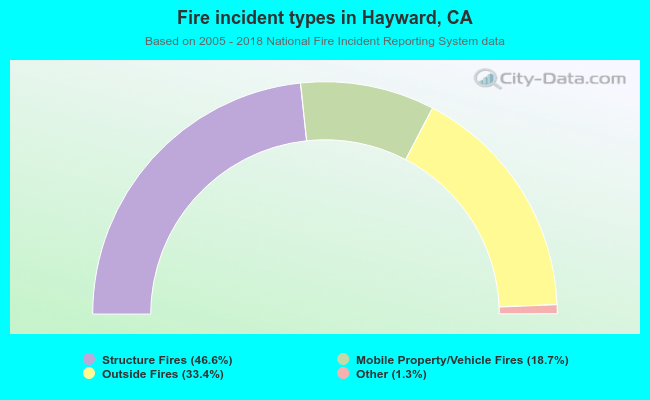 When looking into fire subcategories, the most incidents belonged to: Structure Fires (46.6%), and Outside Fires (33.4%).