Dublin: Fire Incidents, California (CA)
Where are fire incidents reported in Dublin, CA
Something went wrong! Please refresh the page.
| Fire incidents reported | |
|---|---|
| Sreet name | Count |
| DUBLIN BL | 72 |
| DOUGHERTY RD | 62 |
| DUBLIN BLVD | 62 |
| DUBLIN | 56 |
| DUBLIN BL | 54 |
| TASSAJARA RD | 46 |
| I580 | 40 |
| LAKE DR | 32 |
| DEMARCUS | 30 |
| TASSAJARA RD | 30 |
| AMADOR PLAZA RD | 28 |
| SAN RAMON RD | 26 |
| GLEASON DR | 24 |
| REGIONAL ST | 24 |
| CENTRAL | 22 |
| FINNIAN | 20 |
| HACIENDA DR | 20 |
| I680 | 20 |
| WB580 | 20 |
| DEMARCUS BL | 16 |
| DOUGHERTY RD | 16 |
| TAMARACK DR | 16 |
| BRODER BL | 14 |
| FALL CREEK RD | 14 |
| HAVEN PL | 14 |
| IRON HORSE | 14 |
| VILLAGE | 14 |
| VILLAGE PY | 14 |
| ALLEGHENY DR | 12 |
| AMADOR VALLEY | 12 |
| Other | 195 |
2005 - 2018 National Fire Incident Reporting System (NFIRS) incidents
- Incident types reported to NFIRS in Dublin, CA
- 7,11455.8%Rescue & EMS
- 1,83714.4%Good Intent Call
- 1,0448.2%False Alarm
- 1,0398.2%Fire
- 9457.4%Service Call
- 7245.7%Hazardous Condition
- 180.1%Overpressure Rupture
- 160.1%Special Incident
- Fire incident types reported to NFIRS in Dublin, CA
- 46544.8%Structure Fires
- 37235.8%Outside Fires
- 15514.9%Mobile Property/Vehicle Fires
- 474.5%Other
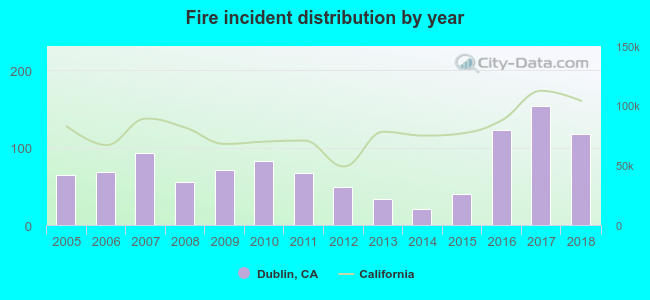 According to the data from the years 2005 - 2018 the average number of fire incidents per year is 74. The highest number of fires - 154 took place in 2017, and the least - 21 in 2014. The data has a rising trend.
The average number of yearly fire incidents per 10k residents in Dublin, CA compared to nearest cities:
(Note: Based on data for the last 3 years, including only cities with population 5,000 and above)
| Dublin: | 24.0 |
| Pleasanton: | 20.6 |
| San Ramon: | 12.6 |
| Blackhawk: | 9.6 |
| Danville: | 11.8 |
| Livermore: | 44.1 |
| Castro Valley: | 14.8 |
| Hayward: | 3.3 |
| Union City: | 18.2 |
 The median response time based on all reported fire incidents is 5 minutes. This is lower than the state median value.
The median response time in Dublin, CA compared to nearest cities:
(Note: Based on data for all years, including only cities with at least 500 fire incidents)
| Dublin: | 5 minutes |
| Pleasanton: | 5 minutes |
| San Ramon: | 5 minutes |
| Danville: | 6 minutes |
| Livermore: | 6 minutes |
| Castro Valley: | 5 minutes |
| Hayward: | 4 minutes |
| Union City: | 5 minutes |
| San Lorenzo: | 4 minutes |
 25.2% incidents where reported in the morning and 74.8% in the evening. The most fires (15.2%) took place on Tuesday, and the least (13.3%) on Wednesday.
 According to the 1,039 incident reports from years 2005 - 2018 most fires (16.2%) took place during July, and the least (5.2%) in March.
 Out of all 12,738 cases reported during the years 2005 - 2018, the most belonged to the categories: Rescue & EMS (55.8%), Good Intent Call (14.4%), and False Alarm (8.2%).
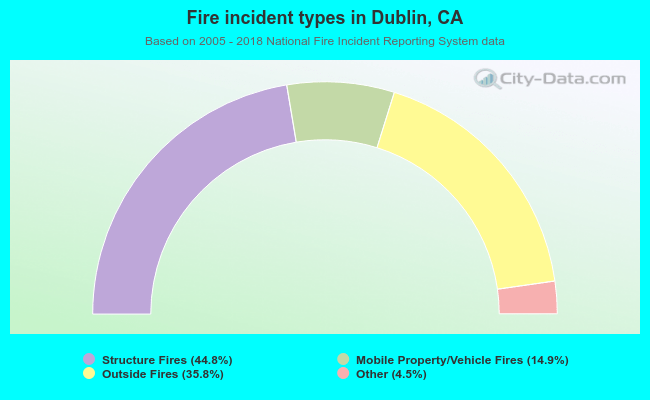 When looking into fire subcategories, the most incidents belonged to: Structure Fires (44.8%), and Outside Fires (35.8%).