Clayton: Fire Incidents, California (CA)
Where are fire incidents reported in Clayton, CA
Something went wrong! Please refresh the page.
|
| |||||||||||||||||||||||||||||||||||||||||||||||||||||||||||||||||||||||||||||||||||||||||||||||||||||||||||||
2005 - 2018 National Fire Incident Reporting System (NFIRS) incidents
- Incident types reported to NFIRS in Clayton, CA
- 82247.7%Rescue & EMS
- 28716.7%Fire
- 28716.7%Good Intent Call
- 1378.0%Hazardous Condition
- 975.6%Service Call
- 854.9%False Alarm
- 40.2%Special Incident
- 20.1%Severe Weather
- Fire incident types reported to NFIRS in Clayton, CA
- 15754.7%Outside Fires
- 8429.3%Structure Fires
- 2910.1%Mobile Property/Vehicle Fires
- 175.9%Other
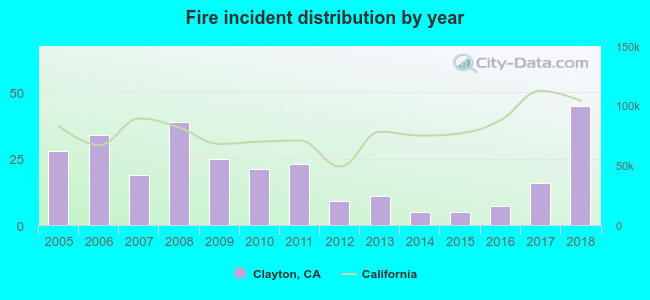 According to the data from the years 2005 - 2018 the average number of fires per year is 21. The highest number of reported fires - 45 took place in 2018, and the least - 5 in 2014. The data has a rising trend.
The average number of yearly fire incidents per 10k residents in Clayton, CA compared to nearest cities:
(Note: Based on data for the last 3 years, including only cities with population 5,000 and above)
| Clayton: | 19.4 |
| Concord: | 16.0 |
| Pittsburg: | 31.1 |
| Bay Point: | 54.3 |
| Tassajara: | 1.3 |
| Walnut Creek: | 13.3 |
| Pleasant Hill: | 25.1 |
| Alamo: | 12.1 |
| Antioch: | 36.2 |

 26.5% incidents where reported in the morning and 73.5% in the evening. The most fires (16.7%) took place on Saturday, and the least (12.2%) on Thursday.
 According to the 287 incident reports from years 2005 - 2018 most fires (16.0%) took place during July, and the least (3.5%) in January.
 Out of all 1,722 cases reported during the years 2005 - 2018, the most belonged to the categories: Rescue & EMS (47.7%), Fire (16.7%), and Good Intent Call (16.7%).
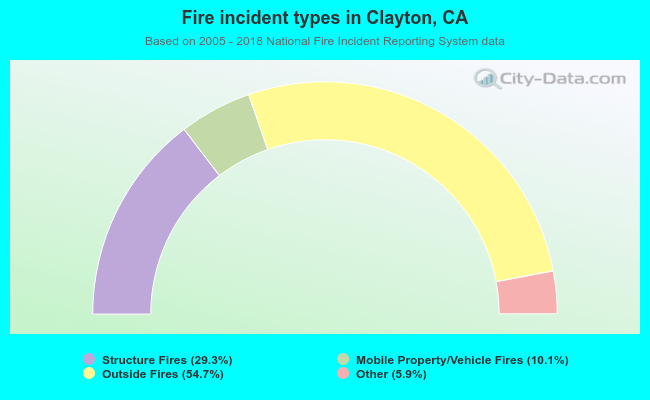 When looking into fire subcategories, the most incidents belonged to: Outside Fires (54.7%), and Structure Fires (29.3%).