Alamo: Fire Incidents, California (CA)
Where are fire incidents reported in Alamo, CA
Something went wrong! Please refresh the page.
|
| |||||||||||||||||||||||||||||||||||||||||||||||||||||||||||||||||||||||||||||||||||||||||||||||||||||||||||||
2005 - 2018 National Fire Incident Reporting System (NFIRS) incidents
- Incident types reported to NFIRS in Alamo, CA
- 2,40154.6%Rescue & EMS
- 64914.8%Good Intent Call
- 44110.0%Service Call
- 3347.6%Hazardous Condition
- 3277.4%False Alarm
- 2195.0%Fire
- 180.4%Special Incident
- 50.1%Overpressure Rupture
- Fire incident types reported to NFIRS in Alamo, CA
- 9744.3%Structure Fires
- 6630.1%Outside Fires
- 4721.5%Mobile Property/Vehicle Fires
- 94.1%Other
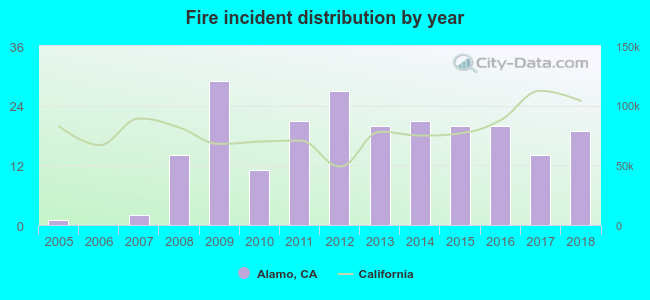 According to the data from the years 2005 - 2018 the average number of fires per year is 16. The highest number of reported fire incidents - 29 took place in 2009, and the least - 0 in 2006. The data has a growing trend.
The average number of yearly fire incidents per 10k residents in Alamo, CA compared to nearest cities:
(Note: Based on data for the last 3 years, including only cities with population 5,000 and above)
| Alamo: | 12.1 |
| Walnut Creek: | 13.3 |
| Danville: | 11.8 |
| Lafayette: | 18.8 |
| Moraga: | 14.9 |
| Pleasant Hill: | 25.1 |
| Blackhawk: | 9.6 |
| Concord: | 16.0 |
| Clayton: | 19.4 |

 35.2% incidents where reported in the morning and 64.8% in the evening. The most fires (18.3%) took place on Thursday, and the least (10.5%) on Wednesday.
 Based on the 219 fire incidents from years 2005 - 2018 most fires (11.0%) took place during June, and the least (4.1%) in February.
 Out of all 4,395 cases reported during the years 2005 - 2018, the most belonged to the categories: Rescue & EMS (54.6%), Good Intent Call (14.8%), and Service Call (10.0%).
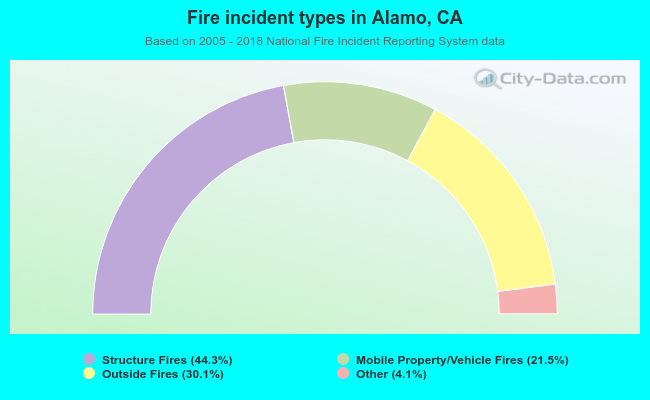 When looking into fire subcategories, the most incidents belonged to: Structure Fires (44.3%), and Outside Fires (30.1%).