Gorham, Maine Submit your own pictures of this place and show them to the world
OSM Map
General Map
Google Map
MSN Map
OSM Map
General Map
Google Map
MSN Map
OSM Map
General Map
Google Map
MSN Map
OSM Map
General Map
Google Map
MSN Map
Please wait while loading the map...
Population in 2010: 6,882. Population change since 2000: +65.3%Males: 2,997 Females: 3,885
March 2022 cost of living index in Gorham: 100.9 (near average, U.S. average is 100) Percentage of residents living in poverty in 2022: 2.2%for White Non-Hispanic residents , 23.1% for other race residents , 13.1% for two or more races residents )
Profiles of local businesses
Business Search - 14 Million verified businesses
Data:
Median household income ($)
Median household income (% change since 2000)
Household income diversity
Ratio of average income to average house value (%)
Ratio of average income to average rent
Median household income ($) - White
Median household income ($) - Black or African American
Median household income ($) - Asian
Median household income ($) - Hispanic or Latino
Median household income ($) - American Indian and Alaska Native
Median household income ($) - Multirace
Median household income ($) - Other Race
Median household income for houses/condos with a mortgage ($)
Median household income for apartments without a mortgage ($)
Races - White alone (%)
Races - White alone (% change since 2000)
Races - Black alone (%)
Races - Black alone (% change since 2000)
Races - American Indian alone (%)
Races - American Indian alone (% change since 2000)
Races - Asian alone (%)
Races - Asian alone (% change since 2000)
Races - Hispanic (%)
Races - Hispanic (% change since 2000)
Races - Native Hawaiian and Other Pacific Islander alone (%)
Races - Native Hawaiian and Other Pacific Islander alone (% change since 2000)
Races - Two or more races (%)
Races - Two or more races (% change since 2000)
Races - Other race alone (%)
Races - Other race alone (% change since 2000)
Racial diversity
Unemployment (%)
Unemployment (% change since 2000)
Unemployment (%) - White
Unemployment (%) - Black or African American
Unemployment (%) - Asian
Unemployment (%) - Hispanic or Latino
Unemployment (%) - American Indian and Alaska Native
Unemployment (%) - Multirace
Unemployment (%) - Other Race
Population density (people per square mile)
Population - Males (%)
Population - Females (%)
Population - Males (%) - White
Population - Males (%) - Black or African American
Population - Males (%) - Asian
Population - Males (%) - Hispanic or Latino
Population - Males (%) - American Indian and Alaska Native
Population - Males (%) - Multirace
Population - Males (%) - Other Race
Population - Females (%) - White
Population - Females (%) - Black or African American
Population - Females (%) - Asian
Population - Females (%) - Hispanic or Latino
Population - Females (%) - American Indian and Alaska Native
Population - Females (%) - Multirace
Population - Females (%) - Other Race
Coronavirus confirmed cases (May 21, 2024)
Deaths caused by coronavirus (May 21, 2024)
Coronavirus confirmed cases (per 100k population) (May 21, 2024)
Deaths caused by coronavirus (per 100k population) (May 21, 2024)
Daily increase in number of cases (May 21, 2024)
Weekly increase in number of cases (May 21, 2024)
Cases doubled (in days) (May 21, 2024)
Hospitalized patients (Apr 18, 2022)
Negative test results (Apr 18, 2022)
Total test results (Apr 18, 2022)
COVID Vaccine doses distributed (per 100k population) (Sep 19, 2023)
COVID Vaccine doses administered (per 100k population) (Sep 19, 2023)
COVID Vaccine doses distributed (Sep 19, 2023)
COVID Vaccine doses administered (Sep 19, 2023)
Likely homosexual households (%)
Likely homosexual households (% change since 2000)
Likely homosexual households - Lesbian couples (%)
Likely homosexual households - Lesbian couples (% change since 2000)
Likely homosexual households - Gay men (%)
Likely homosexual households - Gay men (% change since 2000)
Cost of living index
Median gross rent ($)
Median contract rent ($)
Median monthly housing costs ($)
Median house or condo value ($)
Median house or condo value ($ change since 2000)
Mean house or condo value by units in structure - 1, detached ($)
Mean house or condo value by units in structure - 1, attached ($)
Mean house or condo value by units in structure - 2 ($)
Mean house or condo value by units in structure by units in structure - 3 or 4 ($)
Mean house or condo value by units in structure - 5 or more ($)
Mean house or condo value by units in structure - Boat, RV, van, etc. ($)
Mean house or condo value by units in structure - Mobile home ($)
Median house or condo value ($) - White
Median house or condo value ($) - Black or African American
Median house or condo value ($) - Asian
Median house or condo value ($) - Hispanic or Latino
Median house or condo value ($) - American Indian and Alaska Native
Median house or condo value ($) - Multirace
Median house or condo value ($) - Other Race
Median resident age
Resident age diversity
Median resident age - Males
Median resident age - Females
Median resident age - White
Median resident age - Black or African American
Median resident age - Asian
Median resident age - Hispanic or Latino
Median resident age - American Indian and Alaska Native
Median resident age - Multirace
Median resident age - Other Race
Median resident age - Males - White
Median resident age - Males - Black or African American
Median resident age - Males - Asian
Median resident age - Males - Hispanic or Latino
Median resident age - Males - American Indian and Alaska Native
Median resident age - Males - Multirace
Median resident age - Males - Other Race
Median resident age - Females - White
Median resident age - Females - Black or African American
Median resident age - Females - Asian
Median resident age - Females - Hispanic or Latino
Median resident age - Females - American Indian and Alaska Native
Median resident age - Females - Multirace
Median resident age - Females - Other Race
Commute - mean travel time to work (minutes)
Travel time to work - Less than 5 minutes (%)
Travel time to work - Less than 5 minutes (% change since 2000)
Travel time to work - 5 to 9 minutes (%)
Travel time to work - 5 to 9 minutes (% change since 2000)
Travel time to work - 10 to 19 minutes (%)
Travel time to work - 10 to 19 minutes (% change since 2000)
Travel time to work - 20 to 29 minutes (%)
Travel time to work - 20 to 29 minutes (% change since 2000)
Travel time to work - 30 to 39 minutes (%)
Travel time to work - 30 to 39 minutes (% change since 2000)
Travel time to work - 40 to 59 minutes (%)
Travel time to work - 40 to 59 minutes (% change since 2000)
Travel time to work - 60 to 89 minutes (%)
Travel time to work - 60 to 89 minutes (% change since 2000)
Travel time to work - 90 or more minutes (%)
Travel time to work - 90 or more minutes (% change since 2000)
Marital status - Never married (%)
Marital status - Now married (%)
Marital status - Separated (%)
Marital status - Widowed (%)
Marital status - Divorced (%)
Median family income ($)
Median family income (% change since 2000)
Median non-family income ($)
Median non-family income (% change since 2000)
Median per capita income ($)
Median per capita income (% change since 2000)
Median family income ($) - White
Median family income ($) - Black or African American
Median family income ($) - Asian
Median family income ($) - Hispanic or Latino
Median family income ($) - American Indian and Alaska Native
Median family income ($) - Multirace
Median family income ($) - Other Race
Median year house/condo built
Median year apartment built
Year house built - Built 2005 or later (%)
Year house built - Built 2000 to 2004 (%)
Year house built - Built 1990 to 1999 (%)
Year house built - Built 1980 to 1989 (%)
Year house built - Built 1970 to 1979 (%)
Year house built - Built 1960 to 1969 (%)
Year house built - Built 1950 to 1959 (%)
Year house built - Built 1940 to 1949 (%)
Year house built - Built 1939 or earlier (%)
Average household size
Household density (households per square mile)
Average household size - White
Average household size - Black or African American
Average household size - Asian
Average household size - Hispanic or Latino
Average household size - American Indian and Alaska Native
Average household size - Multirace
Average household size - Other Race
Occupied housing units (%)
Vacant housing units (%)
Owner occupied housing units (%)
Renter occupied housing units (%)
Vacancy status - For rent (%)
Vacancy status - For sale only (%)
Vacancy status - Rented or sold, not occupied (%)
Vacancy status - For seasonal, recreational, or occasional use (%)
Vacancy status - For migrant workers (%)
Vacancy status - Other vacant (%)
Residents with income below the poverty level (%)
Residents with income below 50% of the poverty level (%)
Children below poverty level (%)
Poor families by family type - Married-couple family (%)
Poor families by family type - Male, no wife present (%)
Poor families by family type - Female, no husband present (%)
Poverty status for native-born residents (%)
Poverty status for foreign-born residents (%)
Poverty among high school graduates not in families (%)
Poverty among people who did not graduate high school not in families (%)
Residents with income below the poverty level (%) - White
Residents with income below the poverty level (%) - Black or African American
Residents with income below the poverty level (%) - Asian
Residents with income below the poverty level (%) - Hispanic or Latino
Residents with income below the poverty level (%) - American Indian and Alaska Native
Residents with income below the poverty level (%) - Multirace
Residents with income below the poverty level (%) - Other Race
Air pollution - Air Quality Index (AQI)
Air pollution - CO
Air pollution - NO2
Air pollution - SO2
Air pollution - Ozone
Air pollution - PM10
Air pollution - PM25
Air pollution - Pb
Crime - Murders per 100,000 population
Crime - Rapes per 100,000 population
Crime - Robberies per 100,000 population
Crime - Assaults per 100,000 population
Crime - Burglaries per 100,000 population
Crime - Thefts per 100,000 population
Crime - Auto thefts per 100,000 population
Crime - Arson per 100,000 population
Crime - City-data.com crime index
Crime - Violent crime index
Crime - Property crime index
Crime - Murders per 100,000 population (5 year average)
Crime - Rapes per 100,000 population (5 year average)
Crime - Robberies per 100,000 population (5 year average)
Crime - Assaults per 100,000 population (5 year average)
Crime - Burglaries per 100,000 population (5 year average)
Crime - Thefts per 100,000 population (5 year average)
Crime - Auto thefts per 100,000 population (5 year average)
Crime - Arson per 100,000 population (5 year average)
Crime - City-data.com crime index (5 year average)
Crime - Violent crime index (5 year average)
Crime - Property crime index (5 year average)
1996 Presidential Elections Results (%) - Democratic Party (Clinton)
1996 Presidential Elections Results (%) - Republican Party (Dole)
1996 Presidential Elections Results (%) - Other
2000 Presidential Elections Results (%) - Democratic Party (Gore)
2000 Presidential Elections Results (%) - Republican Party (Bush)
2000 Presidential Elections Results (%) - Other
2004 Presidential Elections Results (%) - Democratic Party (Kerry)
2004 Presidential Elections Results (%) - Republican Party (Bush)
2004 Presidential Elections Results (%) - Other
2008 Presidential Elections Results (%) - Democratic Party (Obama)
2008 Presidential Elections Results (%) - Republican Party (McCain)
2008 Presidential Elections Results (%) - Other
2012 Presidential Elections Results (%) - Democratic Party (Obama)
2012 Presidential Elections Results (%) - Republican Party (Romney)
2012 Presidential Elections Results (%) - Other
2016 Presidential Elections Results (%) - Democratic Party (Clinton)
2016 Presidential Elections Results (%) - Republican Party (Trump)
2016 Presidential Elections Results (%) - Other
2020 Presidential Elections Results (%) - Democratic Party (Biden)
2020 Presidential Elections Results (%) - Republican Party (Trump)
2020 Presidential Elections Results (%) - Other
Ancestries Reported - Arab (%)
Ancestries Reported - Czech (%)
Ancestries Reported - Danish (%)
Ancestries Reported - Dutch (%)
Ancestries Reported - English (%)
Ancestries Reported - French (%)
Ancestries Reported - French Canadian (%)
Ancestries Reported - German (%)
Ancestries Reported - Greek (%)
Ancestries Reported - Hungarian (%)
Ancestries Reported - Irish (%)
Ancestries Reported - Italian (%)
Ancestries Reported - Lithuanian (%)
Ancestries Reported - Norwegian (%)
Ancestries Reported - Polish (%)
Ancestries Reported - Portuguese (%)
Ancestries Reported - Russian (%)
Ancestries Reported - Scotch-Irish (%)
Ancestries Reported - Scottish (%)
Ancestries Reported - Slovak (%)
Ancestries Reported - Subsaharan African (%)
Ancestries Reported - Swedish (%)
Ancestries Reported - Swiss (%)
Ancestries Reported - Ukrainian (%)
Ancestries Reported - United States (%)
Ancestries Reported - Welsh (%)
Ancestries Reported - West Indian (%)
Ancestries Reported - Other (%)
Educational Attainment - No schooling completed (%)
Educational Attainment - Less than high school (%)
Educational Attainment - High school or equivalent (%)
Educational Attainment - Less than 1 year of college (%)
Educational Attainment - 1 or more years of college (%)
Educational Attainment - Associate degree (%)
Educational Attainment - Bachelor's degree (%)
Educational Attainment - Master's degree (%)
Educational Attainment - Professional school degree (%)
Educational Attainment - Doctorate degree (%)
School Enrollment - Nursery, preschool (%)
School Enrollment - Kindergarten (%)
School Enrollment - Grade 1 to 4 (%)
School Enrollment - Grade 5 to 8 (%)
School Enrollment - Grade 9 to 12 (%)
School Enrollment - College undergrad (%)
School Enrollment - Graduate or professional (%)
School Enrollment - Not enrolled in school (%)
School enrollment - Public schools (%)
School enrollment - Private schools (%)
School enrollment - Not enrolled (%)
Median number of rooms in houses and condos
Median number of rooms in apartments
Housing units lacking complete plumbing facilities (%)
Housing units lacking complete kitchen facilities (%)
Density of houses
Urban houses (%)
Rural houses (%)
Households with people 60 years and over (%)
Households with people 65 years and over (%)
Households with people 75 years and over (%)
Households with one or more nonrelatives (%)
Households with no nonrelatives (%)
Population in households (%)
Family households (%)
Nonfamily households (%)
Population in families (%)
Family households with own children (%)
Median number of bedrooms in owner occupied houses
Mean number of bedrooms in owner occupied houses
Median number of bedrooms in renter occupied houses
Mean number of bedrooms in renter occupied houses
Median number of vehichles in owner occupied houses
Mean number of vehichles in owner occupied houses
Median number of vehichles in renter occupied houses
Mean number of vehichles in renter occupied houses
Mortgage status - with mortgage (%)
Mortgage status - with second mortgage (%)
Mortgage status - with home equity loan (%)
Mortgage status - with both second mortgage and home equity loan (%)
Mortgage status - without a mortgage (%)
Average family size
Average family size - White
Average family size - Black or African American
Average family size - Asian
Average family size - Hispanic or Latino
Average family size - American Indian and Alaska Native
Average family size - Multirace
Average family size - Other Race
Geographical mobility - Same house 1 year ago (%)
Geographical mobility - Moved within same county (%)
Geographical mobility - Moved from different county within same state (%)
Geographical mobility - Moved from different state (%)
Geographical mobility - Moved from abroad (%)
Place of birth - Born in state of residence (%)
Place of birth - Born in other state (%)
Place of birth - Native, outside of US (%)
Place of birth - Foreign born (%)
Housing units in structures - 1, detached (%)
Housing units in structures - 1, attached (%)
Housing units in structures - 2 (%)
Housing units in structures - 3 or 4 (%)
Housing units in structures - 5 to 9 (%)
Housing units in structures - 10 to 19 (%)
Housing units in structures - 20 to 49 (%)
Housing units in structures - 50 or more (%)
Housing units in structures - Mobile home (%)
Housing units in structures - Boat, RV, van, etc. (%)
House/condo owner moved in on average (years ago)
Renter moved in on average (years ago)
Year householder moved into unit - Moved in 1999 to March 2000 (%)
Year householder moved into unit - Moved in 1995 to 1998 (%)
Year householder moved into unit - Moved in 1990 to 1994 (%)
Year householder moved into unit - Moved in 1980 to 1989 (%)
Year householder moved into unit - Moved in 1970 to 1979 (%)
Year householder moved into unit - Moved in 1969 or earlier (%)
Means of transportation to work - Drove car alone (%)
Means of transportation to work - Carpooled (%)
Means of transportation to work - Public transportation (%)
Means of transportation to work - Bus or trolley bus (%)
Means of transportation to work - Streetcar or trolley car (%)
Means of transportation to work - Subway or elevated (%)
Means of transportation to work - Railroad (%)
Means of transportation to work - Ferryboat (%)
Means of transportation to work - Taxicab (%)
Means of transportation to work - Motorcycle (%)
Means of transportation to work - Bicycle (%)
Means of transportation to work - Walked (%)
Means of transportation to work - Other means (%)
Working at home (%)
Industry diversity
Most Common Industries - Agriculture, forestry, fishing and hunting, and mining (%)
Most Common Industries - Agriculture, forestry, fishing and hunting (%)
Most Common Industries - Mining, quarrying, and oil and gas extraction (%)
Most Common Industries - Construction (%)
Most Common Industries - Manufacturing (%)
Most Common Industries - Wholesale trade (%)
Most Common Industries - Retail trade (%)
Most Common Industries - Transportation and warehousing, and utilities (%)
Most Common Industries - Transportation and warehousing (%)
Most Common Industries - Utilities (%)
Most Common Industries - Information (%)
Most Common Industries - Finance and insurance, and real estate and rental and leasing (%)
Most Common Industries - Finance and insurance (%)
Most Common Industries - Real estate and rental and leasing (%)
Most Common Industries - Professional, scientific, and management, and administrative and waste management services (%)
Most Common Industries - Professional, scientific, and technical services (%)
Most Common Industries - Management of companies and enterprises (%)
Most Common Industries - Administrative and support and waste management services (%)
Most Common Industries - Educational services, and health care and social assistance (%)
Most Common Industries - Educational services (%)
Most Common Industries - Health care and social assistance (%)
Most Common Industries - Arts, entertainment, and recreation, and accommodation and food services (%)
Most Common Industries - Arts, entertainment, and recreation (%)
Most Common Industries - Accommodation and food services (%)
Most Common Industries - Other services, except public administration (%)
Most Common Industries - Public administration (%)
Occupation diversity
Most Common Occupations - Management, business, science, and arts occupations (%)
Most Common Occupations - Management, business, and financial occupations (%)
Most Common Occupations - Management occupations (%)
Most Common Occupations - Business and financial operations occupations (%)
Most Common Occupations - Computer, engineering, and science occupations (%)
Most Common Occupations - Computer and mathematical occupations (%)
Most Common Occupations - Architecture and engineering occupations (%)
Most Common Occupations - Life, physical, and social science occupations (%)
Most Common Occupations - Education, legal, community service, arts, and media occupations (%)
Most Common Occupations - Community and social service occupations (%)
Most Common Occupations - Legal occupations (%)
Most Common Occupations - Education, training, and library occupations (%)
Most Common Occupations - Arts, design, entertainment, sports, and media occupations (%)
Most Common Occupations - Healthcare practitioners and technical occupations (%)
Most Common Occupations - Health diagnosing and treating practitioners and other technical occupations (%)
Most Common Occupations - Health technologists and technicians (%)
Most Common Occupations - Service occupations (%)
Most Common Occupations - Healthcare support occupations (%)
Most Common Occupations - Protective service occupations (%)
Most Common Occupations - Fire fighting and prevention, and other protective service workers including supervisors (%)
Most Common Occupations - Law enforcement workers including supervisors (%)
Most Common Occupations - Food preparation and serving related occupations (%)
Most Common Occupations - Building and grounds cleaning and maintenance occupations (%)
Most Common Occupations - Personal care and service occupations (%)
Most Common Occupations - Sales and office occupations (%)
Most Common Occupations - Sales and related occupations (%)
Most Common Occupations - Office and administrative support occupations (%)
Most Common Occupations - Natural resources, construction, and maintenance occupations (%)
Most Common Occupations - Farming, fishing, and forestry occupations (%)
Most Common Occupations - Construction and extraction occupations (%)
Most Common Occupations - Installation, maintenance, and repair occupations (%)
Most Common Occupations - Production, transportation, and material moving occupations (%)
Most Common Occupations - Production occupations (%)
Most Common Occupations - Transportation occupations (%)
Most Common Occupations - Material moving occupations (%)
People in Group quarters - Institutionalized population (%)
People in Group quarters - Correctional institutions (%)
People in Group quarters - Federal prisons and detention centers (%)
People in Group quarters - Halfway houses (%)
People in Group quarters - Local jails and other confinement facilities (including police lockups) (%)
People in Group quarters - Military disciplinary barracks (%)
People in Group quarters - State prisons (%)
People in Group quarters - Other types of correctional institutions (%)
People in Group quarters - Nursing homes (%)
People in Group quarters - Hospitals/wards, hospices, and schools for the handicapped (%)
People in Group quarters - Hospitals/wards and hospices for chronically ill (%)
People in Group quarters - Hospices or homes for chronically ill (%)
People in Group quarters - Military hospitals or wards for chronically ill (%)
People in Group quarters - Other hospitals or wards for chronically ill (%)
People in Group quarters - Hospitals or wards for drug/alcohol abuse (%)
People in Group quarters - Mental (Psychiatric) hospitals or wards (%)
People in Group quarters - Schools, hospitals, or wards for the mentally retarded (%)
People in Group quarters - Schools, hospitals, or wards for the physically handicapped (%)
People in Group quarters - Institutions for the deaf (%)
People in Group quarters - Institutions for the blind (%)
People in Group quarters - Orthopedic wards and institutions for the physically handicapped (%)
People in Group quarters - Wards in general hospitals for patients who have no usual home elsewhere (%)
People in Group quarters - Wards in military hospitals for patients who have no usual home elsewhere (%)
People in Group quarters - Juvenile institutions (%)
People in Group quarters - Long-term care (%)
People in Group quarters - Homes for abused, dependent, and neglected children (%)
People in Group quarters - Residential treatment centers for emotionally disturbed children (%)
People in Group quarters - Training schools for juvenile delinquents (%)
People in Group quarters - Short-term care, detention or diagnostic centers for delinquent children (%)
People in Group quarters - Type of juvenile institution unknown (%)
People in Group quarters - Noninstitutionalized population (%)
People in Group quarters - College dormitories (includes college quarters off campus) (%)
People in Group quarters - Military quarters (%)
People in Group quarters - On base (%)
People in Group quarters - Barracks, unaccompanied personnel housing (UPH), (Enlisted/Officer), ;and similar group living quarters for military personnel (%)
People in Group quarters - Transient quarters for temporary residents (%)
People in Group quarters - Military ships (%)
People in Group quarters - Group homes (%)
People in Group quarters - Homes or halfway houses for drug/alcohol abuse (%)
People in Group quarters - Homes for the mentally ill (%)
People in Group quarters - Homes for the mentally retarded (%)
People in Group quarters - Homes for the physically handicapped (%)
People in Group quarters - Other group homes (%)
People in Group quarters - Religious group quarters (%)
People in Group quarters - Dormitories (%)
People in Group quarters - Agriculture workers' dormitories on farms (%)
People in Group quarters - Job Corps and vocational training facilities (%)
People in Group quarters - Other workers' dormitories (%)
People in Group quarters - Crews of maritime vessels (%)
People in Group quarters - Other nonhousehold living situations (%)
People in Group quarters - Other noninstitutional group quarters (%)
Residents speaking English at home (%)
Residents speaking English at home - Born in the United States (%)
Residents speaking English at home - Native, born elsewhere (%)
Residents speaking English at home - Foreign born (%)
Residents speaking Spanish at home (%)
Residents speaking Spanish at home - Born in the United States (%)
Residents speaking Spanish at home - Native, born elsewhere (%)
Residents speaking Spanish at home - Foreign born (%)
Residents speaking other language at home (%)
Residents speaking other language at home - Born in the United States (%)
Residents speaking other language at home - Native, born elsewhere (%)
Residents speaking other language at home - Foreign born (%)
Class of Workers - Employee of private company (%)
Class of Workers - Self-employed in own incorporated business (%)
Class of Workers - Private not-for-profit wage and salary workers (%)
Class of Workers - Local government workers (%)
Class of Workers - State government workers (%)
Class of Workers - Federal government workers (%)
Class of Workers - Self-employed workers in own not incorporated business and Unpaid family workers (%)
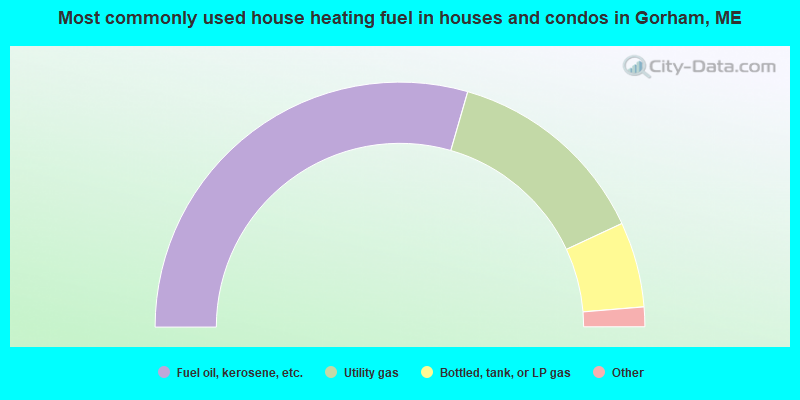
House heating fuel used in houses and condos - Utility gas (%)
House heating fuel used in houses and condos - Bottled, tank, or LP gas (%)
House heating fuel used in houses and condos - Electricity (%)
House heating fuel used in houses and condos - Fuel oil, kerosene, etc. (%)
House heating fuel used in houses and condos - Coal or coke (%)
House heating fuel used in houses and condos - Wood (%)
House heating fuel used in houses and condos - Solar energy (%)
House heating fuel used in houses and condos - Other fuel (%)
House heating fuel used in houses and condos - No fuel used (%)
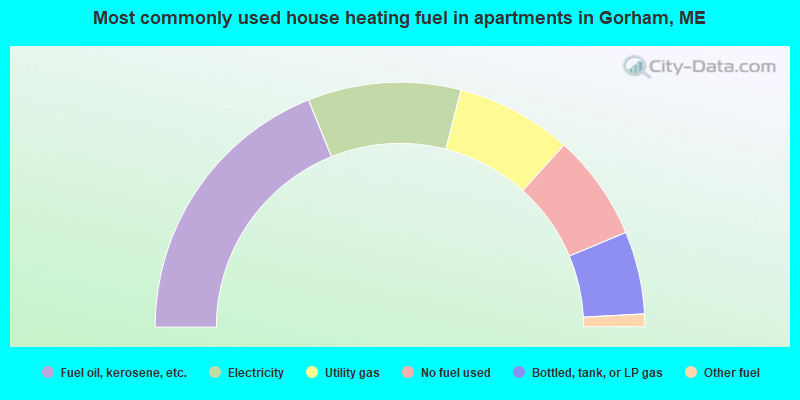
House heating fuel used in apartments - Utility gas (%)
House heating fuel used in apartments - Bottled, tank, or LP gas (%)
House heating fuel used in apartments - Electricity (%)
House heating fuel used in apartments - Fuel oil, kerosene, etc. (%)
House heating fuel used in apartments - Coal or coke (%)
House heating fuel used in apartments - Wood (%)
House heating fuel used in apartments - Solar energy (%)
House heating fuel used in apartments - Other fuel (%)
House heating fuel used in apartments - No fuel used (%)
Armed forces status - In Armed Forces (%)
Armed forces status - Civilian (%)
Armed forces status - Civilian - Veteran (%)
Armed forces status - Civilian - Nonveteran (%)
Fatal accidents locations in years 2005-2021
Fatal accidents locations in 2005
Fatal accidents locations in 2006
Fatal accidents locations in 2007
Fatal accidents locations in 2008
Fatal accidents locations in 2009
Fatal accidents locations in 2010
Fatal accidents locations in 2011
Fatal accidents locations in 2012
Fatal accidents locations in 2013
Fatal accidents locations in 2014
Fatal accidents locations in 2015
Fatal accidents locations in 2016
Fatal accidents locations in 2017
Fatal accidents locations in 2018
Fatal accidents locations in 2019
Fatal accidents locations in 2020
Fatal accidents locations in 2021
Alcohol use - People drinking some alcohol every month (%)
Alcohol use - People not drinking at all (%)
Alcohol use - Average days/month drinking alcohol
Alcohol use - Average drinks/week
Alcohol use - Average days/year people drink much
Audiometry - Average condition of hearing (%)
Audiometry - People that can hear a whisper from across a quiet room (%)
Audiometry - People that can hear normal voice from across a quiet room (%)
Audiometry - Ears ringing, roaring, buzzing (%)
Audiometry - Had a job exposure to loud noise (%)
Audiometry - Had off-work exposure to loud noise (%)
Blood Pressure & Cholesterol - Has high blood pressure (%)
Blood Pressure & Cholesterol - Checking blood pressure at home (%)
Blood Pressure & Cholesterol - Frequently checking blood cholesterol (%)
Blood Pressure & Cholesterol - Has high cholesterol level (%)
Consumer Behavior - Money monthly spent on food at supermarket/grocery store
Consumer Behavior - Money monthly spent on food at other stores
Consumer Behavior - Money monthly spent on eating out
Consumer Behavior - Money monthly spent on carryout/delivered foods
Consumer Behavior - Income spent on food at supermarket/grocery store (%)
Consumer Behavior - Income spent on food at other stores (%)
Consumer Behavior - Income spent on eating out (%)
Consumer Behavior - Income spent on carryout/delivered foods (%)
Current Health Status - General health condition (%)
Current Health Status - Blood donors (%)
Current Health Status - Has blood ever tested for HIV virus (%)
Current Health Status - Left-handed people (%)
Dermatology - People using sunscreen (%)
Diabetes - Diabetics (%)
Diabetes - Had a blood test for high blood sugar (%)
Diabetes - People taking insulin (%)
Diet Behavior & Nutrition - Diet health (%)
Diet Behavior & Nutrition - Milk product consumption (# of products/month)
Diet Behavior & Nutrition - Meals not home prepared (#/week)
Diet Behavior & Nutrition - Meals from fast food or pizza place (#/week)
Diet Behavior & Nutrition - Ready-to-eat foods (#/month)
Diet Behavior & Nutrition - Frozen meals/pizza (#/month)
Drug Use - People that ever used marijuana or hashish (%)
Drug Use - Ever used hard drugs (%)
Drug Use - Ever used any form of cocaine (%)
Drug Use - Ever used heroin (%)
Drug Use - Ever used methamphetamine (%)
Health Insurance - People covered by health insurance (%)
Kidney Conditions-Urology - Avg. # of times urinating at night
Medical Conditions - People with asthma (%)
Medical Conditions - People with anemia (%)
Medical Conditions - People with psoriasis (%)
Medical Conditions - People with overweight (%)
Medical Conditions - Elderly people having difficulties in thinking or remembering (%)
Medical Conditions - People who ever received blood transfusion (%)
Medical Conditions - People having trouble seeing even with glass/contacts (%)
Medical Conditions - People with arthritis (%)
Medical Conditions - People with gout (%)
Medical Conditions - People with congestive heart failure (%)
Medical Conditions - People with coronary heart disease (%)
Medical Conditions - People with angina pectoris (%)
Medical Conditions - People who ever had heart attack (%)
Medical Conditions - People who ever had stroke (%)
Medical Conditions - People with emphysema (%)
Medical Conditions - People with thyroid problem (%)
Medical Conditions - People with chronic bronchitis (%)
Medical Conditions - People with any liver condition (%)
Medical Conditions - People who ever had cancer or malignancy (%)
Mental Health - People who have little interest in doing things (%)
Mental Health - People feeling down, depressed, or hopeless (%)
Mental Health - People who have trouble sleeping or sleeping too much (%)
Mental Health - People feeling tired or having little energy (%)
Mental Health - People with poor appetite or overeating (%)
Mental Health - People feeling bad about themself (%)
Mental Health - People who have trouble concentrating on things (%)
Mental Health - People moving or speaking slowly or too fast (%)
Mental Health - People having thoughts they would be better off dead (%)
Oral Health - Average years since last visit a dentist
Oral Health - People embarrassed because of mouth (%)
Oral Health - People with gum disease (%)
Oral Health - General health of teeth and gums (%)
Oral Health - Average days a week using dental floss/device
Oral Health - Average days a week using mouthwash for dental problem
Oral Health - Average number of teeth
Pesticide Use - Households using pesticides to control insects (%)
Pesticide Use - Households using pesticides to kill weeds (%)
Physical Activity - People doing vigorous-intensity work activities (%)
Physical Activity - People doing moderate-intensity work activities (%)
Physical Activity - People walking or bicycling (%)
Physical Activity - People doing vigorous-intensity recreational activities (%)
Physical Activity - People doing moderate-intensity recreational activities (%)
Physical Activity - Average hours a day doing sedentary activities
Physical Activity - Average hours a day watching TV or videos
Physical Activity - Average hours a day using computer
Physical Functioning - People having limitations keeping them from working (%)
Physical Functioning - People limited in amount of work they can do (%)
Physical Functioning - People that need special equipment to walk (%)
Physical Functioning - People experiencing confusion/memory problems (%)
Physical Functioning - People requiring special healthcare equipment (%)
Prescription Medications - Average number of prescription medicines taking
Preventive Aspirin Use - Adults 40+ taking low-dose aspirin (%)
Reproductive Health - Vaginal deliveries (%)
Reproductive Health - Cesarean deliveries (%)
Reproductive Health - Deliveries resulted in a live birth (%)
Reproductive Health - Pregnancies resulted in a delivery (%)
Reproductive Health - Women breastfeeding newborns (%)
Reproductive Health - Women that had a hysterectomy (%)
Reproductive Health - Women that had both ovaries removed (%)
Reproductive Health - Women that have ever taken birth control pills (%)
Reproductive Health - Women taking birth control pills (%)
Reproductive Health - Women that have ever used Depo-Provera or injectables (%)
Reproductive Health - Women that have ever used female hormones (%)
Sexual Behavior - People 18+ that ever had sex (vaginal, anal, or oral) (%)
Sexual Behavior - Males 18+ that ever had vaginal sex with a woman (%)
Sexual Behavior - Males 18+ that ever performed oral sex on a woman (%)
Sexual Behavior - Males 18+ that ever had anal sex with a woman (%)
Sexual Behavior - Males 18+ that ever had any sex with a man (%)
Sexual Behavior - Females 18+ that ever had vaginal sex with a man (%)
Sexual Behavior - Females 18+ that ever performed oral sex on a man (%)
Sexual Behavior - Females 18+ that ever had anal sex with a man (%)
Sexual Behavior - Females 18+ that ever had any kind of sex with a woman (%)
Sexual Behavior - Average age people first had sex
Sexual Behavior - Average number of female sex partners in lifetime (males 18+)
Sexual Behavior - Average number of female vaginal sex partners in lifetime (males 18+)
Sexual Behavior - Average age people first performed oral sex on a woman (18+)
Sexual Behavior - Average number of woman performed oral sex on in lifetime (18+)
Sexual Behavior - Average number of male sex partners in lifetime (males 18+)
Sexual Behavior - Average number of male anal sex partners in lifetime (males 18+)
Sexual Behavior - Average age people first performed oral sex on a man (18+)
Sexual Behavior - Average number of male oral sex partners in lifetime (18+)
Sexual Behavior - People using protection when performing oral sex (%)
Sexual Behavior - Average number of times people have vaginal or anal sex a year
Sexual Behavior - People having sex without condom (%)
Sexual Behavior - Average number of male sex partners in lifetime (females 18+)
Sexual Behavior - Average number of male vaginal sex partners in lifetime (females 18+)
Sexual Behavior - Average number of female sex partners in lifetime (females 18+)
Sexual Behavior - Circumcised males 18+ (%)
Sleep Disorders - Average hours sleeping at night
Sleep Disorders - People that has trouble sleeping (%)
Smoking-Cigarette Use - People smoking cigarettes (%)
Taste & Smell - People 40+ having problems with smell (%)
Taste & Smell - People 40+ having problems with taste (%)
Taste & Smell - People 40+ that ever had wisdom teeth removed (%)
Taste & Smell - People 40+ that ever had tonsils teeth removed (%)
Taste & Smell - People 40+ that ever had a loss of consciousness because of a head injury (%)
Taste & Smell - People 40+ that ever had a broken nose or other serious injury to face or skull (%)
Taste & Smell - People 40+ that ever had two or more sinus infections (%)
Weight - Average height (inches)
Weight - Average weight (pounds)
Weight - Average BMI
Weight - People that are obese (%)
Weight - People that ever were obese (%)
Weight - People trying to lose weight (%)
According to our research of Maine and other state lists, there were 9 registered sex offenders living in Gorham, Maine as of May 21, 2024 . The ratio of all residents to sex offenders in Gorham is 713 to 1.The ratio of registered sex offenders to all residents in this city is lower than the state average.
Officers per 1,000 residents here:
1.21Maine average:
1.71
Latest news from Gorham, ME collected exclusively by city-data.com from local newspapers, TV, and radio stations
Ancestries: Irish (23.2%), English (9.9%), French Canadian (8.4%), French (6.1%), American (5.7%), Italian (5.3%).
Current Local Time:
Incorporated on 10/30/1764
Land area: 5.41 square miles.
Population density: 1,272 people per square mile (low).
503 residents are foreign born (2.6% Asia , 2.4% Europe , 1.1% Latin America , 0.8% Africa ).
This place:
7.0%Maine:
3.8%
Median real estate property taxes paid for housing units with mortgages in 2022: $4,324 (0.9%)Median real estate property taxes paid for housing units with no mortgage in 2022: $6,170 (1.1%)
Nearest city with pop. 50,000+: Portland, ME
Nearest city with pop. 200,000+: Boston, MA
Nearest city with pop. 1,000,000+: Bronx, NY
Nearest cities:
Latitude: 43.68 N, Longitude: 70.44 W
Daytime population change due to commuting: +97 (+1.4%)Workers who live and work in this place: 1,588 (38.4%)
Single-family new house construction building permits:
2022: 76 buildings , average cost: $272,0002021: 56 buildings , average cost: $263,8002020: 52 buildings , average cost: $238,6002019: 54 buildings , average cost: $213,4002018: 89 buildings , average cost: $197,5002017: 123 buildings , average cost: $181,9002016: 78 buildings , average cost: $211,1002015: 89 buildings , average cost: $185,8002014: 76 buildings , average cost: $181,9002013: 67 buildings , average cost: $172,0002012: 69 buildings , average cost: $182,2002011: 57 buildings , average cost: $151,4002010: 53 buildings , average cost: $136,4002009: 40 buildings , average cost: $164,8002008: 30 buildings , average cost: $172,1002007: 68 buildings , average cost: $192,8002006: 69 buildings , average cost: $198,7002005: 126 buildings , average cost: $172,1002004: 100 buildings , average cost: $175,1002003: 89 buildings , average cost: $140,8002002: 195 buildings , average cost: $145,6002001: 139 buildings , average cost: $130,2002000: 105 buildings , average cost: $108,6001999: 101 buildings , average cost: $113,3001998: 98 buildings , average cost: $102,7001997: 82 buildings , average cost: $107,600Unemployment in December 2023:
Most common occupations in Gorham, ME (%)
Both Males Females
Other office and administrative support workers, including supervisors (7.5%)
Retail sales workers, except cashiers (6.0%)
Other management occupations, except farmers and farm managers (5.2%)
Cashiers (4.3%)
Child care workers (3.0%)
Material recording, scheduling, dispatching, and distributing workers (3.0%)
Waiters and waitresses (2.9%)
Other management occupations, except farmers and farm managers (7.2%)
Other office and administrative support workers, including supervisors (5.9%)
Material recording, scheduling, dispatching, and distributing workers (4.6%)
Retail sales workers, except cashiers (4.5%)
Metal workers and plastic workers (4.4%)
Engineers (4.2%)
Laborers and material movers, hand (4.2%)
Other office and administrative support workers, including supervisors (8.9%)
Retail sales workers, except cashiers (7.4%)
Cashiers (6.3%)
Child care workers (5.9%)
Waiters and waitresses (4.8%)
Accountants and auditors (4.7%)
Other sales and related occupations, including supervisors (4.5%)
Tornado activity:
Gorham-area historical tornado activity is above Maine state average. It is 75% smaller than the overall U.S. average.
On 10/10/1966, a category F2 (max. wind speeds 113-157 mph) tornado 24.3 miles away from the Gorham place center caused between $5000 and $50,000 in damages.
On 5/14/1963, a category F2 tornado 34.5 miles away from the place center caused between $5000 and $50,000 in damages.
Earthquake activity:
Gorham-area historical earthquake activity is significantly above Maine state average. It is 74% smaller than the overall U.S. average. On 10/16/2012 at 23:12:25, a magnitude 4.7 (4.7 ML, Depth: 10.0 mi, Class: Light, Intensity: IV - V) earthquake occurred 12.2 miles away from the city center On 4/20/2002 at 10:50:47, a magnitude 5.3 (5.3 ML, Depth: 3.0 mi, Class: Moderate, Intensity: VI - VII) earthquake occurred 171.6 miles away from the city center On 1/19/1982 at 00:14:42, a magnitude 4.7 (4.5 MB, 4.7 MD, 4.5 LG) earthquake occurred 59.4 miles away from the city center On 4/20/2002 at 10:50:47, a magnitude 5.2 (5.2 MB, 4.2 MS, 5.2 MW, 5.0 MW) earthquake occurred 172.1 miles away from Gorham center On 10/7/1983 at 10:18:46, a magnitude 5.3 (5.1 MB, 5.3 LG, 5.1 ML) earthquake occurred 195.6 miles away from Gorham center On 8/21/1996 at 07:54:14, a magnitude 3.8 (3.8 LG, 3.6 LG, Depth: 6.2 mi, Class: Light, Intensity: II - III) earthquake occurred 57.2 miles away from the city center Magnitude types: regional Lg-wave magnitude (LG), body-wave magnitude (MB), duration magnitude (MD), local magnitude (ML), surface-wave magnitude (MS), moment magnitude (MW) Natural disasters: The number of natural disasters in Cumberland County (33) is a lot greater than the US average (15).Major Disasters (Presidential) Declared: 22Emergencies Declared: 10Floods: 19, Storms: 13, Snows: 7, Winter Storms: 6, Heavy Rains: 3, Hurricanes: 3, Winds: 3, Blizzard: 1, Ice Storm: 1, Mudslide: 1, Snowfall: 1, Snowstorm: 1, Tornado: 1, Other: 2 (Note: some incidents may be assigned to more than one category). Hospitals and medical centers in Gorham: GORHAM HEALTH CENTER (30 NEW PORTLAND RD)
GORHAM HOUSE (50 NEW PORTLAND RD)
Other hospitals and medical centers near Gorham: SPRINGBROOK CENTER (Nursing Home, about 5 miles away; WESTBROOK, ME)
WESTBROOK COMMUNITY HOSPITAL (Hospital, about 5 miles away; WESTBROOK, ME)
CASCO BAY DIALYSIS FACILITY (Dialysis Facility, about 6 miles away; WESTBROOK, ME)
BARRON CENTER (Nursing Home, about 6 miles away; PORTLAND, ME)
ALLEGIANCE HOSPICE AND PALLATIVE CARE OF MAINE (Hospital, about 7 miles away; SO PORTLAND, ME)
V N A AND HOSPICE OF SOUTH PORTLAND (Hospital, about 7 miles away; PORTLAND, ME)
V N A HOME HEALTH AND HOSPICE (Home Health Center, about 7 miles away; SO PORTLAND, ME)
Amtrak stations near Gorham: 8 miles: PORTLAND (100 THOMPSON POINT ROAD) Services: ticket office, enclosed waiting area, public restrooms, public payphones, ATM.
13 miles: OLD ORCHARD BEACH (11 FIRST ST.) - Seasonal Station Services: ticket office, public payphones.
13 miles: SACO (130 MAIN ST.) Services: ticket office.
Colleges/universities with over 2000 students nearest to Gorham:
University of Southern Maine (about 9 miles; Portland, ME ; Full-time enrollment: 6,647)
Saint Joseph's College of Maine (about 11 miles; Standish, ME ; FT enrollment: 2,010)
Southern Maine Community College (about 11 miles; South Portland, ME ; FT enrollment: 4,666)
University of New England (about 16 miles; Biddeford, ME ; FT enrollment: 4,539)
University of New Hampshire-Main Campus (about 46 miles; Durham, NH ; FT enrollment: 15,243)
University of Maine at Augusta (about 56 miles; Augusta, ME ; FT enrollment: 3,204)
Plymouth State University (about 63 miles; Plymouth, NH ; FT enrollment: 4,838)
Public high school in Gorham:
Public elementary/middle schools in Gorham:
See full list of schools located in Gorham Libraries in Gorham: BAXTER MEMORIAL LIBRARY Operating income: $431,719; Location: 71 SOUTH STREET; 28,350 books ; 1,413 audio materials ; 1,387 video materials ; 52 other licensed databases ; 124 print serial subscriptions )
NORTH GORHAM PUBLIC LIBRARY Operating income: $15,065; Location: 2 STANDISH NECK ROAD; 9,104 books ; 549 audio materials ; 429 video materials ; 52 other licensed databases ; 13 print serial subscriptions )
SOUTH WINDHAM PUBLIC LIBRARY Operating income: $3,600; Location: 857 GRAY ROAD; 68,737 books ; 35 video materials )
Notable locations in Gorham: (A) , Bailey Hall (B) , Brooks Student Center (C) , Corthell Hall (D) , Dickey Wood Hall (E) , Gorham Town Hall (F) , John Mitchell Center (G) , McLellan House (H) , Maine Forestry Service (I) , Warren Hill Gymnasium (J) , Gorham Fire Rescue Central Station (K) , Upton-Hastings Hall (L) , Woodward Hall (M) , Russell Hall (N) , Robie-Andrews Hall (O) , Presidents House (P) . Display/hide their locations on the map
Shopping Center: (1) . Display/hide its location on the map
Churches in Gorham include: (A) , School Street United Methodist Church (B) , Gorham Christian Assembly Church (C) , First Parish Congregational Church (D) . Display/hide their locations on the map
Cemeteries: (1) , Fort Hill Cemetery (2) . Display/hide their locations on the map
Parks in Gorham include: (1) , Gorham Campus Historic District (2) . Display/hide their locations on the map
Hotel:
Birthplace of: Ellen G. White - Author and co-founder of the Seventh-day Adventist Church, Edwin Hall - Physicist, Charles Davis Jameson - General.
Cumberland County has a predicted average indoor radon screening level greater than 4 pCi/L (pico curies per liter) - Highest Potential Drinking water stations with addresses in Gorham and their reported violations in the past:
FRIENDLY VILLAGE OF GORHAM MHP (Population served: 760, Groundwater):
Past monitoring violations:
9 regular monitoring violations
Population served: 120, Groundwater):
Past monitoring violations:
8 routine major monitoring violations
11 regular monitoring violations
Population served: 80, Groundwater):
Past health violations:
MCL, Monthly (TCR) - In AUG-2013, Contaminant: Coliform. Follow-up actions: St Public Notif requested (AUG-26-2013), St Formal NOV issued (AUG-26-2013), St Public Notif received (AUG-29-2013), St Compliance achieved (OCT-28-2013)
Population served: 45, Groundwater):
Past health violations:
MCL, Monthly (TCR) - In OCT-2012, Contaminant: Coliform. Follow-up actions: St Public Notif requested (NOV-05-2012), St Formal NOV issued (NOV-05-2012), St Compliance achieved (NOV-26-2012), St Public Notif received (JAN-16-2013)
MCL, Monthly (TCR) - In SEP-2012, Contaminant: Coliform. Follow-up actions: St Public Notif requested (SEP-28-2012), St Formal NOV issued (SEP-28-2012), St Public Notif received (OCT-19-2012), St Compliance achieved (NOV-26-2012)
MCL, Monthly (TCR) - In JUL-2011, Contaminant: Coliform. Follow-up actions: St Public Notif requested (JUL-19-2011), St Formal NOV issued (JUL-19-2011), St Compliance achieved (AUG-25-2011), St Public Notif received (OCT-19-2012)
MCL, Monthly (TCR) - Between APR-2008 and JUN-2008, Contaminant: Coliform. Follow-up actions: St Public Notif requested (JUL-02-2008), St Formal NOV issued (JUL-02-2008), St Public Notif received (JUL-28-2008), St Compliance achieved (SEP-07-2011), St Intentional no-action (SEP-09-2011)
Past monitoring violations:
Follow-up Or Routine LCR Tap M/R - In OCT-01-2009, Contaminant: Lead and Copper Rule. Follow-up actions: St Public Notif requested (MAY-05-2010), St Formal NOV issued (MAY-05-2010), St Compliance achieved (AUG-29-2011), St Intentional no-action (SEP-09-2011)
Follow-up Or Routine LCR Tap M/R - In OCT-01-2008, Contaminant: Lead and Copper Rule. Follow-up actions: St Public Notif requested (FEB-13-2009), St Formal NOV issued (FEB-13-2009), St Compliance achieved (AUG-29-2011), St Intentional no-action (SEP-09-2011)
6 routine major monitoring violations
Population served: 42, Groundwater):
Past monitoring violations:
14 routine major monitoring violations
One minor monitoring violation
2 regular monitoring violations
Population served: 25, Groundwater):
Past monitoring violations:
8 routine major monitoring violations
3 regular monitoring violations
Population served: 25, Groundwater):
Past monitoring violations:
Monitoring, Source Water (GWR) - In SEP-2012, Contaminant: E. COLI. Follow-up actions: St Public Notif requested (NOV-01-2012), St Formal NOV issued (NOV-01-2012), St Public Notif received (SEP-26-2013)
Monitoring, Repeat Major (TCR) - In AUG-2012, Contaminant: Coliform (TCR). Follow-up actions: St Public Notif requested (SEP-25-2012), St Formal NOV issued (SEP-25-2012), St Compliance achieved (JUL-16-2013), St Public Notif received (SEP-26-2013)
9 routine major monitoring violations
One minor monitoring violation
37 regular monitoring violations
Drinking water stations with addresses in Gorham that have no violations reported:
DINGLEY SPRING ESTATES (Population served: 90, Primary Water Source Type: Groundwater)
Average household size: This place:
2.4 peopleMaine:
2.3 people
Percentage of family households: This place:
63.7%Whole state:
62.9%
Percentage of households with unmarried partners: This place:
6.3%Whole state:
9.4%
Likely homosexual households (counted as self-reported same-sex unmarried-partner households)
Lesbian couples: 0.7% of all households Gay men: 0.6% of all households
People in group quarters in Gorham in 2010:
1,384 people in college/university student housing
167 people in nursing facilities/skilled-nursing facilities
6 people in residential treatment centers for adults
People in group quarters in Gorham in 2000:
1,038 people in college dormitories (includes college quarters off campus)
65 people in nursing homes
6 people in other noninstitutional group quarters
2 people in homes for the mentally retarded
Banks with branches in Gorham (2011 data):
Gorham Savings Bank: Call C En T Er Branch at 10 Wentworth Drive, branch established on 1999/12/22; at 64 Main Street, branch established on 1868/01/01. Info updated 2008/07/29: Bank assets: $912.7 mil, Deposits: $640.1 mil, local headquarters , positive income , Commercial Lending Specialization, 11 total offices , Holding Company: Gorham Bancorp, Mhc
TD Bank, National Association: Gorham Branch at 95 Main Street, branch established on 2005/11/14. Info updated 2010/10/04: Bank assets: $188,912.6 mil, Deposits: $153,149.8 mil, headquarters in Wilmington, DE, positive income , 1314 total offices , Holding Company: Toronto-Dominion Bank, The
Norway Savings Bank: Gorham Branch at 65 Main Street, branch established on 2005/03/07. Info updated 2006/11/03: Bank assets: $958.8 mil, Deposits: $711.3 mil, headquarters in Norway, ME, positive income , Commercial Lending Specialization, 20 total offices , Holding Company: Norway Bancorp, Mhc
KeyBank National Association: Gorham Branch at 45 Main Street, branch established on 1957/12/20. Info updated 2008/03/03: Bank assets: $86,198.8 mil, Deposits: $64,214.8 mil, headquarters in Cleveland, OH, positive income , Commercial Lending Specialization, 1067 total offices , Holding Company: Keycorp
For population 15 years and over in Gorham:
Never married: 41.7%Now married: 40.1%Separated: 0.0%Widowed: 7.7%Divorced: 10.5% For population 25 years and over in Gorham:
High school or higher: 98.0%Bachelor's degree or higher: 47.6%Graduate or professional degree: 14.1%Unemployed: 13.9%Mean travel time to work (commute): 23.5 minutes
Education Gini index (Inequality in education) Here:
8.5Maine average:
10.3
Religion statistics for Gorham, ME (based on Cumberland County data)
Religion Adherents Congregations Catholic 38,243 19 Mainline Protestant 22,030 96 Evangelical Protestant 12,007 85 Other 7,187 44 Orthodox 500 1 Black Protestant 285 2 None 201,422 -
Source: Clifford Grammich, Kirk Hadaway, Richard Houseal, Dale E.Jones, Alexei Krindatch, Richie Stanley and Richard H.Taylor. 2012. 2010 U.S.Religion Census: Religious Congregations & Membership Study. Association of Statisticians of American Religious Bodies. Jones, Dale E., et al. 2002. Congregations and Membership in the United States 2000. Nashville, TN: Glenmary Research Center. Graphs represent county-level data
Food Environment Statistics: Number of grocery stores : 72This county :
2.62 / 10,000 pop.Maine :
2.80 / 10,000 pop.
Number of supercenters and club stores : 3This county :
0.11 / 10,000 pop.State :
0.14 / 10,000 pop.
Number of convenience stores (no gas) : 67This county :
2.44 / 10,000 pop.Maine :
2.20 / 10,000 pop.
Number of convenience stores (with gas) : 105Cumberland County :
3.82 / 10,000 pop.Maine :
5.75 / 10,000 pop.
Number of full-service restaurants : 330This county :
12.01 / 10,000 pop.State :
11.02 / 10,000 pop.
Adult diabetes rate : Cumberland County :
7.1%Maine :
8.2%
Adult obesity rate : Cumberland County :
19.5%State :
25.0%
Health and Nutrition:
Average overall health of teeth and gums : People feeling badly about themselves : People not drinking alcohol at all : Average hours sleeping at night : General health condition : Average condition of hearing : More about Health and Nutrition of Gorham, ME Residents
Businesses in Gorham, ME
Name Count Name Count
7-Eleven 1 FedEx 1 AT&T 1 GNC 1 Ace Hardware 1 Goodwill 1 Burger King 1 H&R Block 1 Curves 1 MasterBrand Cabinets 2 Decora Cabinetry 2 Rite Aid 1 Domino's Pizza 1 Subway 1 Dunkin Donuts 1 U.S. Cellular 1
Strongest AM radio stations in Gorham:
WMTW (870 AM; 10 kW; GORHAM, ME; Owner: RADIO PARTNERS OF MAINE, L.P.)
WJAE (1440 AM; 5 kW; WESTBROOK, ME; Owner: ALTANTIC COAST RADIO, LLC)
WGAN (560 AM; 5 kW; PORTLAND, ME; Owner: SAGA COMMUNICATIONS OF NEW ENGLAND, LLC)
WLOB (1310 AM; 5 kW; PORTLAND, ME; Owner: ATLANTIC COAST RADIO, LLC)
WZAN (970 AM; 5 kW; PORTLAND, ME; Owner: SAGA COMMUNICATIONS OF NEW ENGLAND, LLC)
WBAE (1490 AM; 1 kW; PORTLAND, ME; Owner: SAGA COMMUNICATIONS OF NEW ENGLAND, LLC)
WRKO (680 AM; 50 kW; BOSTON, MA; Owner: ENTERCOM BOSTON LICENSE, LLC)
WGIN (930 AM; 10 kW; ROCHESTER, NH; Owner: CAPSTAR TX LIMITED PARTNERSHIP)
WEEI (850 AM; 50 kW; BOSTON, MA; Owner: ENTERCOM BOSTON LICENSE, LLC)
WBZ (1030 AM; 50 kW; BOSTON, MA; Owner: INFINITY BROADCASTING OPERATIONS, INC.)
WLAM (1470 AM; 5 kW; LEWISTON, ME; Owner: RADIO PARTNERS OF MAINE, L.P.)
WCRN (830 AM; 50 kW; WORCESTER, MA; Owner: CARTER BROADCASTING CORPORATION)
WIDE (1400 AM; 1 kW; BIDDEFORD, ME; Owner: SACO BAY COMMUNICATIONS GROUP INC)
Strongest FM radio stations in Gorham:
WMPG (90.9 FM; GORHAM, ME; Owner: UNIVERSITY OF MAINE SYSTEM)
WMEA (90.1 FM; PORTLAND, ME; Owner: MAINE PUBLIC BROADCASTING CORPORATION)
WPOR (101.9 FM; PORTLAND, ME; Owner: SAGA COMMUNICATIONS OF NEW ENGLAND, LLC)
WBLM (102.9 FM; PORTLAND, ME; Owner: CITADEL BROADCASTING COMPANY)
WMSJ (89.3 FM; FREEPORT, ME; Owner: DOWNEAST CHRISTIAN COMMUNICATIONS)
WJBQ (97.9 FM; PORTLAND, ME; Owner: CITADEL BROADCASTING COMPANY)
WCYY (94.3 FM; BIDDEFORD, ME; Owner: CITADEL BROADCASTING COMPANY)
WMGX (93.1 FM; PORTLAND, ME; Owner: SAGA COMMUNICATIONS OF NEW ENGLAND, LLC)
WRED (95.9 FM; SACO, ME; Owner: ATLANTIC COAST RADIO, LLC)
WBQW (106.3 FM; SCARBOROUGH, ME; Owner: MARINER BROADCASTING LIMITED PARTNER)
WMTW-FM (106.7 FM; NORTH WINDHAM, ME; Owner: RADIO PARTNERS OF MAINE, L.P.)
WTHT (107.5 FM; LEWISTON, ME; Owner: RADIO PARTNERS OF MAINE, L.P.)
WPKQ (103.7 FM; NORTH CONWAY, NH; Owner: CITADEL BROADCASTING COMPANY)
WHOM (94.9 FM; MT. WASHINGTON, NH; Owner: CITADEL BROADCASTING COMPANY)
WSCY (106.9 FM; MOULTONBOROUGH, NH; Owner: NORTHEAST COMMUNICATIONS CORPORATION)
WMEK-FM (99.9 FM; AUBURN, ME; Owner: RADIO PARTNERS OF MAINE, L.P.)
W245AA (96.9 FM; PORTLAND, ME; Owner: RADIO PARTNERS OF MAINE, L.P.)
WVFM (105.7 FM; CAMPTON, NH; Owner: DEVON BROADCASTING COMPANY, INC.)
WYNZ (100.9 FM; WESTBROOK, ME; Owner: SAGA COMMUNICATIONS OF NEW ENGLAND, LLC)
WPHX-FM (92.1 FM; SANFORD, ME; Owner: FNX BROADCASTING LLC)
TV broadcast stations around Gorham:
WGME-TV (Channel 13; PORTLAND, ME; Owner: WGME LICENSEE, LLC)
WMTW-TV (Channel 8; POLAND SPRING, ME; Owner: WMTW BROADCAST GROUP, LLC)
WCSH (Channel 6; PORTLAND, ME; Owner: PACIFIC AND SOUTHERN COMPANY, INC.)
WPXT (Channel 51; PORTLAND, ME; Owner: HMW, INC.)
WPME (Channel 35; LEWISTON, ME; Owner: KB PRIME MEDIA LLC)
WMEA-TV (Channel 26; BIDDEFORD, ME; Owner: MAINE PUBLIC BROADCASTING CORP.)
WLLB-LP (Channel 15; PORTLAND, ME; Owner: CARTER BROADCASTING CORPORATION)
W32CA (Channel 32; PORTLAND, ME; Owner: NATIONAL MINORITY T.V., INC.)
W58CM (Channel 58; BANGOR, ME; Owner: MS COMMUNICATIONS, LLC)
W57AP (Channel 57; FALMOUTH, ME; Owner: SHERWOOD H. CRAIG)
National Bridge Inventory (NBI) Statistics 10 Number of bridges59ft / 18.0m Total length81,201 Total average daily traffic4,436 Total average daily truck traffic
New bridges - historical statistics
1 1930-1939 1 1950-1959 1 1960-1969 2 1990-1999 3 2000-2009
See full National Bridge Inventory statistics for Gorham, ME
FCC Registered Cell Phone Towers: 1 (
See the full list of FCC Registered Cell Phone Towers in Gorham )
FCC Registered Antenna Towers: 60 (
See the full list of FCC Registered Antenna Towers )
FCC Registered Broadcast Land Mobile Towers: 16 (
See the full list of FCC Registered Broadcast Land Mobile Towers in Gorham, ME )
FCC Registered Microwave Towers: 6
WEST GORHAM, Finn Parker Road (Lat: 43.686083 Lon: -70.507806), Type: Gtower, Structure height: 105.2 m, Overall height: 106.7 m, Call Sign: WMQ845, Assigned Frequencies: 11055.0 MHz, Grant Date: 01/12/2021, Expiration Date: 02/01/2031, Certifier: Carol L Tacker, Registrant: At&t Services, Inc., 208 S Akard St, 20f, Dallas, TX 75202, Phone: (855) 699-7073, Fax: (214) 746-6410, Email:
STATION, Off South Rd Near South Gorham At Gorham 345kv Sub (Lat: 43.643944 Lon: -70.431694), Overall height: 33.5 m, Call Sign: WNEE867, Assigned Frequencies: 1885.00 MHz, Grant Date: 07/30/1993, Expiration Date: 07/30/1998, Cancellation Date: 08/23/1996, Phone: (202) 331-9495 GORHAM, Rt. 114 & Kimballs Way (Lat: 43.694167 Lon: -70.441389), Type: Tower, Structure height: 91.4 m, Overall height: 92.9 m, Call Sign: WQCD561, Assigned Frequencies: 10578.1 MHz, Grant Date: 02/07/2005, Expiration Date: 02/07/2015, Cancellation Date: 10/17/2014, Certifier: Richard A Craig, Registrant: Verizon Wireless, 1120 Sanctuary Pkwy, #150 Gasa5reg, Alpharetta, GA 30009-7630, Phone: (770) 797-1070, Fax: (770) 797-1036, Email:
GORHAM, 61 Mcleean Rd (Lat: 43.647861 Lon: -70.411556), Type: Mtower, Structure height: 39 m, Call Sign: WQSY739, Assigned Frequencies: 19475.0 MHz, 19525.0 MHz, 19525.0 MHz, Grant Date: 11/07/2023, Expiration Date: 12/10/2033, Certifier: John E Monday, Registrant: At&t Services, Inc., 208 S Akard St, 20f, Dallas, TX 75202, Phone: (855) 699-7073, Email:
GORHAM FORT, Fort Hill Road (Lat: 43.698917 Lon: -70.454556), Type: Upole, Structure height: 18.3 m, Call Sign: WRHS885, Assigned Frequencies: 11365.0 MHz, 11365.0 MHz, 11365.0 MHz, 11365.0 MHz, 11365.0 MHz, Grant Date: 06/10/2020, Expiration Date: 06/10/2030, Certifier: William Holmes, Registrant: Radio Communications Management Inc., 158 Rand Road, Rcm, Portland, ME 04102, Phone: (207) 797-7503, Email:
NASNTWR, Nason Road (Lat: 43.787778 Lon: -70.477333), Type: Ltower, Structure height: 45.7 m, Overall height: 48.7 m, Call Sign: WRXY581, Assigned Frequencies: 11245.0 MHz, 11245.0 MHz, 11245.0 MHz, 11245.0 MHz, 11245.0 MHz, 11245.0 MHz, 11245.0 MHz, 11245.0 MHz, 11245.0 MHz, Grant Date: 07/11/2023, Expiration Date: 07/11/2033, Certifier: Ken Fickett, Registrant: Radio Communications Management Inc., 158 Rand Road, Rcm, Portland, ME 04102, Phone: (207) 797-7503, Email:
FCC Registered Amateur Radio Licenses: 73 (
See the full list of FCC Registered Amateur Radio Licenses in Gorham )
FAA Registered Aircraft Manufacturers and Dealers: 1 (
See the full list of FAA Registered Manufacturers and Dealers in Gorham )
FAA Registered Aircraft: 16 (
See the full list of FAA Registered Aircraft )
Home Mortgage Disclosure Act Aggregated Statistics For Year 2009(Based on 1 partial tract) A) FHA, FSA/RHS & VA B) Conventional C) Refinancings D) Home Improvement Loans F) Non-occupant Loans on Number Average Value Number Average Value Number Average Value Number Average Value Number Average Value
LOANS ORIGINATED 12 $205,611 17 $188,045 80 $189,101 5 $82,192 2 $148,080 APPLICATIONS APPROVED, NOT ACCEPTED 1 $214,450 2 $218,830 10 $200,297 0 $0 0 $0 APPLICATIONS DENIED 4 $204,880 4 $158,742 22 $224,050 2 $130,340 2 $127,750 APPLICATIONS WITHDRAWN 1 $188,940 0 $0 12 $221,488 0 $0 0 $0 FILES CLOSED FOR INCOMPLETENESS 1 $159,440 0 $0 4 $184,950 0 $0 0 $0
Aggregated Statistics For Year 2008(Based on 1 partial tract) A) FHA, FSA/RHS & VA B) Conventional C) Refinancings D) Home Improvement Loans F) Non-occupant Loans on G) Loans On Manufactured Number Average Value Number Average Value Number Average Value Number Average Value Number Average Value Number Average Value
LOANS ORIGINATED 5 $226,404 24 $192,025 30 $194,224 8 $69,954 6 $180,167 1 $70,550 APPLICATIONS APPROVED, NOT ACCEPTED 1 $181,360 1 $220,030 9 $190,398 0 $0 2 $139,710 1 $33,080 APPLICATIONS DENIED 0 $0 3 $159,707 14 $222,903 2 $52,815 0 $0 0 $0 APPLICATIONS WITHDRAWN 0 $0 2 $241,350 9 $204,614 0 $0 1 $198,900 0 $0 FILES CLOSED FOR INCOMPLETENESS 0 $0 0 $0 1 $157,450 0 $0 0 $0 0 $0
Aggregated Statistics For Year 2007(Based on 1 partial tract) A) FHA, FSA/RHS & VA B) Conventional C) Refinancings D) Home Improvement Loans F) Non-occupant Loans on Number Average Value Number Average Value Number Average Value Number Average Value Number Average Value
LOANS ORIGINATED 2 $248,725 29 $184,016 33 $211,765 14 $60,189 4 $237,368 APPLICATIONS APPROVED, NOT ACCEPTED 0 $0 4 $173,990 7 $194,574 2 $148,480 0 $0 APPLICATIONS DENIED 0 $0 4 $214,945 22 $175,710 5 $51,898 2 $192,725 APPLICATIONS WITHDRAWN 0 $0 1 $151,470 9 $198,769 1 $47,830 1 $385,050 FILES CLOSED FOR INCOMPLETENESS 0 $0 0 $0 2 $200,695 0 $0 0 $0
Aggregated Statistics For Year 2006(Based on 1 partial tract) A) FHA, FSA/RHS & VA B) Conventional C) Refinancings D) Home Improvement Loans F) Non-occupant Loans on G) Loans On Manufactured Number Average Value Number Average Value Number Average Value Number Average Value Number Average Value Number Average Value
LOANS ORIGINATED 2 $273,240 45 $186,190 45 $167,997 15 $55,352 8 $168,209 0 $0 APPLICATIONS APPROVED, NOT ACCEPTED 0 $0 7 $167,810 8 $215,642 3 $41,057 3 $228,530 0 $0 APPLICATIONS DENIED 1 $212,060 6 $199,898 17 $211,610 4 $63,875 1 $306,520 1 $90,080 APPLICATIONS WITHDRAWN 0 $0 2 $206,475 14 $180,822 0 $0 0 $0 0 $0 FILES CLOSED FOR INCOMPLETENESS 0 $0 2 $211,455 3 $192,923 1 $43,850 0 $0 0 $0
Aggregated Statistics For Year 2005(Based on 1 partial tract) A) FHA, FSA/RHS & VA B) Conventional C) Refinancings D) Home Improvement Loans F) Non-occupant Loans on G) Loans On Manufactured Number Average Value Number Average Value Number Average Value Number Average Value Number Average Value Number Average Value
LOANS ORIGINATED 2 $259,490 57 $185,118 69 $166,072 18 $81,669 6 $191,062 1 $21,130 APPLICATIONS APPROVED, NOT ACCEPTED 0 $0 5 $181,922 8 $144,492 1 $30,690 0 $0 0 $0 APPLICATIONS DENIED 0 $0 7 $153,689 15 $174,215 4 $40,060 2 $136,720 1 $57,400 APPLICATIONS WITHDRAWN 0 $0 6 $191,860 27 $165,404 2 $117,585 2 $213,250 0 $0 FILES CLOSED FOR INCOMPLETENESS 0 $0 1 $177,380 4 $148,280 0 $0 0 $0 0 $0
Aggregated Statistics For Year 2004(Based on 1 partial tract) A) FHA, FSA/RHS & VA B) Conventional C) Refinancings D) Home Improvement Loans E) Loans on Dwellings For 5+ Families F) Non-occupant Loans on G) Loans On Manufactured Number Average Value Number Average Value Number Average Value Number Average Value Number Average Value Number Average Value Number Average Value
LOANS ORIGINATED 4 $183,158 55 $184,929 77 $165,331 19 $48,147 0 $0 10 $207,152 1 $78,130 APPLICATIONS APPROVED, NOT ACCEPTED 0 $0 6 $147,548 6 $193,520 2 $45,840 0 $0 2 $119,580 1 $15,550 APPLICATIONS DENIED 0 $0 8 $113,501 22 $150,091 5 $40,976 0 $0 2 $170,600 3 $28,300 APPLICATIONS WITHDRAWN 0 $0 4 $162,530 25 $156,108 2 $71,350 1 $1,307,410 1 $277,430 0 $0 FILES CLOSED FOR INCOMPLETENESS 0 $0 1 $209,660 2 $226,605 0 $0 0 $0 0 $0 0 $0
Aggregated Statistics For Year 2003(Based on 1 partial tract) A) FHA, FSA/RHS & VA B) Conventional C) Refinancings D) Home Improvement Loans F) Non-occupant Loans on Number Average Value Number Average Value Number Average Value Number Average Value Number Average Value
LOANS ORIGINATED 1 $227,200 47 $176,029 191 $136,634 12 $49,228 10 $184,073 APPLICATIONS APPROVED, NOT ACCEPTED 0 $0 4 $182,560 20 $139,490 2 $17,340 1 $186,940 APPLICATIONS DENIED 0 $0 4 $121,372 15 $124,629 3 $16,610 1 $170,600 APPLICATIONS WITHDRAWN 0 $0 4 $156,350 16 $130,766 0 $0 0 $0 FILES CLOSED FOR INCOMPLETENESS 0 $0 0 $0 4 $164,820 1 $13,950 1 $104,830
Aggregated Statistics For Year 2002(Based on 1 partial tract) A) FHA, FSA/RHS & VA B) Conventional C) Refinancings D) Home Improvement Loans F) Non-occupant Loans on Number Average Value Number Average Value Number Average Value Number Average Value Number Average Value
LOANS ORIGINATED 5 $127,870 63 $161,838 97 $138,491 6 $35,077 8 $137,716 APPLICATIONS APPROVED, NOT ACCEPTED 0 $0 4 $191,628 9 $135,391 2 $93,670 0 $0 APPLICATIONS DENIED 0 $0 3 $58,993 22 $119,073 0 $0 1 $84,100 APPLICATIONS WITHDRAWN 0 $0 3 $214,580 10 $130,063 1 $18,730 0 $0 FILES CLOSED FOR INCOMPLETENESS 0 $0 0 $0 2 $120,180 0 $0 0 $0
Aggregated Statistics For Year 2001(Based on 1 partial tract) A) FHA, FSA/RHS & VA B) Conventional C) Refinancings D) Home Improvement Loans E) Loans on Dwellings For 5+ Families F) Non-occupant Loans on Number Average Value Number Average Value Number Average Value Number Average Value Number Average Value Number Average Value
LOANS ORIGINATED 8 $122,320 44 $138,704 77 $130,078 5 $36,272 0 $0 6 $109,482 APPLICATIONS APPROVED, NOT ACCEPTED 0 $0 6 $141,105 6 $120,112 1 $13,150 0 $0 0 $0 APPLICATIONS DENIED 0 $0 4 $100,148 12 $93,272 2 $8,970 1 $179,370 1 $195,710 APPLICATIONS WITHDRAWN 0 $0 1 $164,220 14 $122,456 1 $19,130 0 $0 0 $0 FILES CLOSED FOR INCOMPLETENESS 0 $0 1 $99,250 4 $118,285 1 $55,800 0 $0 1 $130,740
Aggregated Statistics For Year 2000(Based on 1 partial tract) A) FHA, FSA/RHS & VA B) Conventional C) Refinancings D) Home Improvement Loans F) Non-occupant Loans on Number Average Value Number Average Value Number Average Value Number Average Value Number Average Value
LOANS ORIGINATED 6 $129,612 44 $122,443 17 $96,766 4 $21,822 4 $102,840 APPLICATIONS APPROVED, NOT ACCEPTED 0 $0 4 $113,700 3 $52,617 2 $26,905 1 $105,630 APPLICATIONS DENIED 0 $0 6 $41,720 12 $75,202 4 $29,498 1 $93,270 APPLICATIONS WITHDRAWN 0 $0 2 $108,820 6 $81,513 1 $17,940 0 $0 FILES CLOSED FOR INCOMPLETENESS 0 $0 0 $0 1 $83,310 0 $0 0 $0
Aggregated Statistics For Year 1999(Based on 1 partial tract) A) FHA, FSA/RHS & VA B) Conventional C) Refinancings D) Home Improvement Loans F) Non-occupant Loans on Number Average Value Number Average Value Number Average Value Number Average Value Number Average Value
LOANS ORIGINATED 10 $116,437 43 $101,491 42 $93,524 12 $15,049 6 $94,698 APPLICATIONS APPROVED, NOT ACCEPTED 0 $0 3 $72,157 9 $76,844 5 $33,674 0 $0 APPLICATIONS DENIED 1 $88,720 6 $62,562 14 $75,931 6 $27,272 1 $52,050 APPLICATIONS WITHDRAWN 0 $0 3 $121,577 13 $68,882 0 $0 0 $0 FILES CLOSED FOR INCOMPLETENESS 0 $0 0 $0 2 $79,650 0 $0 0 $0
Detailed HMDA statistics for the following Tracts:
0040.02
Private Mortgage Insurance Companies Aggregated Statistics For Year 2009(Based on 1 partial tract) A) Conventional B) Refinancings Number Average Value Number Average Value
LOANS ORIGINATED 1 $313,700 3 $218,963 APPLICATIONS APPROVED, NOT ACCEPTED 0 $0 1 $233,980 APPLICATIONS DENIED 0 $0 1 $228,400 APPLICATIONS WITHDRAWN 0 $0 1 $220,030 FILES CLOSED FOR INCOMPLETENESS 0 $0 0 $0
Aggregated Statistics For Year 2008(Based on 1 partial tract) A) Conventional B) Refinancings Number Average Value Number Average Value
LOANS ORIGINATED 7 $221,793 4 $296,360 APPLICATIONS APPROVED, NOT ACCEPTED 1 $275,830 2 $285,400 APPLICATIONS DENIED 0 $0 0 $0 APPLICATIONS WITHDRAWN 0 $0 1 $173,390 FILES CLOSED FOR INCOMPLETENESS 0 $0 0 $0
Aggregated Statistics For Year 2007(Based on 1 partial tract) A) Conventional B) Refinancings Number Average Value Number Average Value
LOANS ORIGINATED 4 $288,488 5 $280,854 APPLICATIONS APPROVED, NOT ACCEPTED 0 $0 2 $277,225 APPLICATIONS DENIED 0 $0 0 $0 APPLICATIONS WITHDRAWN 0 $0 0 $0 FILES CLOSED FOR INCOMPLETENESS 0 $0 0 $0
Aggregated Statistics For Year 2006(Based on 1 partial tract) A) Conventional B) Refinancings Number Average Value Number Average Value
LOANS ORIGINATED 6 $225,608 2 $317,485 APPLICATIONS APPROVED, NOT ACCEPTED 2 $235,970 0 $0 APPLICATIONS DENIED 0 $0 0 $0 APPLICATIONS WITHDRAWN 0 $0 0 $0 FILES CLOSED FOR INCOMPLETENESS 0 $0 0 $0
Aggregated Statistics For Year 2005(Based on 1 partial tract) A) Conventional B) Refinancings Number Average Value Number Average Value
LOANS ORIGINATED 5 $217,476 5 $230,152 APPLICATIONS APPROVED, NOT ACCEPTED 2 $183,755 2 $194,315 APPLICATIONS DENIED 0 $0 0 $0 APPLICATIONS WITHDRAWN 0 $0 0 $0 FILES CLOSED FOR INCOMPLETENESS 0 $0 0 $0
Aggregated Statistics For Year 2004(Based on 1 partial tract) A) Conventional B) Refinancings C) Non-occupant Loans on Number Average Value Number Average Value Number Average Value
LOANS ORIGINATED 5 $194,198 4 $189,832 1 $163,030 APPLICATIONS APPROVED, NOT ACCEPTED 2 $185,945 1 $274,640 0 $0 APPLICATIONS DENIED 0 $0 0 $0 0 $0 APPLICATIONS WITHDRAWN 0 $0 1 $192,920 0 $0 FILES CLOSED FOR INCOMPLETENESS 0 $0 0 $0 0 $0
Aggregated Statistics For Year 2003(Based on 1 partial tract) A) Conventional B) Refinancings C) Non-occupant Loans on Number Average Value Number Average Value Number Average Value
LOANS ORIGINATED 13 $196,448 8 $181,314 1 $260,290 APPLICATIONS APPROVED, NOT ACCEPTED 2 $192,920 1 $137,120 1 $192,130 APPLICATIONS DENIED 0 $0 0 $0 0 $0 APPLICATIONS WITHDRAWN 0 $0 1 $195,310 0 $0 FILES CLOSED FOR INCOMPLETENESS 0 $0 0 $0 0 $0
Aggregated Statistics For Year 2002(Based on 1 partial tract) A) Conventional B) Refinancings C) Non-occupant Loans on Number Average Value Number Average Value Number Average Value
LOANS ORIGINATED 14 $170,089 6 $157,447 2 $163,825 APPLICATIONS APPROVED, NOT ACCEPTED 1 $272,240 1 $101,640 0 $0 APPLICATIONS DENIED 0 $0 0 $0 0 $0 APPLICATIONS WITHDRAWN 1 $251,920 0 $0 0 $0 FILES CLOSED FOR INCOMPLETENESS 0 $0 0 $0 0 $0
Aggregated Statistics For Year 2001(Based on 1 partial tract) A) Conventional B) Refinancings C) Non-occupant Loans on Number Average Value Number Average Value Number Average Value
LOANS ORIGINATED 12 $164,223 2 $205,875 1 $137,520 APPLICATIONS APPROVED, NOT ACCEPTED 1 $194,120 1 $99,650 0 $0 APPLICATIONS DENIED 0 $0 0 $0 0 $0 APPLICATIONS WITHDRAWN 0 $0 0 $0 0 $0 FILES CLOSED FOR INCOMPLETENESS 0 $0 0 $0 0 $0
Aggregated Statistics For Year 2000(Based on 1 partial tract) A) Conventional B) Refinancings C) Non-occupant Loans on Number Average Value Number Average Value Number Average Value
LOANS ORIGINATED 12 $150,803 1 $156,650 2 $89,285 APPLICATIONS APPROVED, NOT ACCEPTED 1 $168,610 0 $0 0 $0 APPLICATIONS DENIED 0 $0 0 $0 0 $0 APPLICATIONS WITHDRAWN 0 $0 0 $0 0 $0 FILES CLOSED FOR INCOMPLETENESS 0 $0 0 $0 0 $0
Aggregated Statistics For Year 1999(Based on 1 partial tract) A) Conventional B) Refinancings Number Average Value Number Average Value
LOANS ORIGINATED 9 $127,228 3 $118,290 APPLICATIONS APPROVED, NOT ACCEPTED 2 $118,685 2 $76,100 APPLICATIONS DENIED 0 $0 0 $0 APPLICATIONS WITHDRAWN 0 $0 0 $0 FILES CLOSED FOR INCOMPLETENESS 0 $0 0 $0
Detailed PMIC statistics for the following Tracts:
0040.02
Gorham compared to Maine state average:
Median house value above state average. Black race population percentage above state average. Hispanic race population percentage above state average. Median age significantly below state average. Foreign-born population percentage significantly above state average. Length of stay since moving in above state average. Institutionalized population percentage above state average. Number of college students significantly above state average. Percentage of population with a bachelor's degree or higher above state average.
#77 on the list of "Top 100 cities with highest percentage of college students (pop. 5,000+)"
#101 (04038) on the list of "Top 101 zip codes with the largest percentage of Scottish first ancestries (pop 5,000+)"
#28 on the list of "Top 101 counties with the highest percentage of residents that exercised in the past month"
#30 on the list of "Top 101 counties with the best general health status score of residents (1-5), 3 years of data"
#40 on the list of "Top 101 counties with the highest percentage of residents that visited a dentist within the past year"
#43 on the list of "Top 101 counties with the highest Nitrogen Dioxide air pollution readings in 2012 (ppm)"
#49 on the list of "Top 101 counties with the lowest number of births per 1000 residents 2007-2013"
Top Patent Applicants
Alexander Alexeyev (8)
Richard H. Curtis (8)
Michael Atkinson (7)
Benjamin Francis Polito (5)
John Thomas Bradshaw (5)
Cory A. Stansbury (4)
Jill M. Saucier (4)
Joseph B. Seale (4)
Joseph A. Mellone (4)
Joshua Daniel Kaufman (4)
Total of 127 patent applications in 2008-2024.


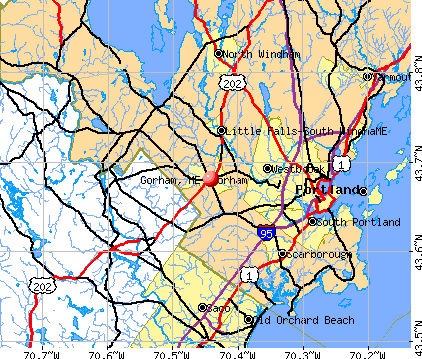


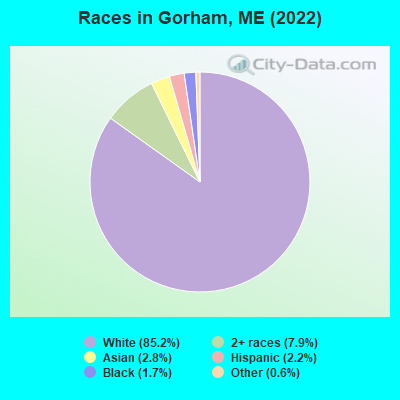
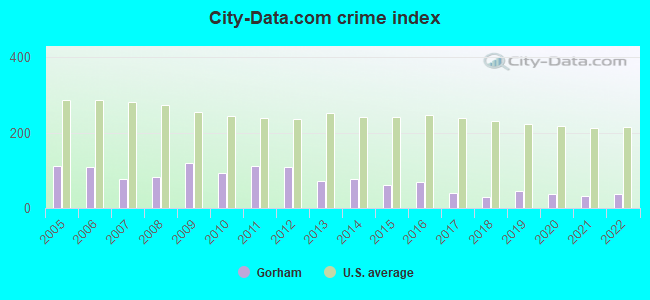
 Recent articles from our blog. Our writers, many of them Ph.D. graduates or candidates, create easy-to-read articles on a wide variety of topics.


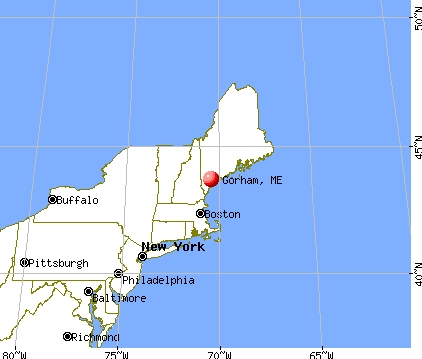
 (8.7 miles
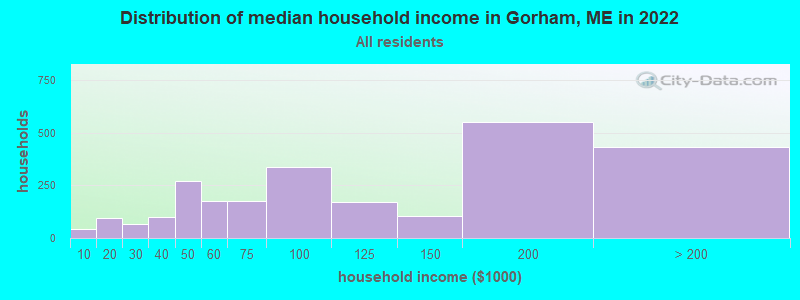
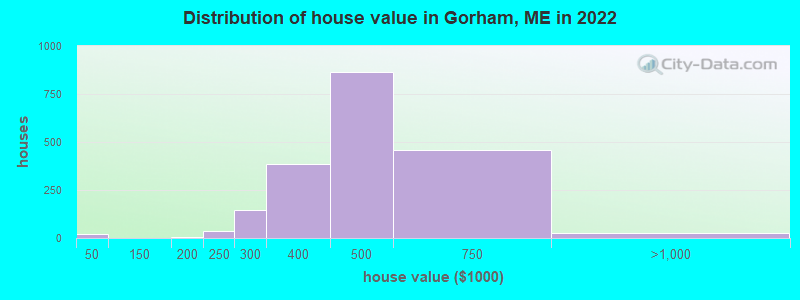
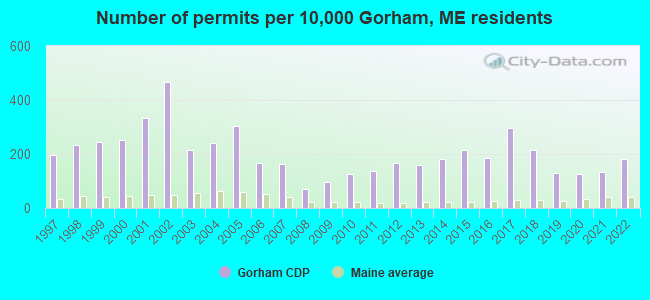
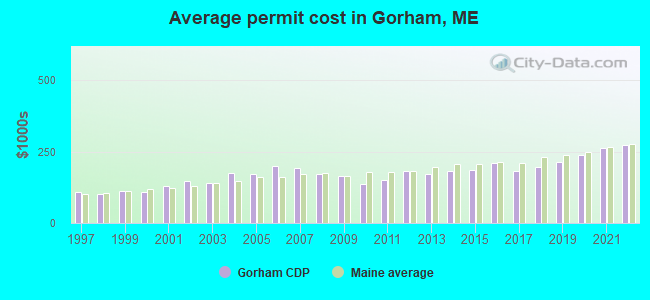
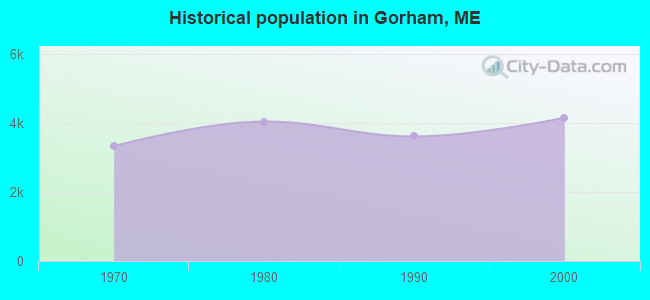
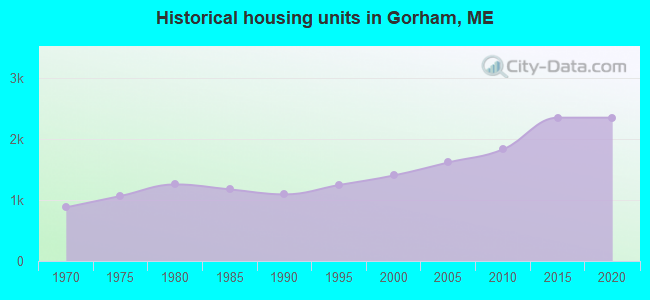
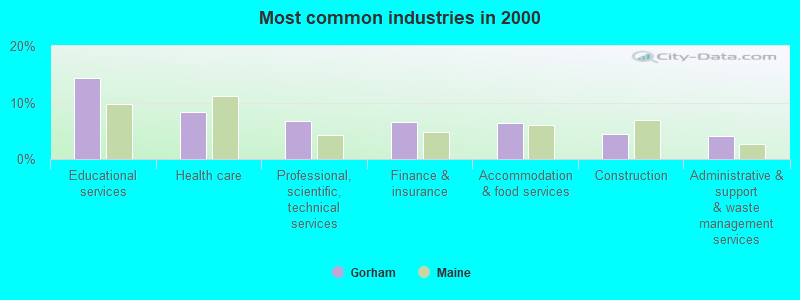
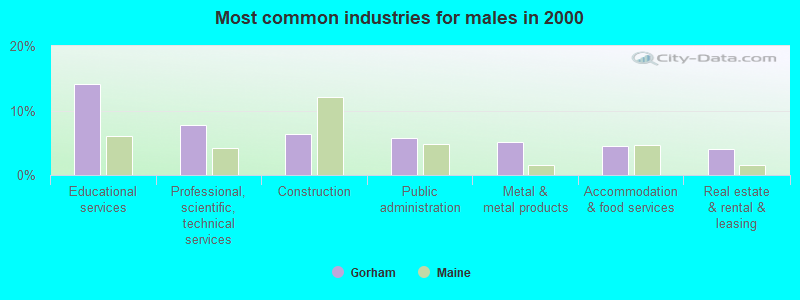
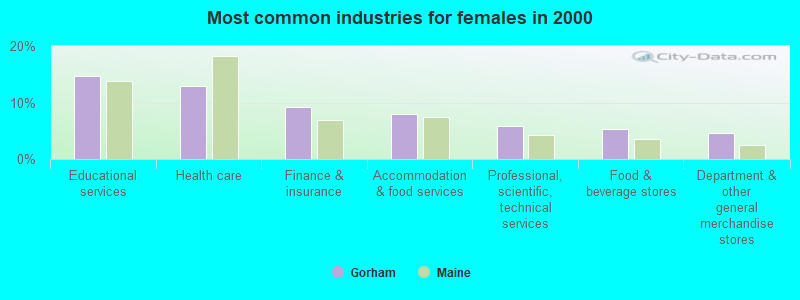
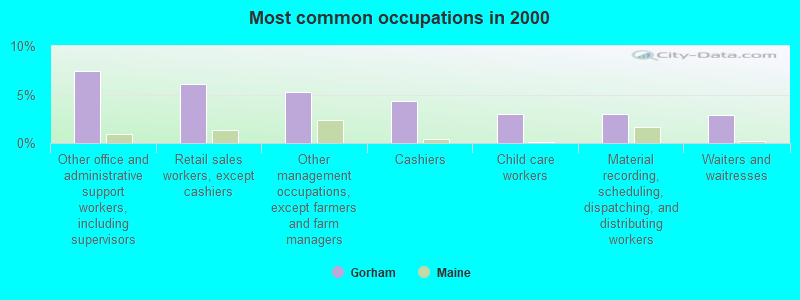
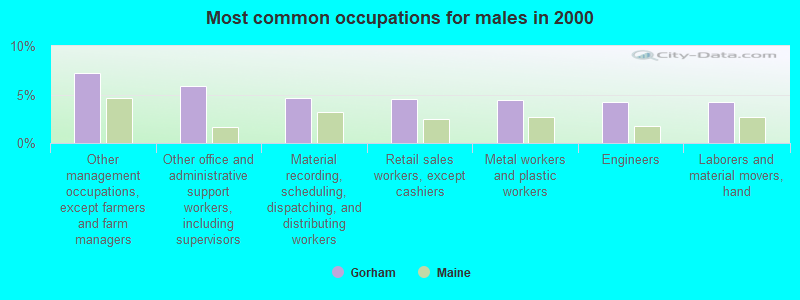
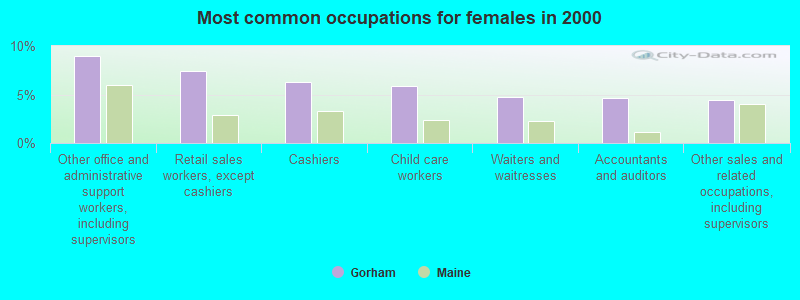
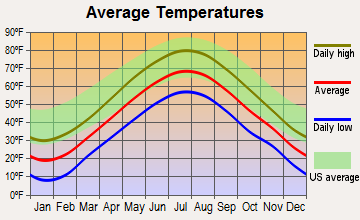
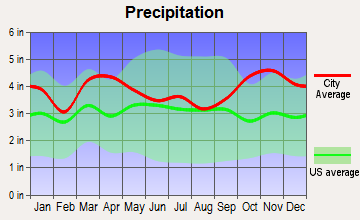
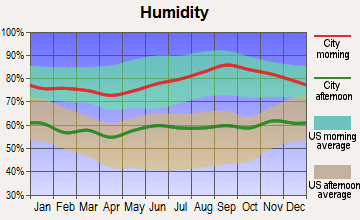
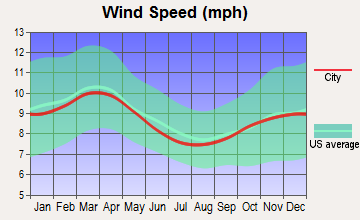
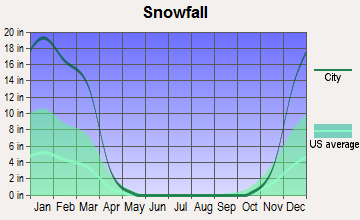
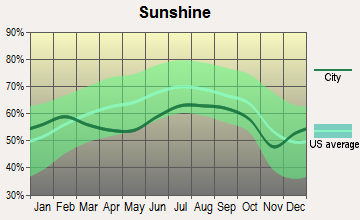
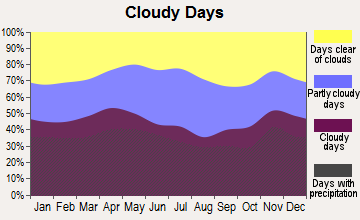
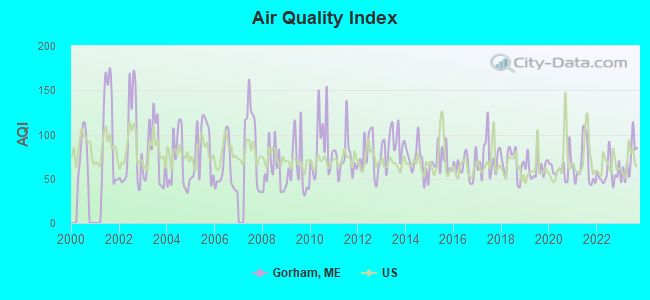
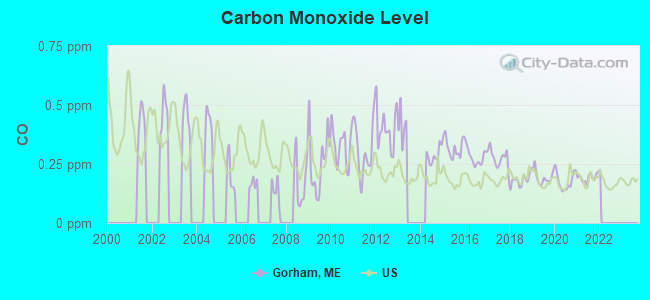
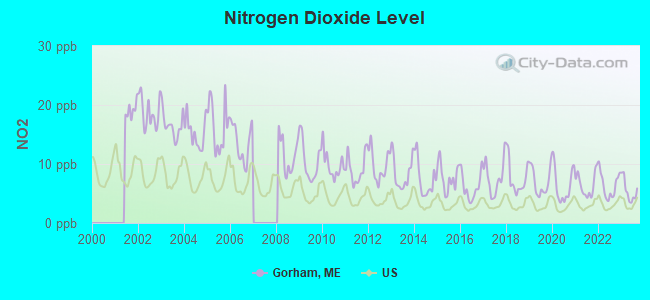
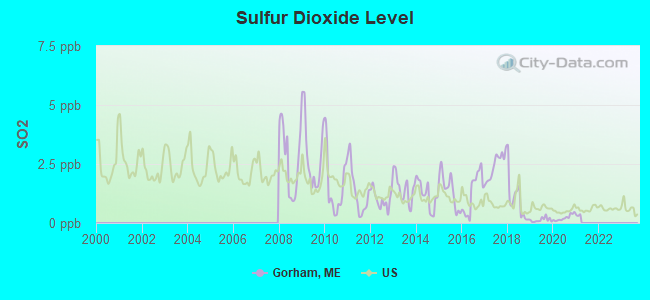
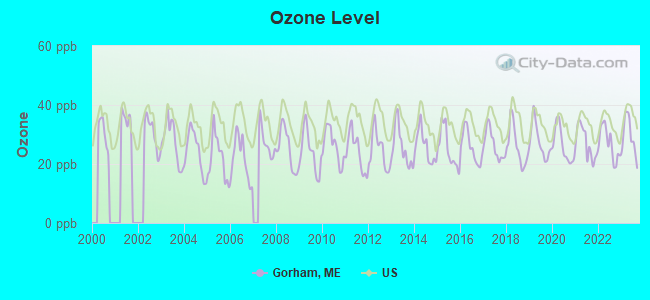
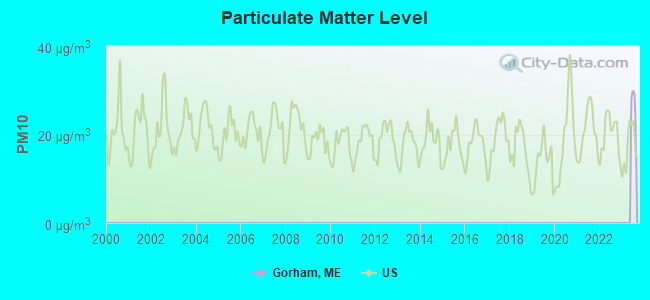
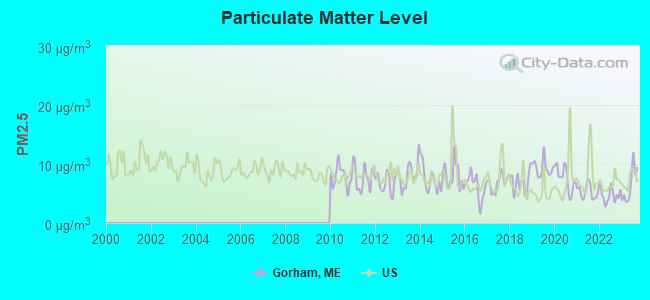

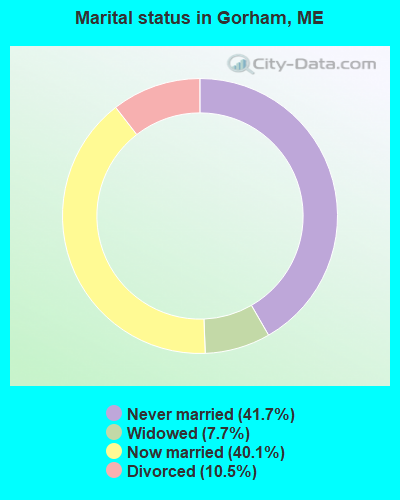
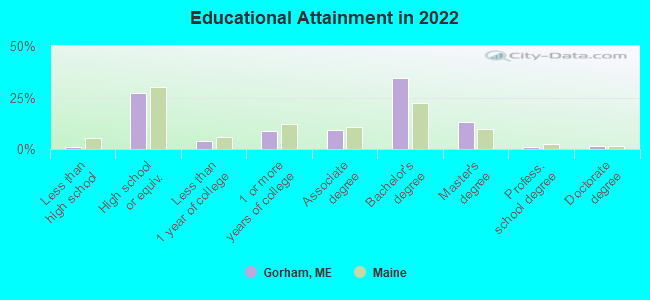
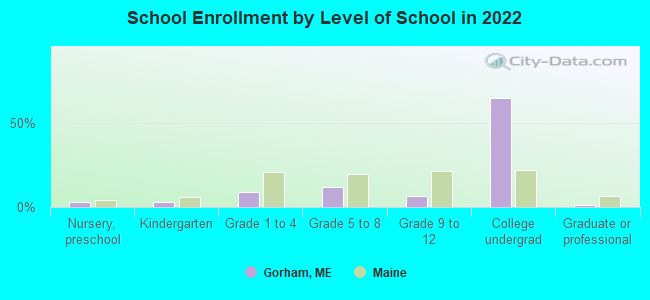
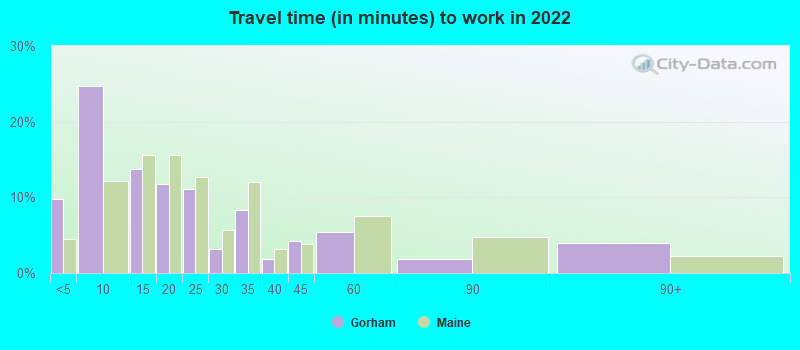
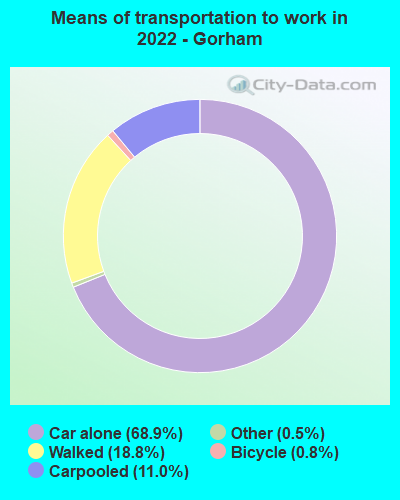
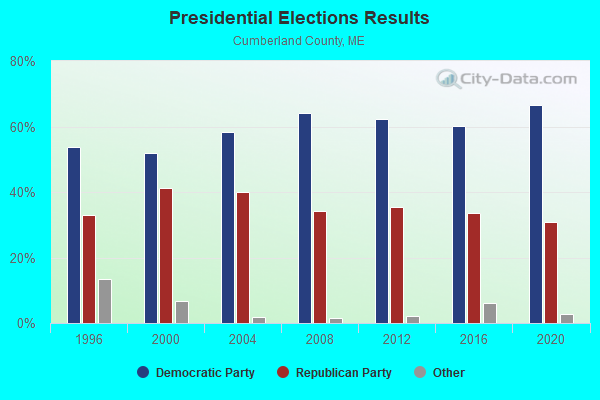
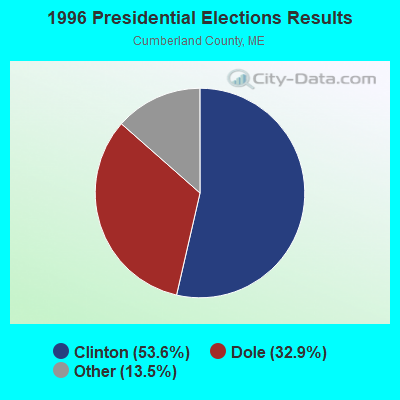
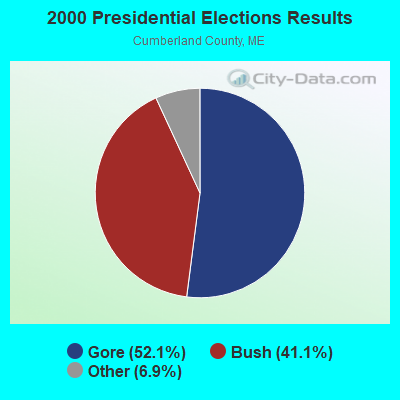
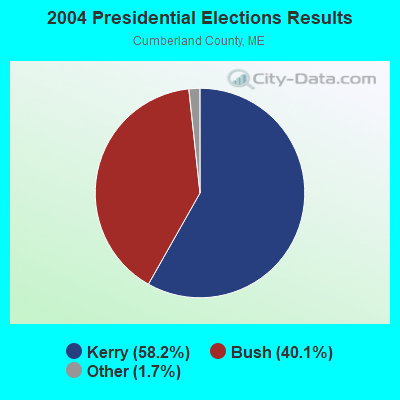
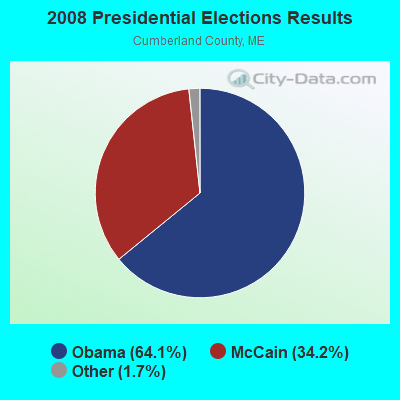
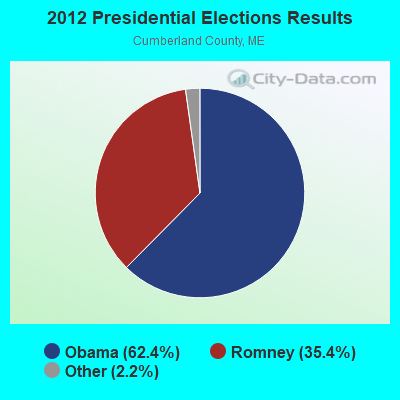
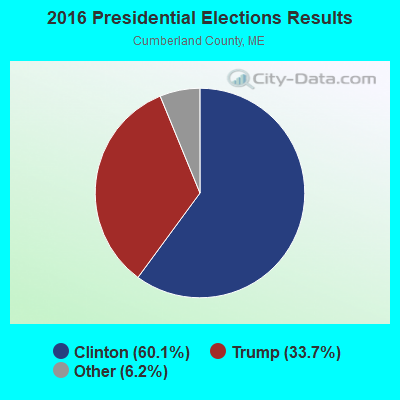
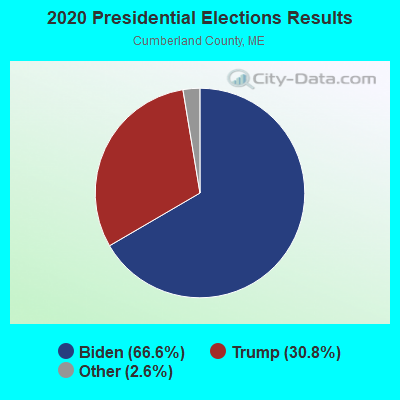
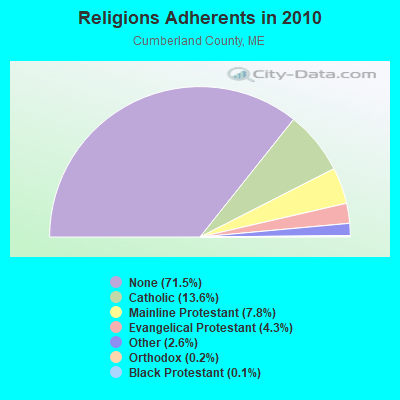
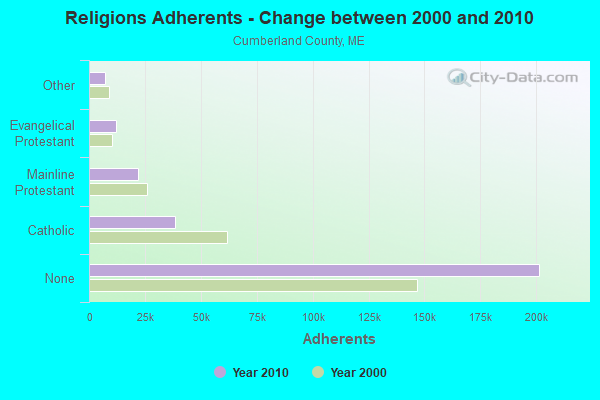
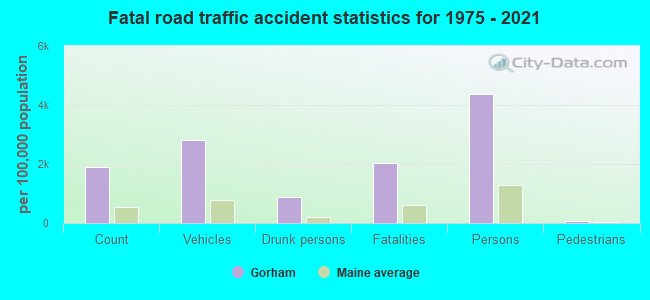
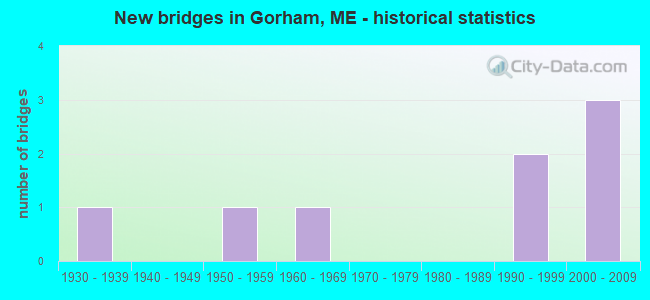
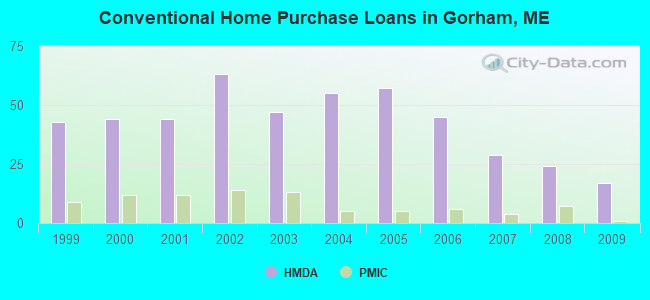
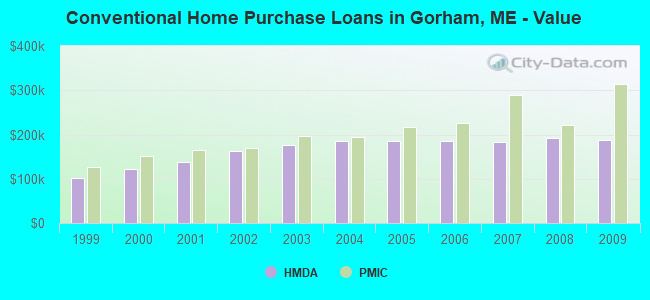
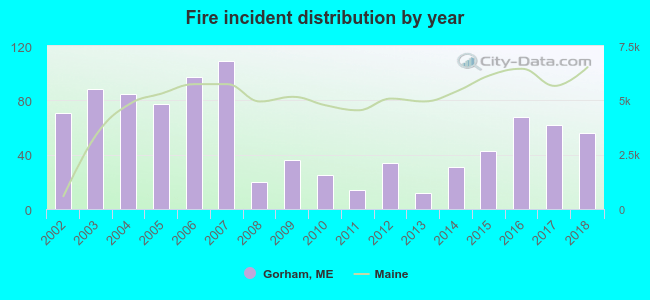 According to the data from the years 2002 - 2018 the average number of fires per year is 55. The highest number of fire incidents - 109 took place in 2007, and the least - 12 in 2013. The data has a declining trend.
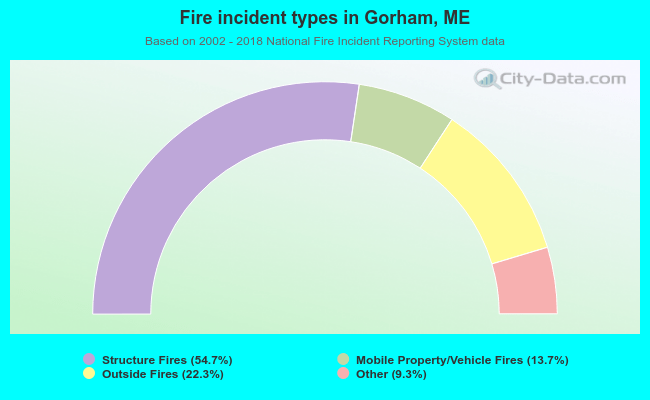 When looking into fire subcategories, the most incidents belonged to: Structure Fires (54.7%), and Outside Fires (22.3%).