Vancouver, Washington Neighborhood Map - Income, House Prices, Occupations, Boundaries
Settings
X

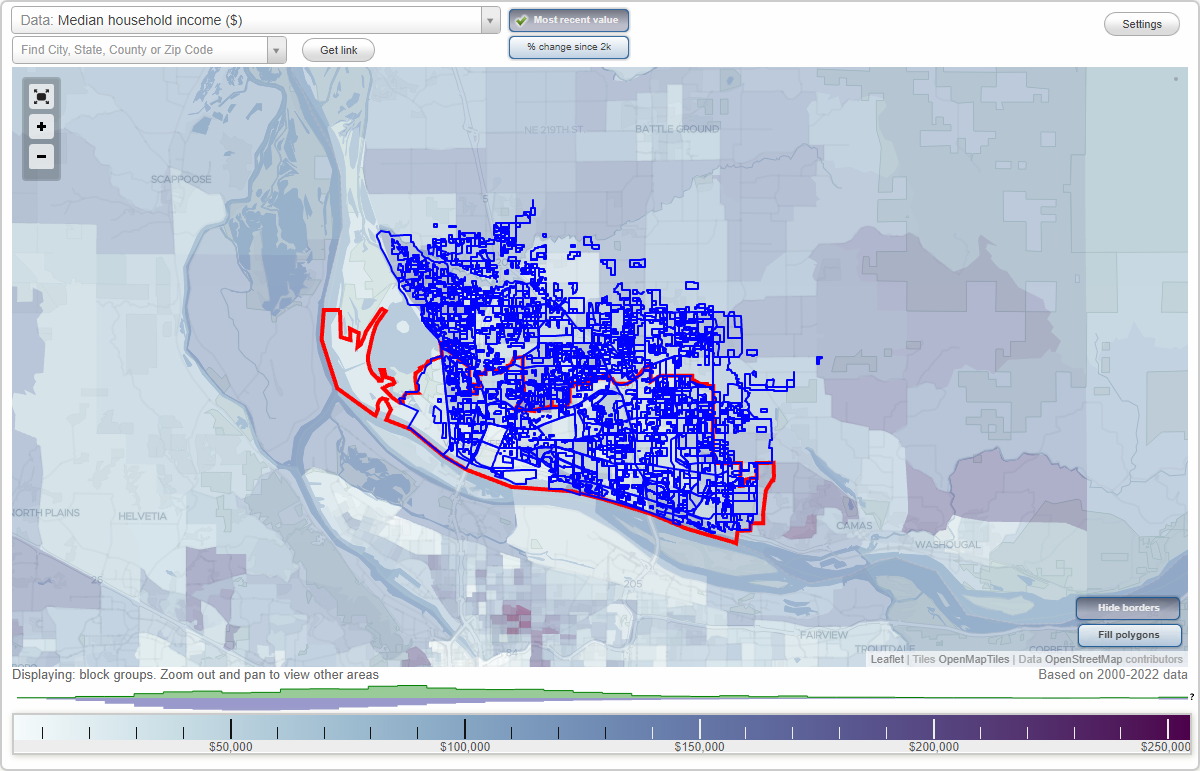
- City boundary
- Neighborhood boundaries
Business Search - 14 Million verified businesses
25th Ave Townhomes - Cascade View Estates Neighborhoods:
25th Ave Townhomes, 38th Street Terrace, Abbey Lane, Academy Square, Adelina Highlands, Adrianna's Place, Ahner Hall Mobile Estates, Airport Green, Airport Green Industrial Park, Airport Heights, Akabar Acres, Al-Mi Court, Alder Glen, Alexander Tracts, Alice Meadows, Alicias Glen, Allison Heights, Allman Park, Allum Acres, Allwood Estates, Allwood Manor, Allwood Terrace, Alpine Meadows, Alpine View, Alpine West, Alys Woods, Amhurst Commons, Ampere Acres, Ampere Heights, Amphere Heights, Andersen, Andersons Capitol Hill, Andreas Meadow, Andresen Highland, Andrew John Estates, Andrews Court, Andys Acres, Ann Manor, Annies Acres, Apple Meadows, Arcadia Cedars, Arden, Arnada, Arnada Park, Arnada Park Annex, Ash, Ash Hollow, Ashford Lane, Ashley Cedars, Ashley Heights, Ashley Manor, Ashley Meadows, Ashton Acres, Autumn Chase, Autumn Ridge, Autumn Trace, Autumn Walk, Avalon, Avalon Court, Avalon Estates, Avalon Heights, Avalon Hills, Avalon Meadows, Avenues, Avery Estates, Axford Lane, Axtell Acres, Bacon Place, Bagley Downs, Bagley Downs Estates, Bagley Park, Banbury Place, Barbeau Estates, Barberton Industrial Park, Barg Acres, Barnes Addition, Barnes Crossing, Barringer Ridge Estates, Bay Berry Terrace, Beautiful Downtown Orchards, Beaver Garden Tracts, Beckinridge Infill, Beckridge, Bel-Air, Bella Terra, Bella Vista, Bella Vista Estates, Bella Vista Heights, Bella Vista Woods, Belle Ridge, Belmont Estates, Belmont Place, Ben-Hollow, Bennett Estates, Bennett Estates Foxcroft, Bennington, Berdie Acres, Berry Acres, Beverly Heights, Beverly Park, Biddles Landing, Biltmore Place, Birch Tree Cove, Birchwood Meadows, Blakesfield, Blandford Terrace, Blossomwood Farm, Blue Heron Estates, Blueberry Hill, Blueberry Homes, Blurock Homestead, Boardwalk Garden Homes, Bold Estates, Bonnies Vista, Bradleys Place, Braewood, Brandt Terrace, Brekke Farms, Brentwood, Brentwood South, Brentwood West, Brett Acres, Briarwood, Brickhaven, Bridge Creek Village, Bridlewood, Brier Tree, Brislawn, Bristol Manor, Brittany Court, Broad Acres, Broadmoor, Broadview, Brook Run, Brookside, Brookside Knoll, Browns Manor, Browns Place, Buckman Garden North, Buckman Garden Tracts, Buckman Heights, Buena Vista, Buena Vista Heights, Buena Vista Meadows, Burberry, Burlwood Estates, Burning Green, Burnt Bridge Creek, Burnt Bridge Crest, Burnt Bridge Vista, Burroughs Estates, Burton Evergreen, Burton Meadows, Burton Place, Burton Ridge, Bush Gardens, Buttercup Estates, Butternut Hill, Cabes Acres, Cady Court, Caitlin Glen, Cambridge Estates, Camelot Court, Camelot Crest, Camille Court, Camille Estates, Camino Village, Canaan Acres, Candlebrooke, Candlewood, Canter Wood, Canyon Crest, Canyon Ridge, Capitol Hills, Capri Hill, Capris Hill Terrace, Carlson Estates, Carlson Place, Carmina Estates, Carrell Estates, Carriage House Estates, Carson Heights, Carter Park, Casa Mia, Casandra Meadows, Cascade Business Center, Cascade East, Cascade Highlands, Cascade Landing Business Park, Cascade Lane, Cascade Manor, Cascade Meadows, Cascade Park Manor, Cascade Park Place, Cascade Park Terrace, Cascade Place, Cascade Rest, Cascade South East, Cascade Terrace, Cascade View Estates25th Ave Townhomes neighborhood in Vancouver statistics: (Find on map)
25th Ave Townhomes neighborhood detailed profile
25th Ave Townhomes neighborhood detailed profile
38th Street Terrace neighborhood in Vancouver statistics: (Find on map)
Area: 0.001 square miles
Population: 3
Population density:
Median household income in 2021:
Median rent in in 2021:
Male vs Females
Median age
Average estimated value of detached houses in 2021 (100.0% of all units):
Most popular occupations of males: transportation occupations (38.8%); management occupations (except farmers) (22.7%); sales and office occupations (16.5%); construction, extraction, and maintenance occupations (15.5%); production occupations (14.5%); material moving occupations (12.0%); community and social services occupations (7.9%)
Most popular occupations of females: management occupations (except farmers) (39.9%); healthcare practitioners and technical occupations (30.7%); service occupations (27.7%); education, training, and library occupations (15.2%); computer and mathematical occupations (10.6%); business and financial operations occupations (7.8%); sales and office occupations (6.6%)
38th Street Terrace neighborhood detailed profile
Area: 0.001 square miles
Population: 3
Population density:
| 38th Street Terrace: | 2,274 people per square mile |
| Vancouver: | 4,491 people per square mile |
Median household income in 2021:
| 38th Street Terrace: | $166,064 |
| Vancouver: | $69,993 |
Median rent in in 2021:
| 38th Street Terrace: | $1,778 |
| Vancouver: | $1,311 |
Male vs Females
| Males: | 1 |
| Females: | 2 |
Median age
| Males: | 40.8 years |
| Females: | 33.5 years |
Average estimated value of detached houses in 2021 (100.0% of all units):
| 38th Street Terrace: | $330,882 |
| Vancouver: | $457,784 |
Most popular occupations of males: transportation occupations (38.8%); management occupations (except farmers) (22.7%); sales and office occupations (16.5%); construction, extraction, and maintenance occupations (15.5%); production occupations (14.5%); material moving occupations (12.0%); community and social services occupations (7.9%)
Most popular occupations of females: management occupations (except farmers) (39.9%); healthcare practitioners and technical occupations (30.7%); service occupations (27.7%); education, training, and library occupations (15.2%); computer and mathematical occupations (10.6%); business and financial operations occupations (7.8%); sales and office occupations (6.6%)
38th Street Terrace neighborhood detailed profile
Abbey Lane neighborhood in Vancouver statistics: (Find on map)
Area: 0.004 square miles
Population: 20
Population density:
Median household income in 2021:
Median rent in in 2021:
Male vs Females
Median age
Most popular occupations of males: sales and office occupations (22.6%); transportation occupations (19.1%); production occupations (16.6%); management occupations (except farmers) (10.3%); service occupations (9.0%); material moving occupations (7.8%); construction, extraction, and maintenance occupations (4.8%)
Most popular occupations of females: sales and office occupations (39.6%); service occupations (23.7%); business and financial operations occupations (21.9%); construction, extraction, and maintenance occupations (7.1%); arts, design, entertainment, sports, and media occupations (6.8%); transportation occupations (3.7%); life, physical, and social science occupations (3.1%)
Roads and streets: NE 135th Ave.
Abbey Lane neighborhood detailed profile
Area: 0.004 square miles
Population: 20
Population density:
| Abbey Lane: | 4,649 people per square mile |
| Vancouver: | 4,491 people per square mile |
Median household income in 2021:
| Abbey Lane: | $50,179 |
| Vancouver: | $69,993 |
Median rent in in 2021:
| Abbey Lane: | $1,237 |
| Vancouver: | $1,311 |
Male vs Females
| Males: | 10 |
| Females: | 9 |
Median age
| Males: | 26.9 years |
| Females: | 34.8 years |
Most popular occupations of males: sales and office occupations (22.6%); transportation occupations (19.1%); production occupations (16.6%); management occupations (except farmers) (10.3%); service occupations (9.0%); material moving occupations (7.8%); construction, extraction, and maintenance occupations (4.8%)
Most popular occupations of females: sales and office occupations (39.6%); service occupations (23.7%); business and financial operations occupations (21.9%); construction, extraction, and maintenance occupations (7.1%); arts, design, entertainment, sports, and media occupations (6.8%); transportation occupations (3.7%); life, physical, and social science occupations (3.1%)
Roads and streets: NE 135th Ave.
Abbey Lane neighborhood detailed profile
Academy Square neighborhood in Vancouver statistics: (Find on map)
Area: 0.001 square miles
Population: 8
Population density:
Median household income in 2021:
Median rent in in 2021:
Male vs Females
Median age
Most popular occupations of males: management occupations (except farmers) (37.9%); service occupations (15.7%); sales and office occupations (11.7%); computer and mathematical occupations (7.3%); architecture and engineering occupations (5.5%); healthcare practitioners and technical occupations (5.2%); arts, design, entertainment, sports, and media occupations (4.4%)
Most popular occupations of females: service occupations (20.0%); management occupations (except farmers) (18.0%); healthcare practitioners and technical occupations (14.3%); life, physical, and social science occupations (8.6%); material moving occupations (8.6%); business and financial operations occupations (6.5%); education, training, and library occupations (6.1%)
Academy Square neighborhood detailed profile
Area: 0.001 square miles
Population: 8
Population density:
| Academy Square: | 5,669 people per square mile |
| Vancouver: | 4,491 people per square mile |
Median household income in 2021:
| Academy Square: | $58,750 |
| Vancouver: | $69,993 |
Median rent in in 2021:
| Academy Square: | $1,147 |
| Vancouver: | $1,311 |
Male vs Females
| Males: | 4 |
| Females: | 4 |
Median age
| Males: | 31.5 years |
| Females: | 44.2 years |
Most popular occupations of males: management occupations (except farmers) (37.9%); service occupations (15.7%); sales and office occupations (11.7%); computer and mathematical occupations (7.3%); architecture and engineering occupations (5.5%); healthcare practitioners and technical occupations (5.2%); arts, design, entertainment, sports, and media occupations (4.4%)
Most popular occupations of females: service occupations (20.0%); management occupations (except farmers) (18.0%); healthcare practitioners and technical occupations (14.3%); life, physical, and social science occupations (8.6%); material moving occupations (8.6%); business and financial operations occupations (6.5%); education, training, and library occupations (6.1%)
Academy Square neighborhood detailed profile
Adelina Highlands neighborhood in Vancouver statistics: (Find on map)
Area: 0.009 square miles
Roads and streets: NE 16th Ave.
Adelina Highlands neighborhood detailed profile
Area: 0.009 square miles
Roads and streets: NE 16th Ave.
Adelina Highlands neighborhood detailed profile
Adrianna's Place neighborhood in Vancouver statistics: (Find on map)
Area: 0.008 square miles
Adrianna's Place neighborhood detailed profile
Area: 0.008 square miles
Adrianna's Place neighborhood detailed profile
Ahner Hall Mobile Estates neighborhood in Vancouver statistics: (Find on map)
Area: 0.008 square miles
Median household income in 2021:
Median rent in in 2021:
Most popular occupations of males: construction, extraction, and maintenance occupations (53.7%); production occupations (26.2%); material moving occupations (16.2%); sales and office occupations (13.4%); service occupations (10.1%); management occupations (except farmers) (5.6%); healthcare practitioners and technical occupations (5.4%)
Most popular occupations of females: service occupations (63.5%); material moving occupations (20.3%); business and financial operations occupations (4.1%); sales and office occupations (4.1%); farming, fishing, and forestry occupations (4.1%); healthcare practitioners and technical occupations (3.7%); education, training, and library occupations (3.4%)
Ahner Hall Mobile Estates neighborhood detailed profile
Area: 0.008 square miles
Median household income in 2021:
| Ahner Hall Mobile Estates: | $44,531 |
| Vancouver: | $69,993 |
Median rent in in 2021:
| Ahner Hall Mobile Estates: | $653 |
| Vancouver: | $1,311 |
Most popular occupations of males: construction, extraction, and maintenance occupations (53.7%); production occupations (26.2%); material moving occupations (16.2%); sales and office occupations (13.4%); service occupations (10.1%); management occupations (except farmers) (5.6%); healthcare practitioners and technical occupations (5.4%)
Most popular occupations of females: service occupations (63.5%); material moving occupations (20.3%); business and financial operations occupations (4.1%); sales and office occupations (4.1%); farming, fishing, and forestry occupations (4.1%); healthcare practitioners and technical occupations (3.7%); education, training, and library occupations (3.4%)
Ahner Hall Mobile Estates neighborhood detailed profile
Airport Green neighborhood in Vancouver statistics: (Find on map)
Area: 0.101 square miles
Population: 648
Population density:
Median household income in 2021:
Median rent in in 2021:
Male vs Females
Median age
Housing prices:
Average estimated value of detached houses in 2021 (86.4% of all units):
Average estimated value of townhouses or other attached units in 2021 (2.9% of all units):
Most popular occupations of males: production occupations (33.2%); sales and office occupations (23.1%); healthcare practitioners and technical occupations (9.9%); business and financial operations occupations (8.2%); management occupations (except farmers) (4.5%); community and social services occupations (3.5%); architecture and engineering occupations (3.1%)
Most popular occupations of females: sales and office occupations (31.6%); service occupations (24.7%); production occupations (16.1%); business and financial operations occupations (13.4%); healthcare practitioners and technical occupations (5.9%); transportation occupations (5.0%); management occupations (except farmers) (4.2%)
Roads and streets: NE Hearthwood Blvd; NE Airport Dr; NE 138th Ave; NE Piper Rd; NE 6th St; NE 7th Way; NE 8th St; NE Juniper Ave; NE Coast Pine Ave; NE 7th Cir; NE 139th Ave; NE 144th Ave; NE 140th Ave; NE 5th Cir.
Airport Green neighborhood detailed profile
Area: 0.101 square miles
Population: 648
Population density:
| Airport Green: | 6,403 people per square mile |
| Vancouver: | 4,491 people per square mile |
Median household income in 2021:
| Airport Green: | $82,181 |
| Vancouver: | $69,993 |
Median rent in in 2021:
| Airport Green: | $1,552 |
| Vancouver: | $1,311 |
Male vs Females
| Males: | 273 |
| Females: | 374 |
Median age
| Males: | 50.8 years |
| Females: | 42.1 years |
Housing prices:
Average estimated value of detached houses in 2021 (86.4% of all units):
| Airport Green: | $302,313 |
| Vancouver: | $457,784 |
Average estimated value of townhouses or other attached units in 2021 (2.9% of all units):
| This neighborhood: | $296,447 |
| city: | $310,311 |
Most popular occupations of males: production occupations (33.2%); sales and office occupations (23.1%); healthcare practitioners and technical occupations (9.9%); business and financial operations occupations (8.2%); management occupations (except farmers) (4.5%); community and social services occupations (3.5%); architecture and engineering occupations (3.1%)
Most popular occupations of females: sales and office occupations (31.6%); service occupations (24.7%); production occupations (16.1%); business and financial operations occupations (13.4%); healthcare practitioners and technical occupations (5.9%); transportation occupations (5.0%); management occupations (except farmers) (4.2%)
Roads and streets: NE Hearthwood Blvd; NE Airport Dr; NE 138th Ave; NE Piper Rd; NE 6th St; NE 7th Way; NE 8th St; NE Juniper Ave; NE Coast Pine Ave; NE 7th Cir; NE 139th Ave; NE 144th Ave; NE 140th Ave; NE 5th Cir.
Airport Green neighborhood detailed profile
Airport Green Industrial Park neighborhood in Vancouver statistics: (Find on map)
Area: 0.037 square miles
Airport Green Industrial Park neighborhood detailed profile
Area: 0.037 square miles
Airport Green Industrial Park neighborhood detailed profile
Airport Heights neighborhood in Vancouver statistics: (Find on map)
Area: 0.062 square miles
Population: 403
Population density:
Median household income in 2021:
Median rent in in 2021:
Male vs Females
Median age
Housing prices:
Average estimated value of detached houses in 2021 (86.5% of all units):
Average estimated value of townhouses or other attached units in 2021 (2.9% of all units):
Most popular occupations of males: production occupations (33.4%); sales and office occupations (23.1%); healthcare practitioners and technical occupations (9.9%); business and financial operations occupations (8.2%); management occupations (except farmers) (4.5%); community and social services occupations (3.5%); architecture and engineering occupations (3.1%)
Most popular occupations of females: sales and office occupations (31.6%); service occupations (24.6%); production occupations (16.2%); business and financial operations occupations (13.5%); healthcare practitioners and technical occupations (5.9%); management occupations (except farmers) (4.2%); transportation occupations (3.5%)
Roads and streets: NE 7th St; NE 6th St; NE 8th St; NE 152nd Ave; NE 148th Ave; NE 7th Way; NE 150th Ave; NE 151st Ave; NE 149th Ave; NE 150th Ct.
Airport Heights neighborhood detailed profile
Area: 0.062 square miles
Population: 403
Population density:
| Airport Heights: | 6,459 people per square mile |
| Vancouver: | 4,491 people per square mile |
Median household income in 2021:
| Airport Heights: | $82,181 |
| Vancouver: | $69,993 |
Median rent in in 2021:
| Airport Heights: | $1,557 |
| Vancouver: | $1,311 |
Male vs Females
| Males: | 170 |
| Females: | 233 |
Median age
| Males: | 50.8 years |
| Females: | 42.1 years |
Housing prices:
Average estimated value of detached houses in 2021 (86.5% of all units):
| Airport Heights: | $302,313 |
| Vancouver: | $457,784 |
Average estimated value of townhouses or other attached units in 2021 (2.9% of all units):
| This neighborhood: | $296,447 |
| city: | $310,311 |
Most popular occupations of males: production occupations (33.4%); sales and office occupations (23.1%); healthcare practitioners and technical occupations (9.9%); business and financial operations occupations (8.2%); management occupations (except farmers) (4.5%); community and social services occupations (3.5%); architecture and engineering occupations (3.1%)
Most popular occupations of females: sales and office occupations (31.6%); service occupations (24.6%); production occupations (16.2%); business and financial operations occupations (13.5%); healthcare practitioners and technical occupations (5.9%); management occupations (except farmers) (4.2%); transportation occupations (3.5%)
Roads and streets: NE 7th St; NE 6th St; NE 8th St; NE 152nd Ave; NE 148th Ave; NE 7th Way; NE 150th Ave; NE 151st Ave; NE 149th Ave; NE 150th Ct.
Airport Heights neighborhood detailed profile
Akabar Acres neighborhood in Vancouver statistics: (Find on map)
Area: 0.004 square miles
Akabar Acres neighborhood detailed profile
Area: 0.004 square miles
Akabar Acres neighborhood detailed profile
Al-Mi Court neighborhood in Vancouver statistics: (Find on map)
Area: 0.006 square miles
Population: 8
Population density:
Median household income in 2021:
Median rent in in 2021:
Male vs Females
Median age
Most popular occupations of males: management occupations (except farmers) (20.3%); healthcare practitioners and technical occupations (15.1%); business and financial operations occupations (9.9%); legal occupations (7.3%); sales and office occupations (4.7%); construction, extraction, and maintenance occupations (4.7%); material moving occupations (4.0%)
Most popular occupations of females: sales and office occupations (37.5%); service occupations (14.7%); arts, design, entertainment, sports, and media occupations (14.0%); legal occupations (7.4%); computer and mathematical occupations (7.0%); business and financial operations occupations (6.6%); life, physical, and social science occupations (5.6%)
Al-Mi Court neighborhood detailed profile
Area: 0.006 square miles
Population: 8
Population density:
| Al-Mi Court: | 1,349 people per square mile |
| Vancouver: | 4,491 people per square mile |
Median household income in 2021:
| Al-Mi Court: | $103,750 |
| Vancouver: | $69,993 |
Median rent in in 2021:
| Al-Mi Court: | $2,066 |
| Vancouver: | $1,311 |
Male vs Females
| Males: | 3 |
| Females: | 4 |
Median age
| Males: | 56.5 years |
| Females: | 61.8 years |
Most popular occupations of males: management occupations (except farmers) (20.3%); healthcare practitioners and technical occupations (15.1%); business and financial operations occupations (9.9%); legal occupations (7.3%); sales and office occupations (4.7%); construction, extraction, and maintenance occupations (4.7%); material moving occupations (4.0%)
Most popular occupations of females: sales and office occupations (37.5%); service occupations (14.7%); arts, design, entertainment, sports, and media occupations (14.0%); legal occupations (7.4%); computer and mathematical occupations (7.0%); business and financial operations occupations (6.6%); life, physical, and social science occupations (5.6%)
Al-Mi Court neighborhood detailed profile
Alder Glen neighborhood in Vancouver statistics: (Find on map)
Area: 0.013 square miles
Population: 20
Population density:
Median household income in 2021:
Median rent in in 2021:
Male vs Females
Median age
Most popular occupations of males: construction, extraction, and maintenance occupations (26.8%); production occupations (20.7%); service occupations (19.5%); sales and office occupations (14.2%); transportation occupations (11.0%); architecture and engineering occupations (9.8%); management occupations (except farmers) (7.3%)
Most popular occupations of females: management occupations (except farmers) (32.7%); sales and office occupations (24.5%); business and financial operations occupations (18.2%); healthcare practitioners and technical occupations (15.5%); life, physical, and social science occupations (13.6%); arts, design, entertainment, sports, and media occupations (11.8%); production occupations (7.6%)
Alder Glen neighborhood detailed profile
Area: 0.013 square miles
Population: 20
Population density:
| Alder Glen: | 1,518 people per square mile |
| Vancouver: | 4,491 people per square mile |
Median household income in 2021:
| Alder Glen: | $70,179 |
| Vancouver: | $69,993 |
Median rent in in 2021:
| Alder Glen: | $1,527 |
| Vancouver: | $1,311 |
Male vs Females
| Males: | 11 |
| Females: | 9 |
Median age
| Males: | 47.5 years |
| Females: | 55.5 years |
Most popular occupations of males: construction, extraction, and maintenance occupations (26.8%); production occupations (20.7%); service occupations (19.5%); sales and office occupations (14.2%); transportation occupations (11.0%); architecture and engineering occupations (9.8%); management occupations (except farmers) (7.3%)
Most popular occupations of females: management occupations (except farmers) (32.7%); sales and office occupations (24.5%); business and financial operations occupations (18.2%); healthcare practitioners and technical occupations (15.5%); life, physical, and social science occupations (13.6%); arts, design, entertainment, sports, and media occupations (11.8%); production occupations (7.6%)
Alder Glen neighborhood detailed profile
Alexander Tracts neighborhood in Vancouver statistics: (Find on map)
Area: 0.014 square miles
Population: 83
Population density:
Median household income in 2021:
Median rent in in 2021:
Male vs Females
Median age
Most popular occupations of males: sales and office occupations (30.4%); production occupations (24.0%); material moving occupations (16.0%); service occupations (10.5%); transportation occupations (7.2%); arts, design, entertainment, sports, and media occupations (4.5%); computer and mathematical occupations (3.8%)
Most popular occupations of females: service occupations (33.7%); sales and office occupations (25.5%); arts, design, entertainment, sports, and media occupations (20.7%); business and financial operations occupations (5.2%); healthcare practitioners and technical occupations (4.2%); management occupations (except farmers) (2.2%); education, training, and library occupations (2.0%)
Alexander Tracts neighborhood detailed profile
Area: 0.014 square miles
Population: 83
Population density:
| Alexander Tracts: | 5,879 people per square mile |
| Vancouver: | 4,491 people per square mile |
Median household income in 2021:
| Alexander Tracts: | $79,111 |
| Vancouver: | $69,993 |
Median rent in in 2021:
| Alexander Tracts: | $1,263 |
| Vancouver: | $1,311 |
Male vs Females
| Males: | 31 |
| Females: | 52 |
Median age
| Males: | 35.5 years |
| Females: | 38.2 years |
Most popular occupations of males: sales and office occupations (30.4%); production occupations (24.0%); material moving occupations (16.0%); service occupations (10.5%); transportation occupations (7.2%); arts, design, entertainment, sports, and media occupations (4.5%); computer and mathematical occupations (3.8%)
Most popular occupations of females: service occupations (33.7%); sales and office occupations (25.5%); arts, design, entertainment, sports, and media occupations (20.7%); business and financial operations occupations (5.2%); healthcare practitioners and technical occupations (4.2%); management occupations (except farmers) (2.2%); education, training, and library occupations (2.0%)
Alexander Tracts neighborhood detailed profile
Alice Meadows neighborhood in Vancouver statistics: (Find on map)
Area: 0.004 square miles
Alice Meadows neighborhood detailed profile
Area: 0.004 square miles
Alice Meadows neighborhood detailed profile
Alicias Glen neighborhood in Vancouver statistics: (Find on map)
Area: 0.004 square miles
Alicias Glen neighborhood detailed profile
Area: 0.004 square miles
Alicias Glen neighborhood detailed profile
Allison Heights neighborhood in Vancouver statistics: (Find on map)
Area: 0.009 square miles
Population: 33
Population density:
Median household income in 2021:
Median rent in in 2021:
Male vs Females
Median age
Average estimated value of detached houses in 2021 (43.8% of all units):
Most popular occupations of males: production occupations (21.0%); sales and office occupations (15.5%); architecture and engineering occupations (14.9%); management occupations (except farmers) (13.4%); business and financial operations occupations (10.8%); transportation occupations (10.5%); computer and mathematical occupations (9.3%)
Most popular occupations of females: service occupations (58.0%); farming, fishing, and forestry occupations (12.4%); business and financial operations occupations (8.9%); management occupations (except farmers) (6.3%); education, training, and library occupations (6.3%); production occupations (5.7%); sales and office occupations (4.8%)
Roads and streets: NE 19th St.
Allison Heights neighborhood detailed profile
Area: 0.009 square miles
Population: 33
Population density:
| Allison Heights: | 3,696 people per square mile |
| Vancouver: | 4,491 people per square mile |
Median household income in 2021:
| Allison Heights: | $50,208 |
| Vancouver: | $69,993 |
Median rent in in 2021:
| Allison Heights: | $1,457 |
| Vancouver: | $1,311 |
Male vs Females
| Males: | 12 |
| Females: | 20 |
Median age
| Males: | 40.3 years |
| Females: | 38.8 years |
Average estimated value of detached houses in 2021 (43.8% of all units):
| Allison Heights: | $306,226 |
| Vancouver: | $457,784 |
Most popular occupations of males: production occupations (21.0%); sales and office occupations (15.5%); architecture and engineering occupations (14.9%); management occupations (except farmers) (13.4%); business and financial operations occupations (10.8%); transportation occupations (10.5%); computer and mathematical occupations (9.3%)
Most popular occupations of females: service occupations (58.0%); farming, fishing, and forestry occupations (12.4%); business and financial operations occupations (8.9%); management occupations (except farmers) (6.3%); education, training, and library occupations (6.3%); production occupations (5.7%); sales and office occupations (4.8%)
Roads and streets: NE 19th St.
Allison Heights neighborhood detailed profile
Allman Park neighborhood in Vancouver statistics: (Find on map)
Area: 0.049 square miles
Population: 169
Population density:
Median household income in 2021:
Male vs Females
Median age
Most popular occupations of males: sales and office occupations (23.9%); transportation occupations (10.7%); computer and mathematical occupations (9.3%); community and social services occupations (9.3%); management occupations (except farmers) (8.2%); business and financial operations occupations (8.0%); service occupations (6.4%)
Most popular occupations of females: sales and office occupations (24.4%); management occupations (except farmers) (22.3%); healthcare practitioners and technical occupations (13.9%); service occupations (11.0%); education, training, and library occupations (8.6%); computer and mathematical occupations (7.0%); business and financial operations occupations (6.2%)
Roads and streets: SE 39th St; SE 168th Ave.
Allman Park neighborhood detailed profile
Area: 0.049 square miles
Population: 169
Population density:
| Allman Park: | 3,422 people per square mile |
| Vancouver: | 4,491 people per square mile |
Median household income in 2021:
| Allman Park: | $88,917 |
| Vancouver: | $69,993 |
Male vs Females
| Males: | 86 |
| Females: | 82 |
Median age
| Males: | 49.0 years |
| Females: | 55.5 years |
Most popular occupations of males: sales and office occupations (23.9%); transportation occupations (10.7%); computer and mathematical occupations (9.3%); community and social services occupations (9.3%); management occupations (except farmers) (8.2%); business and financial operations occupations (8.0%); service occupations (6.4%)
Most popular occupations of females: sales and office occupations (24.4%); management occupations (except farmers) (22.3%); healthcare practitioners and technical occupations (13.9%); service occupations (11.0%); education, training, and library occupations (8.6%); computer and mathematical occupations (7.0%); business and financial operations occupations (6.2%)
Roads and streets: SE 39th St; SE 168th Ave.
Allman Park neighborhood detailed profile
Allum Acres neighborhood in Vancouver statistics: (Find on map)
Area: 0.006 square miles
Population: 15
Population density:
Median household income in 2021:
Median rent in in 2021:
Male vs Females
Median age
Most popular occupations of males: sales and office occupations (32.1%); education, training, and library occupations (11.8%); production occupations (11.6%); service occupations (11.1%); management occupations (except farmers) (9.9%); material moving occupations (7.1%); transportation occupations (4.5%)
Most popular occupations of females: service occupations (41.8%); sales and office occupations (23.3%); production occupations (13.4%); transportation occupations (6.9%); education, training, and library occupations (3.8%); healthcare practitioners and technical occupations (3.4%); business and financial operations occupations (2.5%)
Allum Acres neighborhood detailed profile
Area: 0.006 square miles
Population: 15
Population density:
| Allum Acres: | 2,451 people per square mile |
| Vancouver: | 4,491 people per square mile |
Median household income in 2021:
| Allum Acres: | $54,406 |
| Vancouver: | $69,993 |
Median rent in in 2021:
| Allum Acres: | $1,294 |
| Vancouver: | $1,311 |
Male vs Females
| Males: | 8 |
| Females: | 7 |
Median age
| Males: | 29.6 years |
| Females: | 30.7 years |
Most popular occupations of males: sales and office occupations (32.1%); education, training, and library occupations (11.8%); production occupations (11.6%); service occupations (11.1%); management occupations (except farmers) (9.9%); material moving occupations (7.1%); transportation occupations (4.5%)
Most popular occupations of females: service occupations (41.8%); sales and office occupations (23.3%); production occupations (13.4%); transportation occupations (6.9%); education, training, and library occupations (3.8%); healthcare practitioners and technical occupations (3.4%); business and financial operations occupations (2.5%)
Allum Acres neighborhood detailed profile
Allwood Estates neighborhood in Vancouver statistics: (Find on map)
Area: 0.035 square miles
Roads and streets: SE 12th St; SE 13th St; SE 95th Ave; SE 14th St; SE 96th Ave; SE 15th St.
Allwood Estates neighborhood detailed profile
Area: 0.035 square miles
Roads and streets: SE 12th St; SE 13th St; SE 95th Ave; SE 14th St; SE 96th Ave; SE 15th St.
Allwood Estates neighborhood detailed profile
Allwood Manor neighborhood in Vancouver statistics: (Find on map)
Area: 0.126 square miles
Population: 430
Population density:
Median household income in 2021:
Median rent in in 2021:
Male vs Females
Median age
Most popular occupations of males: construction, extraction, and maintenance occupations (16.8%); sales and office occupations (13.4%); business and financial operations occupations (13.0%); management occupations (except farmers) (12.8%); architecture and engineering occupations (7.1%); production occupations (6.8%); material moving occupations (6.8%)
Most popular occupations of females: sales and office occupations (25.9%); management occupations (except farmers) (24.9%); service occupations (14.0%); community and social services occupations (9.6%); life, physical, and social science occupations (6.8%); computer and mathematical occupations (6.1%); business and financial operations occupations (5.1%)
Roads and streets: SE 94th Ave; SE 95th Ave; SE 98th Ave; SE 96th Ave; Silver Star Ave; St Helens Ave; SE Butte Ave (Butte Ave); Boulder Ave; SE 97th Ave; SE 5th St; SE 7th St; SE 6th St.
Allwood Manor neighborhood detailed profile
Area: 0.126 square miles
Population: 430
Population density:
| Allwood Manor: | 3,404 people per square mile |
| Vancouver: | 4,491 people per square mile |
Median household income in 2021:
| Allwood Manor: | $72,688 |
| Vancouver: | $69,993 |
Median rent in in 2021:
| Allwood Manor: | $1,231 |
| Vancouver: | $1,311 |
Male vs Females
| Males: | 190 |
| Females: | 240 |
Median age
| Males: | 45.7 years |
| Females: | 47.6 years |
Most popular occupations of males: construction, extraction, and maintenance occupations (16.8%); sales and office occupations (13.4%); business and financial operations occupations (13.0%); management occupations (except farmers) (12.8%); architecture and engineering occupations (7.1%); production occupations (6.8%); material moving occupations (6.8%)
Most popular occupations of females: sales and office occupations (25.9%); management occupations (except farmers) (24.9%); service occupations (14.0%); community and social services occupations (9.6%); life, physical, and social science occupations (6.8%); computer and mathematical occupations (6.1%); business and financial operations occupations (5.1%)
Roads and streets: SE 94th Ave; SE 95th Ave; SE 98th Ave; SE 96th Ave; Silver Star Ave; St Helens Ave; SE Butte Ave (Butte Ave); Boulder Ave; SE 97th Ave; SE 5th St; SE 7th St; SE 6th St.
Allwood Manor neighborhood detailed profile
Allwood Terrace neighborhood in Vancouver statistics: (Find on map)
Area: 0.018 square miles
Roads and streets: SE 104th Ct; SE 16th St; SE 103rd Ave; SE 15th St.
Allwood Terrace neighborhood detailed profile
Area: 0.018 square miles
Roads and streets: SE 104th Ct; SE 16th St; SE 103rd Ave; SE 15th St.
Allwood Terrace neighborhood detailed profile
Alpine Meadows neighborhood in Vancouver statistics: (Find on map)
Area: 0.017 square miles
Population: 83
Population density:
Median household income in 2021:
Median rent in in 2021:
Male vs Females
Median age
Most popular occupations of males: sales and office occupations (25.5%); construction, extraction, and maintenance occupations (18.1%); management occupations (except farmers) (16.3%); service occupations (12.8%); transportation occupations (10.1%); material moving occupations (6.8%); production occupations (6.4%)
Most popular occupations of females: service occupations (30.6%); education, training, and library occupations (16.1%); sales and office occupations (15.9%); management occupations (except farmers) (8.3%); healthcare practitioners and technical occupations (7.0%); legal occupations (6.2%); arts, design, entertainment, sports, and media occupations (6.2%)
Roads and streets: NE Alpine St; NE 10th St; NE 93rd Ave.
Alpine Meadows neighborhood detailed profile
Area: 0.017 square miles
Population: 83
Population density:
| Alpine Meadows: | 4,824 people per square mile |
| Vancouver: | 4,491 people per square mile |
Median household income in 2021:
| Alpine Meadows: | $81,405 |
| Vancouver: | $69,993 |
Median rent in in 2021:
| Alpine Meadows: | $1,387 |
| Vancouver: | $1,311 |
Male vs Females
| Males: | 33 |
| Females: | 50 |
Median age
| Males: | 42.1 years |
| Females: | 42.6 years |
Most popular occupations of males: sales and office occupations (25.5%); construction, extraction, and maintenance occupations (18.1%); management occupations (except farmers) (16.3%); service occupations (12.8%); transportation occupations (10.1%); material moving occupations (6.8%); production occupations (6.4%)
Most popular occupations of females: service occupations (30.6%); education, training, and library occupations (16.1%); sales and office occupations (15.9%); management occupations (except farmers) (8.3%); healthcare practitioners and technical occupations (7.0%); legal occupations (6.2%); arts, design, entertainment, sports, and media occupations (6.2%)
Roads and streets: NE Alpine St; NE 10th St; NE 93rd Ave.
Alpine Meadows neighborhood detailed profile
Alpine View neighborhood in Vancouver statistics: (Find on map)
Area: 0.060 square miles
Population: 282
Population density:
Median household income in 2021:
Median rent in in 2021:
Male vs Females
Median age
Most popular occupations of males: sales and office occupations (22.6%); transportation occupations (19.1%); production occupations (16.6%); management occupations (except farmers) (10.3%); service occupations (9.0%); material moving occupations (7.8%); construction, extraction, and maintenance occupations (4.8%)
Most popular occupations of females: sales and office occupations (39.6%); service occupations (23.7%); business and financial operations occupations (21.9%); construction, extraction, and maintenance occupations (7.1%); arts, design, entertainment, sports, and media occupations (6.8%); transportation occupations (2.8%); life, physical, and social science occupations (2.3%)
Roads and streets: NE 73rd St; NE 147th Ave; NE 74th St; NE 145th Ct; NE 141st Ave; NE 142nd Ave; NE 143rd Ct; NE 71st St; NE 70th St; NE 146th Ave.
Alpine View neighborhood detailed profile
Area: 0.060 square miles
Population: 282
Population density:
| Alpine View: | 4,674 people per square mile |
| Vancouver: | 4,491 people per square mile |
Median household income in 2021:
| Alpine View: | $50,179 |
| Vancouver: | $69,993 |
Median rent in in 2021:
| Alpine View: | $1,237 |
| Vancouver: | $1,311 |
Male vs Females
| Males: | 145 |
| Females: | 136 |
Median age
| Males: | 26.9 years |
| Females: | 34.8 years |
Most popular occupations of males: sales and office occupations (22.6%); transportation occupations (19.1%); production occupations (16.6%); management occupations (except farmers) (10.3%); service occupations (9.0%); material moving occupations (7.8%); construction, extraction, and maintenance occupations (4.8%)
Most popular occupations of females: sales and office occupations (39.6%); service occupations (23.7%); business and financial operations occupations (21.9%); construction, extraction, and maintenance occupations (7.1%); arts, design, entertainment, sports, and media occupations (6.8%); transportation occupations (2.8%); life, physical, and social science occupations (2.3%)
Roads and streets: NE 73rd St; NE 147th Ave; NE 74th St; NE 145th Ct; NE 141st Ave; NE 142nd Ave; NE 143rd Ct; NE 71st St; NE 70th St; NE 146th Ave.
Alpine View neighborhood detailed profile
Alpine West neighborhood in Vancouver statistics: (Find on map)
Area: 0.003 square miles
Population: 14
Population density:
Median household income in 2021:
Median rent in in 2021:
Male vs Females
Median age
Most popular occupations of males: sales and office occupations (22.6%); transportation occupations (19.1%); production occupations (16.6%); management occupations (except farmers) (10.3%); service occupations (9.0%); material moving occupations (7.8%); construction, extraction, and maintenance occupations (4.8%)
Most popular occupations of females: sales and office occupations (39.6%); service occupations (23.7%); business and financial operations occupations (21.9%); construction, extraction, and maintenance occupations (7.1%); arts, design, entertainment, sports, and media occupations (6.8%); transportation occupations (2.8%); life, physical, and social science occupations (2.3%)
Alpine West neighborhood detailed profile
Area: 0.003 square miles
Population: 14
Population density:
| Alpine West: | 4,652 people per square mile |
| Vancouver: | 4,491 people per square mile |
Median household income in 2021:
| Alpine West: | $50,179 |
| Vancouver: | $69,993 |
Median rent in in 2021:
| Alpine West: | $1,237 |
| Vancouver: | $1,311 |
Male vs Females
| Males: | 7 |
| Females: | 6 |
Median age
| Males: | 26.9 years |
| Females: | 34.8 years |
Most popular occupations of males: sales and office occupations (22.6%); transportation occupations (19.1%); production occupations (16.6%); management occupations (except farmers) (10.3%); service occupations (9.0%); material moving occupations (7.8%); construction, extraction, and maintenance occupations (4.8%)
Most popular occupations of females: sales and office occupations (39.6%); service occupations (23.7%); business and financial operations occupations (21.9%); construction, extraction, and maintenance occupations (7.1%); arts, design, entertainment, sports, and media occupations (6.8%); transportation occupations (2.8%); life, physical, and social science occupations (2.3%)
Alpine West neighborhood detailed profile
Alys Woods neighborhood in Vancouver statistics: (Find on map)
Area: 0.012 square miles
Roads and streets: NE 134th Cir; NE 42nd Ave.
Alys Woods neighborhood detailed profile
Area: 0.012 square miles
Roads and streets: NE 134th Cir; NE 42nd Ave.
Alys Woods neighborhood detailed profile
Amhurst Commons neighborhood in Vancouver statistics: (Find on map)
Area: 0.007 square miles
Amhurst Commons neighborhood detailed profile
Area: 0.007 square miles
Amhurst Commons neighborhood detailed profile
Ampere Acres neighborhood in Vancouver statistics: (Find on map)
Area: 0.011 square miles
Roads and streets: NE 14th Ave; NE 43rd St.
Ampere Acres neighborhood detailed profile
Area: 0.011 square miles
Roads and streets: NE 14th Ave; NE 43rd St.
Ampere Acres neighborhood detailed profile
Ampere Heights neighborhood in Vancouver statistics: (Find on map)
Area: 0.032 square miles
Population: 346
Population density:
Median household income in 2021:
Median rent in in 2021:
Male vs Females
Median age
Housing prices:
Average estimated value of detached houses in 2021 (18.2% of all units):
Average estimated value of mobile home in 2021 (3.2% of all units):
Most popular occupations of males: service occupations (23.9%); sales and office occupations (13.7%); business and financial operations occupations (11.9%); construction, extraction, and maintenance occupations (6.0%); material moving occupations (4.7%); transportation occupations (4.5%); management occupations (except farmers) (4.3%)
Most popular occupations of females: service occupations (38.2%); sales and office occupations (26.6%); healthcare practitioners and technical occupations (8.5%); education, training, and library occupations (6.9%); community and social services occupations (6.8%); business and financial operations occupations (4.4%); management occupations (except farmers) (3.1%)
Roads and streets: E 20th St.
Ampere Heights neighborhood detailed profile
Area: 0.032 square miles
Population: 346
Population density:
| Ampere Heights: | 10,935 people per square mile |
| Vancouver: | 4,491 people per square mile |
Median household income in 2021:
| Ampere Heights: | $47,467 |
| Vancouver: | $69,993 |
Median rent in in 2021:
| Ampere Heights: | $858 |
| Vancouver: | $1,311 |
Male vs Females
| Males: | 157 |
| Females: | 189 |
Median age
| Males: | 33.2 years |
| Females: | 31.4 years |
Housing prices:
Average estimated value of detached houses in 2021 (18.2% of all units):
| Ampere Heights: | $218,182 |
| Vancouver: | $457,784 |
Average estimated value of mobile home in 2021 (3.2% of all units):
| Ampere Heights: | $40,000 |
| Vancouver: | $109,677 |
Most popular occupations of males: service occupations (23.9%); sales and office occupations (13.7%); business and financial operations occupations (11.9%); construction, extraction, and maintenance occupations (6.0%); material moving occupations (4.7%); transportation occupations (4.5%); management occupations (except farmers) (4.3%)
Most popular occupations of females: service occupations (38.2%); sales and office occupations (26.6%); healthcare practitioners and technical occupations (8.5%); education, training, and library occupations (6.9%); community and social services occupations (6.8%); business and financial operations occupations (4.4%); management occupations (except farmers) (3.1%)
Roads and streets: E 20th St.
Ampere Heights neighborhood detailed profile
Amphere Heights neighborhood in Vancouver statistics: (Find on map)
Area: 0.011 square miles
Amphere Heights neighborhood detailed profile
Area: 0.011 square miles
Amphere Heights neighborhood detailed profile
Andersen neighborhood in Vancouver statistics: (Find on map)
Area: 2.292 square miles
Population: 5,307
Population density:
Median household income in 2021:
Median rent in in 2021:
Male vs Females
Median age
Housing prices:
Average estimated value of detached houses in 2021 (82.9% of all units):
Average estimated value of townhouses or other attached units in 2021 (13.6% of all units):
Most popular occupations of males: production occupations (21.8%); management occupations (except farmers) (12.6%); construction, extraction, and maintenance occupations (9.2%); service occupations (9.0%); sales and office occupations (8.1%); transportation occupations (6.1%); community and social services occupations (5.0%)
Most popular occupations of females: service occupations (25.6%); management occupations (except farmers) (21.4%); sales and office occupations (15.6%); healthcare practitioners and technical occupations (12.6%); business and financial operations occupations (7.6%); life, physical, and social science occupations (3.5%); arts, design, entertainment, sports, and media occupations (3.0%)
Limited-access highways (interstate or state) in this neighborhood: I- 205.
Highways in this neighborhood: NE Padden Pkwy.
Roads and streets: NE 78th St; NE 88th St; NE 53rd Ave; NE 58th Ave; I-205; NE 70th St; NE 68th St; NE Andresen Rd; NE St Johns Rd; NE 63rd St; NE 51st Ave; NE 55th Ave; NE 75th St; NE 95th St; NE Issler St; NE 76th St; NE 62nd Ave; NE 47th Ave; NE 102nd St; NE 63rd Ave; NE 56th Ave; NE 40th Ave; NE 61st Ave; NE 99th St; NE Andresen Rd (NE 69th Ave); NE 67th St (NE 67th Way); NE 71st St; NE 65th St; NE 74th St; NE 101st St; NE Andresen Rd (NE 15th Ave); NE 101st Cir; NE 66th Ave; NE 84th St; NE 72nd Cir; NE Erin Way; NE 43rd Ave; NE 64th St; NE 59th Ave; NE 65th Ave; NE 48th Ave; NE 103rd St; NE 74th Cir; NE 77th St; NE 76th Cir; NE 64th Ave; NE 69th St; NE 39th Ct; NE 73rd Cir; NE 104th St; NE 52nd Ct; NE 97th St; NE 69th Cir; NE 64th Ct; NE 56th Ct; NE 62nd Ct; NE 54th Ave; NE Manor Dr; NE 65th Pl; NE 98th St; NE 94th St; NE 61st Ct; NE 67th Cir; NE 105th St; NE 54th Pl; NE 54th Ct; NE 67th Ave; NE 60th Ave; NE 100th Cir; NE 68th Cir; NE 70th Cir; NE 51st Pl; NE Banton Dr; NE 65th Ct; NE 67th Way; NE 73rd St; NE 35th Ave; NE 75th Cir; NE 57th Ct; 67th Way.
Railroad features: Lewis and Clark RR.
Andersen neighborhood detailed profile
Area: 2.292 square miles
Population: 5,307
Population density:
| Andersen (St. John): | 2,316 people per square mile |
| Vancouver: | 4,491 people per square mile |
Median household income in 2021:
| Andersen (St. John): | $83,084 |
| Vancouver: | $69,993 |
Median rent in in 2021:
| Andersen (St. John): | $1,326 |
| Vancouver: | $1,311 |
Male vs Females
| Males: | 2,933 |
| Females: | 2,374 |
Median age
| Males: | 41.6 years |
| Females: | 52.5 years |
Housing prices:
Average estimated value of detached houses in 2021 (82.9% of all units):
| Andersen (St. John): | $309,967 |
| Vancouver: | $457,784 |
Average estimated value of townhouses or other attached units in 2021 (13.6% of all units):
| This neighborhood: | $65,901 |
| city: | $310,311 |
Most popular occupations of males: production occupations (21.8%); management occupations (except farmers) (12.6%); construction, extraction, and maintenance occupations (9.2%); service occupations (9.0%); sales and office occupations (8.1%); transportation occupations (6.1%); community and social services occupations (5.0%)
Most popular occupations of females: service occupations (25.6%); management occupations (except farmers) (21.4%); sales and office occupations (15.6%); healthcare practitioners and technical occupations (12.6%); business and financial operations occupations (7.6%); life, physical, and social science occupations (3.5%); arts, design, entertainment, sports, and media occupations (3.0%)
Limited-access highways (interstate or state) in this neighborhood: I- 205.
Highways in this neighborhood: NE Padden Pkwy.
Roads and streets: NE 78th St; NE 88th St; NE 53rd Ave; NE 58th Ave; I-205; NE 70th St; NE 68th St; NE Andresen Rd; NE St Johns Rd; NE 63rd St; NE 51st Ave; NE 55th Ave; NE 75th St; NE 95th St; NE Issler St; NE 76th St; NE 62nd Ave; NE 47th Ave; NE 102nd St; NE 63rd Ave; NE 56th Ave; NE 40th Ave; NE 61st Ave; NE 99th St; NE Andresen Rd (NE 69th Ave); NE 67th St (NE 67th Way); NE 71st St; NE 65th St; NE 74th St; NE 101st St; NE Andresen Rd (NE 15th Ave); NE 101st Cir; NE 66th Ave; NE 84th St; NE 72nd Cir; NE Erin Way; NE 43rd Ave; NE 64th St; NE 59th Ave; NE 65th Ave; NE 48th Ave; NE 103rd St; NE 74th Cir; NE 77th St; NE 76th Cir; NE 64th Ave; NE 69th St; NE 39th Ct; NE 73rd Cir; NE 104th St; NE 52nd Ct; NE 97th St; NE 69th Cir; NE 64th Ct; NE 56th Ct; NE 62nd Ct; NE 54th Ave; NE Manor Dr; NE 65th Pl; NE 98th St; NE 94th St; NE 61st Ct; NE 67th Cir; NE 105th St; NE 54th Pl; NE 54th Ct; NE 67th Ave; NE 60th Ave; NE 100th Cir; NE 68th Cir; NE 70th Cir; NE 51st Pl; NE Banton Dr; NE 65th Ct; NE 67th Way; NE 73rd St; NE 35th Ave; NE 75th Cir; NE 57th Ct; 67th Way.
Railroad features: Lewis and Clark RR.
Andersen neighborhood detailed profile
Andersons Capitol Hill neighborhood in Vancouver statistics: (Find on map)
Area: 0.007 square miles
Population: 43
Population density:
Median household income in 2021:
Median rent in in 2021:
Male vs Females
Median age
Average estimated value of detached houses in 2021 (80.0% of all units):
Most popular occupations of males: management occupations (except farmers) (27.5%); sales and office occupations (12.3%); service occupations (10.4%); healthcare practitioners and technical occupations (9.7%); construction, extraction, and maintenance occupations (7.8%); material moving occupations (7.8%); computer and mathematical occupations (6.7%)
Most popular occupations of females: management occupations (except farmers) (23.2%); sales and office occupations (19.9%); education, training, and library occupations (15.5%); business and financial operations occupations (12.2%); service occupations (12.2%); community and social services occupations (6.1%); life, physical, and social science occupations (4.4%)
Andersons Capitol Hill neighborhood detailed profile
Area: 0.007 square miles
Population: 43
Population density:
| Andersons Capitol Hill: | 5,820 people per square mile |
| Vancouver: | 4,491 people per square mile |
Median household income in 2021:
| Andersons Capitol Hill: | $83,750 |
| Vancouver: | $69,993 |
Median rent in in 2021:
| Andersons Capitol Hill: | $1,204 |
| Vancouver: | $1,311 |
Male vs Females
| Males: | 24 |
| Females: | 19 |
Median age
| Males: | 31.8 years |
| Females: | 39.0 years |
Average estimated value of detached houses in 2021 (80.0% of all units):
| Andersons Capitol Hill: | $355,384 |
| Vancouver: | $457,784 |
Most popular occupations of males: management occupations (except farmers) (27.5%); sales and office occupations (12.3%); service occupations (10.4%); healthcare practitioners and technical occupations (9.7%); construction, extraction, and maintenance occupations (7.8%); material moving occupations (7.8%); computer and mathematical occupations (6.7%)
Most popular occupations of females: management occupations (except farmers) (23.2%); sales and office occupations (19.9%); education, training, and library occupations (15.5%); business and financial operations occupations (12.2%); service occupations (12.2%); community and social services occupations (6.1%); life, physical, and social science occupations (4.4%)
Andersons Capitol Hill neighborhood detailed profile
Andreas Meadow neighborhood in Vancouver statistics: (Find on map)
Area: 0.051 square miles
Population: 31
Population density:
Median household income in 2021:
Median rent in in 2021:
Male vs Females
Median age
Most popular occupations of males: sales and office occupations (17.3%); service occupations (12.7%); management occupations (except farmers) (12.1%); education, training, and library occupations (9.5%); production occupations (9.0%); material moving occupations (8.0%); construction, extraction, and maintenance occupations (7.9%)
Most popular occupations of females: sales and office occupations (38.6%); service occupations (17.7%); management occupations (except farmers) (12.0%); healthcare practitioners and technical occupations (7.3%); transportation occupations (7.0%); education, training, and library occupations (6.0%); legal occupations (4.3%)
Roads and streets: NE 176th Ave; NE 72nd St.
Other features: Fifth Plain Crk.
Andreas Meadow neighborhood detailed profile
Area: 0.051 square miles
Population: 31
Population density:
| Andreas Meadow: | 611 people per square mile |
| Vancouver: | 4,491 people per square mile |
Median household income in 2021:
| Andreas Meadow: | $95,230 |
| Vancouver: | $69,993 |
Median rent in in 2021:
| Andreas Meadow: | $1,750 |
| Vancouver: | $1,311 |
Male vs Females
| Males: | 15 |
| Females: | 15 |
Median age
| Males: | 29.1 years |
| Females: | 32.9 years |
Most popular occupations of males: sales and office occupations (17.3%); service occupations (12.7%); management occupations (except farmers) (12.1%); education, training, and library occupations (9.5%); production occupations (9.0%); material moving occupations (8.0%); construction, extraction, and maintenance occupations (7.9%)
Most popular occupations of females: sales and office occupations (38.6%); service occupations (17.7%); management occupations (except farmers) (12.0%); healthcare practitioners and technical occupations (7.3%); transportation occupations (7.0%); education, training, and library occupations (6.0%); legal occupations (4.3%)
Roads and streets: NE 176th Ave; NE 72nd St.
Other features: Fifth Plain Crk.
Andreas Meadow neighborhood detailed profile
Andresen Highland neighborhood in Vancouver statistics: (Find on map)
Area: 0.194 square miles
Population: 744
Population density:
Median household income in 2021:
Median rent in in 2021:
Male vs Females
Median age
Most popular occupations of males: sales and office occupations (33.0%); service occupations (18.7%); construction, extraction, and maintenance occupations (10.2%); management occupations (except farmers) (9.8%); material moving occupations (5.8%); production occupations (4.6%); business and financial operations occupations (2.8%)
Most popular occupations of females: sales and office occupations (31.7%); service occupations (18.0%); healthcare practitioners and technical occupations (16.0%); architecture and engineering occupations (8.0%); management occupations (except farmers) (7.3%); business and financial operations occupations (6.0%); transportation occupations (5.6%)
Roads and streets: Tennessee Ln; St Louis Way; Carolina Ln; Louisiana Dr; Mississippi Dr; N Knoxville Way; Kentucky Dr; Ohio Dr; Flint Way; Shreveport Way; Louisville Way; Little Rock Way; Lexington Way; N Nashville Way; Memphis Way; Birmingham Way; S Knoxville Way; Missouri Dr; Mobile Way; S Nashville Way.
Andresen Highland neighborhood detailed profile
Area: 0.194 square miles
Population: 744
Population density:
| Andresen Highland: | 3,836 people per square mile |
| Vancouver: | 4,491 people per square mile |
Median household income in 2021:
| Andresen Highland: | $83,630 |
| Vancouver: | $69,993 |
Median rent in in 2021:
| Andresen Highland: | $1,372 |
| Vancouver: | $1,311 |
Male vs Females
| Males: | 330 |
| Females: | 414 |
Median age
| Males: | 48.8 years |
| Females: | 38.0 years |
Most popular occupations of males: sales and office occupations (33.0%); service occupations (18.7%); construction, extraction, and maintenance occupations (10.2%); management occupations (except farmers) (9.8%); material moving occupations (5.8%); production occupations (4.6%); business and financial operations occupations (2.8%)
Most popular occupations of females: sales and office occupations (31.7%); service occupations (18.0%); healthcare practitioners and technical occupations (16.0%); architecture and engineering occupations (8.0%); management occupations (except farmers) (7.3%); business and financial operations occupations (6.0%); transportation occupations (5.6%)
Roads and streets: Tennessee Ln; St Louis Way; Carolina Ln; Louisiana Dr; Mississippi Dr; N Knoxville Way; Kentucky Dr; Ohio Dr; Flint Way; Shreveport Way; Louisville Way; Little Rock Way; Lexington Way; N Nashville Way; Memphis Way; Birmingham Way; S Knoxville Way; Missouri Dr; Mobile Way; S Nashville Way.
Andresen Highland neighborhood detailed profile
Andrew John Estates neighborhood in Vancouver statistics: (Find on map)
Area: 0.006 square miles
Andrew John Estates neighborhood detailed profile
Area: 0.006 square miles
Andrew John Estates neighborhood detailed profile
Andrews Court neighborhood in Vancouver statistics: (Find on map)
Area: 0.008 square miles
Population: 29
Population density:
Median household income in 2021:
Median rent in in 2021:
Male vs Females
Median age
Average estimated value of detached houses in 2021 (66.7% of all units):
Most popular occupations of males: service occupations (27.9%); management occupations (except farmers) (15.6%); sales and office occupations (15.0%); production occupations (12.3%); material moving occupations (7.3%); construction, extraction, and maintenance occupations (6.5%); healthcare practitioners and technical occupations (3.8%)
Most popular occupations of females: service occupations (44.1%); sales and office occupations (14.6%); transportation occupations (14.6%); legal occupations (11.6%); business and financial operations occupations (6.5%); healthcare practitioners and technical occupations (5.0%); education, training, and library occupations (3.5%)
Roads and streets: NE 137th Ct; NE 22nd St.
Andrews Court neighborhood detailed profile
Area: 0.008 square miles
Population: 29
Population density:
| Andrews Court: | 3,840 people per square mile |
| Vancouver: | 4,491 people per square mile |
Median household income in 2021:
| Andrews Court: | $83,750 |
| Vancouver: | $69,993 |
Median rent in in 2021:
| Andrews Court: | $1,408 |
| Vancouver: | $1,311 |
Male vs Females
| Males: | 16 |
| Females: | 12 |
Median age
| Males: | 25.4 years |
| Females: | 30.3 years |
Average estimated value of detached houses in 2021 (66.7% of all units):
| Andrews Court: | $362,336 |
| Vancouver: | $457,784 |
Most popular occupations of males: service occupations (27.9%); management occupations (except farmers) (15.6%); sales and office occupations (15.0%); production occupations (12.3%); material moving occupations (7.3%); construction, extraction, and maintenance occupations (6.5%); healthcare practitioners and technical occupations (3.8%)
Most popular occupations of females: service occupations (44.1%); sales and office occupations (14.6%); transportation occupations (14.6%); legal occupations (11.6%); business and financial operations occupations (6.5%); healthcare practitioners and technical occupations (5.0%); education, training, and library occupations (3.5%)
Roads and streets: NE 137th Ct; NE 22nd St.
Andrews Court neighborhood detailed profile
Andys Acres neighborhood in Vancouver statistics: (Find on map)
Area: 0.005 square miles
Population: 21
Population density:
Median household income in 2021:
Median rent in in 2021:
Male vs Females
Median age
Average estimated value of detached houses in 2021 (100.0% of all units):
Most popular occupations of males: management occupations (except farmers) (24.4%); transportation occupations (18.2%); construction, extraction, and maintenance occupations (12.6%); service occupations (9.2%); sales and office occupations (8.3%); architecture and engineering occupations (6.6%); healthcare practitioners and technical occupations (5.8%)
Most popular occupations of females: computer and mathematical occupations (25.9%); education, training, and library occupations (20.4%); healthcare practitioners and technical occupations (17.4%); sales and office occupations (11.5%); service occupations (9.5%); business and financial operations occupations (4.0%); production occupations (3.4%)
Andys Acres neighborhood detailed profile
Area: 0.005 square miles
Population: 21
Population density:
| Andys Acres: | 4,146 people per square mile |
| Vancouver: | 4,491 people per square mile |
Median household income in 2021:
| Andys Acres: | $155,018 |
| Vancouver: | $69,993 |
Median rent in in 2021:
| Andys Acres: | $1,229 |
| Vancouver: | $1,311 |
Male vs Females
| Males: | 10 |
| Females: | 11 |
Median age
| Males: | 46.8 years |
| Females: | 47.4 years |
Average estimated value of detached houses in 2021 (100.0% of all units):
| Andys Acres: | $461,646 |
| Vancouver: | $457,784 |
Most popular occupations of males: management occupations (except farmers) (24.4%); transportation occupations (18.2%); construction, extraction, and maintenance occupations (12.6%); service occupations (9.2%); sales and office occupations (8.3%); architecture and engineering occupations (6.6%); healthcare practitioners and technical occupations (5.8%)
Most popular occupations of females: computer and mathematical occupations (25.9%); education, training, and library occupations (20.4%); healthcare practitioners and technical occupations (17.4%); sales and office occupations (11.5%); service occupations (9.5%); business and financial operations occupations (4.0%); production occupations (3.4%)
Andys Acres neighborhood detailed profile
Ann Manor neighborhood in Vancouver statistics: (Find on map)
Area: 0.001 square miles
Ann Manor neighborhood detailed profile
Area: 0.001 square miles
Ann Manor neighborhood detailed profile
Annies Acres neighborhood in Vancouver statistics: (Find on map)
Area: 0.003 square miles
Annies Acres neighborhood detailed profile
Area: 0.003 square miles
Annies Acres neighborhood detailed profile
Apple Meadows neighborhood in Vancouver statistics: (Find on map)
Area: 0.002 square miles
Population: 7
Population density:
Median household income in 2021:
Median rent in in 2021:
Male vs Females
Median age
Most popular occupations of males: sales and office occupations (22.6%); transportation occupations (19.1%); production occupations (16.6%); management occupations (except farmers) (10.3%); service occupations (9.0%); material moving occupations (7.8%); construction, extraction, and maintenance occupations (4.8%)
Most popular occupations of females: sales and office occupations (39.6%); service occupations (23.7%); business and financial operations occupations (21.9%); construction, extraction, and maintenance occupations (7.1%); arts, design, entertainment, sports, and media occupations (6.8%); transportation occupations (2.8%); life, physical, and social science occupations (2.3%)
Roads and streets: NE 132nd Ct.
Apple Meadows neighborhood detailed profile
Area: 0.002 square miles
Population: 7
Population density:
| Apple Meadows: | 4,105 people per square mile |
| Vancouver: | 4,491 people per square mile |
Median household income in 2021:
| Apple Meadows: | $50,179 |
| Vancouver: | $69,993 |
Median rent in in 2021:
| Apple Meadows: | $1,237 |
| Vancouver: | $1,311 |
Male vs Females
| Males: | 4 |
| Females: | 3 |
Median age
| Males: | 26.9 years |
| Females: | 34.8 years |
Most popular occupations of males: sales and office occupations (22.6%); transportation occupations (19.1%); production occupations (16.6%); management occupations (except farmers) (10.3%); service occupations (9.0%); material moving occupations (7.8%); construction, extraction, and maintenance occupations (4.8%)
Most popular occupations of females: sales and office occupations (39.6%); service occupations (23.7%); business and financial operations occupations (21.9%); construction, extraction, and maintenance occupations (7.1%); arts, design, entertainment, sports, and media occupations (6.8%); transportation occupations (2.8%); life, physical, and social science occupations (2.3%)
Roads and streets: NE 132nd Ct.
Apple Meadows neighborhood detailed profile
Arcadia Cedars neighborhood in Vancouver statistics: (Find on map)
Area: 0.008 square miles
Arcadia Cedars neighborhood detailed profile
Area: 0.008 square miles
Arcadia Cedars neighborhood detailed profile
Arden neighborhood in Vancouver statistics: (Find on map)
Population: 4
Population density:
Median household income in 2021:
Median rent in in 2021:
Male vs Females
Median age
Average estimated value of detached houses in 2021 (100.0% of all units):
Most popular occupations of males: service occupations (29.3%); management occupations (except farmers) (21.8%); sales and office occupations (17.2%); transportation occupations (5.1%); material moving occupations (4.8%); healthcare practitioners and technical occupations (4.4%); production occupations (4.1%)
Most popular occupations of females: healthcare practitioners and technical occupations (34.9%); sales and office occupations (26.0%); service occupations (17.1%); legal occupations (6.8%); education, training, and library occupations (6.0%); computer and mathematical occupations (4.0%); life, physical, and social science occupations (2.8%)
Arden neighborhood detailed profile
Population: 4
Population density:
| Arden: | 5,204 people per square mile |
| Vancouver: | 4,491 people per square mile |
Median household income in 2021:
| Arden: | $122,949 |
| Vancouver: | $69,993 |
Median rent in in 2021:
| Arden: | $1,693 |
| Vancouver: | $1,311 |
Male vs Females
| Males: | 1 |
| Females: | 2 |
Median age
| Males: | 34.5 years |
| Females: | 29.0 years |
Average estimated value of detached houses in 2021 (100.0% of all units):
| Arden: | $379,477 |
| Vancouver: | $457,784 |
Most popular occupations of males: service occupations (29.3%); management occupations (except farmers) (21.8%); sales and office occupations (17.2%); transportation occupations (5.1%); material moving occupations (4.8%); healthcare practitioners and technical occupations (4.4%); production occupations (4.1%)
Most popular occupations of females: healthcare practitioners and technical occupations (34.9%); sales and office occupations (26.0%); service occupations (17.1%); legal occupations (6.8%); education, training, and library occupations (6.0%); computer and mathematical occupations (4.0%); life, physical, and social science occupations (2.8%)
Arden neighborhood detailed profile
Arnada neighborhood in Vancouver statistics: (Find on map)
Area: 0.226 square miles
Population: 1,248
Population density:
Median household income in 2021:
Median rent in in 2021:
Male vs Females
Median age
Most popular occupations of males: management occupations (except farmers) (19.4%); sales and office occupations (18.5%); business and financial operations occupations (12.5%); computer and mathematical occupations (8.0%); transportation occupations (7.6%); arts, design, entertainment, sports, and media occupations (6.6%); legal occupations (5.0%)
Most popular occupations of females: management occupations (except farmers) (24.9%); sales and office occupations (21.9%); service occupations (14.2%); life, physical, and social science occupations (10.5%); healthcare practitioners and technical occupations (7.5%); business and financial operations occupations (6.7%); architecture and engineering occupations (5.3%)
Highways in this neighborhood: State Rte 501 (E Fourth Plain Blvd).
Roads and streets: I-5; E McLoughlin Blvd; E 22nd St; E 20th St; E 19th St; Broadway St; C St; D St; E St; E 24th St; E 15th St; E 17th St; F St; E 16th St; G St; E 25th St; H St; W Reserve St; Reserve St; Ball Park (F St); I St.
Arnada neighborhood detailed profile
Area: 0.226 square miles
Population: 1,248
Population density:
| Arnada: | 5,513 people per square mile |
| Vancouver: | 4,491 people per square mile |
Median household income in 2021:
| Arnada: | $64,629 |
| Vancouver: | $69,993 |
Median rent in in 2021:
| Arnada: | $1,272 |
| Vancouver: | $1,311 |
Male vs Females
| Males: | 628 |
| Females: | 620 |
Median age
| Males: | 34.0 years |
| Females: | 37.6 years |
Most popular occupations of males: management occupations (except farmers) (19.4%); sales and office occupations (18.5%); business and financial operations occupations (12.5%); computer and mathematical occupations (8.0%); transportation occupations (7.6%); arts, design, entertainment, sports, and media occupations (6.6%); legal occupations (5.0%)
Most popular occupations of females: management occupations (except farmers) (24.9%); sales and office occupations (21.9%); service occupations (14.2%); life, physical, and social science occupations (10.5%); healthcare practitioners and technical occupations (7.5%); business and financial operations occupations (6.7%); architecture and engineering occupations (5.3%)
Highways in this neighborhood: State Rte 501 (E Fourth Plain Blvd).
Roads and streets: I-5; E McLoughlin Blvd; E 22nd St; E 20th St; E 19th St; Broadway St; C St; D St; E St; E 24th St; E 15th St; E 17th St; F St; E 16th St; G St; E 25th St; H St; W Reserve St; Reserve St; Ball Park (F St); I St.
Arnada neighborhood detailed profile
Arnada Park neighborhood in Vancouver statistics: (Find on map)
Area: 0.079 square miles
Population: 436
Population density:
Median household income in 2021:
Median rent in in 2021:
Male vs Females
Median age
Most popular occupations of males: sales and office occupations (20.1%); management occupations (except farmers) (16.7%); business and financial operations occupations (14.9%); computer and mathematical occupations (8.6%); transportation occupations (8.6%); arts, design, entertainment, sports, and media occupations (6.9%); legal occupations (6.3%)
Most popular occupations of females: management occupations (except farmers) (25.9%); sales and office occupations (24.3%); service occupations (14.0%); life, physical, and social science occupations (11.4%); healthcare practitioners and technical occupations (6.7%); business and financial operations occupations (6.2%); architecture and engineering occupations (5.7%)
Roads and streets: E 20th St; E 24th St; E 22nd St; E 25th St; D St; E St; F St; Broadway St; C St; Ball Park (F St).
Arnada Park neighborhood detailed profile
Area: 0.079 square miles
Population: 436
Population density:
| Arnada Park: | 5,517 people per square mile |
| Vancouver: | 4,491 people per square mile |
Median household income in 2021:
| Arnada Park: | $81,746 |
| Vancouver: | $69,993 |
Median rent in in 2021:
| Arnada Park: | $1,278 |
| Vancouver: | $1,311 |
Male vs Females
| Males: | 219 |
| Females: | 217 |
Median age
| Males: | 36.9 years |
| Females: | 33.5 years |
Most popular occupations of males: sales and office occupations (20.1%); management occupations (except farmers) (16.7%); business and financial operations occupations (14.9%); computer and mathematical occupations (8.6%); transportation occupations (8.6%); arts, design, entertainment, sports, and media occupations (6.9%); legal occupations (6.3%)
Most popular occupations of females: management occupations (except farmers) (25.9%); sales and office occupations (24.3%); service occupations (14.0%); life, physical, and social science occupations (11.4%); healthcare practitioners and technical occupations (6.7%); business and financial operations occupations (6.2%); architecture and engineering occupations (5.7%)
Roads and streets: E 20th St; E 24th St; E 22nd St; E 25th St; D St; E St; F St; Broadway St; C St; Ball Park (F St).
Arnada Park neighborhood detailed profile
Arnada Park Annex neighborhood in Vancouver statistics: (Find on map)
Area: 0.039 square miles
Population: 200
Population density:
Median household income in 2021:
Median rent in in 2021:
Male vs Females
Median age
Average estimated value of detached houses in 2021 (57.6% of all units):
Most popular occupations of males: sales and office occupations (21.1%); management occupations (except farmers) (15.9%); business and financial operations occupations (11.8%); transportation occupations (7.4%); service occupations (6.9%); arts, design, entertainment, sports, and media occupations (6.5%); computer and mathematical occupations (6.3%)
Most popular occupations of females: management occupations (except farmers) (23.8%); sales and office occupations (22.6%); service occupations (13.7%); life, physical, and social science occupations (8.6%); business and financial operations occupations (7.3%); healthcare practitioners and technical occupations (6.6%); architecture and engineering occupations (4.3%)
Limited-access highways (interstate or state) in this neighborhood: I- 5.
Highways in this neighborhood: E Fourth Plain Blvd (State Rte 501).
Roads and streets: I-5; E 22nd St; G St; H St; Ball Park (E 24th St); I St; E 26th St.
Arnada Park Annex neighborhood detailed profile
Area: 0.039 square miles
Population: 200
Population density:
| Arnada Park Annex: | 5,162 people per square mile |
| Vancouver: | 4,491 people per square mile |
Median household income in 2021:
| Arnada Park Annex: | $84,251 |
| Vancouver: | $69,993 |
Median rent in in 2021:
| Arnada Park Annex: | $1,294 |
| Vancouver: | $1,311 |
Male vs Females
| Males: | 103 |
| Females: | 96 |
Median age
| Males: | 44.0 years |
| Females: | 40.5 years |
Average estimated value of detached houses in 2021 (57.6% of all units):
| Arnada Park Annex: | $317,213 |
| Vancouver: | $457,784 |
Most popular occupations of males: sales and office occupations (21.1%); management occupations (except farmers) (15.9%); business and financial operations occupations (11.8%); transportation occupations (7.4%); service occupations (6.9%); arts, design, entertainment, sports, and media occupations (6.5%); computer and mathematical occupations (6.3%)
Most popular occupations of females: management occupations (except farmers) (23.8%); sales and office occupations (22.6%); service occupations (13.7%); life, physical, and social science occupations (8.6%); business and financial operations occupations (7.3%); healthcare practitioners and technical occupations (6.6%); architecture and engineering occupations (4.3%)
Limited-access highways (interstate or state) in this neighborhood: I- 5.
Highways in this neighborhood: E Fourth Plain Blvd (State Rte 501).
Roads and streets: I-5; E 22nd St; G St; H St; Ball Park (E 24th St); I St; E 26th St.
Arnada Park Annex neighborhood detailed profile
Ash neighborhood in Vancouver statistics: (Find on map)
Area: 0.004 square miles
Roads and streets: NE 85th Ave.
Ash neighborhood detailed profile
Area: 0.004 square miles
Roads and streets: NE 85th Ave.
Ash neighborhood detailed profile
Ash Hollow neighborhood in Vancouver statistics: (Find on map)
Area: 0.019 square miles
Roads and streets: NW 146th St; NW 148th St; NW 13th Ave; NW 15th Ave.
Ash Hollow neighborhood detailed profile
Area: 0.019 square miles
Roads and streets: NW 146th St; NW 148th St; NW 13th Ave; NW 15th Ave.
Ash Hollow neighborhood detailed profile
Ashford Lane neighborhood in Vancouver statistics: (Find on map)
Area: 0.002 square miles
Ashford Lane neighborhood detailed profile
Area: 0.002 square miles
Ashford Lane neighborhood detailed profile
Ashley Cedars neighborhood in Vancouver statistics: (Find on map)
Ashley Cedars neighborhood detailed profile
Ashley Cedars neighborhood detailed profile
Ashley Heights neighborhood in Vancouver statistics: (Find on map)
Area: 0.186 square miles
Population: 252
Population density:
Median household income in 2021:
Median rent in in 2021:
Male vs Females
Median age
Most popular occupations of males: sales and office occupations (34.0%); management occupations (except farmers) (29.6%); service occupations (18.8%); business and financial operations occupations (18.6%); construction, extraction, and maintenance occupations (15.4%); computer and mathematical occupations (14.9%); healthcare practitioners and technical occupations (10.0%)
Most popular occupations of females: sales and office occupations (18.5%); healthcare practitioners and technical occupations (17.5%); community and social services occupations (16.4%); management occupations (except farmers) (13.3%); education, training, and library occupations (12.9%); business and financial operations occupations (11.4%); material moving occupations (3.8%)
Roads and streets: NW Ashley Heights Dr; NW 141st St; NW 52nd Ave; NW 140th St; NW 139th Loop; NW 137th St; NW 47th Ave; NW 44th Ct; NW 138th St; NW 50th Ave; NW 49th Ave; NW 145th St; NW 51st Ct; NW 53rd Ave; NW 52nd Ct; NW 143rd St; NW 135th St; NW McCann Rd; NW 46th Ct; NW 139th St; NW 45th Ct; NW 135th Cir; NW 51st Ave; NW 140th Way; NW 48th Ave.
Ashley Heights neighborhood detailed profile
Area: 0.186 square miles
Population: 252
Population density:
| Ashley Heights: | 1,354 people per square mile |
| Vancouver: | 4,491 people per square mile |
Median household income in 2021:
| Ashley Heights: | $116,941 |
| Vancouver: | $69,993 |
Median rent in in 2021:
| Ashley Heights: | $1,798 |
| Vancouver: | $1,311 |
Male vs Females
| Males: | 129 |
| Females: | 122 |
Median age
| Males: | 44.4 years |
| Females: | 42.1 years |
Most popular occupations of males: sales and office occupations (34.0%); management occupations (except farmers) (29.6%); service occupations (18.8%); business and financial operations occupations (18.6%); construction, extraction, and maintenance occupations (15.4%); computer and mathematical occupations (14.9%); healthcare practitioners and technical occupations (10.0%)
Most popular occupations of females: sales and office occupations (18.5%); healthcare practitioners and technical occupations (17.5%); community and social services occupations (16.4%); management occupations (except farmers) (13.3%); education, training, and library occupations (12.9%); business and financial operations occupations (11.4%); material moving occupations (3.8%)
Roads and streets: NW Ashley Heights Dr; NW 141st St; NW 52nd Ave; NW 140th St; NW 139th Loop; NW 137th St; NW 47th Ave; NW 44th Ct; NW 138th St; NW 50th Ave; NW 49th Ave; NW 145th St; NW 51st Ct; NW 53rd Ave; NW 52nd Ct; NW 143rd St; NW 135th St; NW McCann Rd; NW 46th Ct; NW 139th St; NW 45th Ct; NW 135th Cir; NW 51st Ave; NW 140th Way; NW 48th Ave.
Ashley Heights neighborhood detailed profile
Ashley Manor neighborhood in Vancouver statistics: (Find on map)
Area: 0.004 square miles
Population: 5
Population density:
Median household income in 2021:
Median rent in in 2021:
Male vs Females
Median age
Most popular occupations of males: sales and office occupations (34.0%); management occupations (except farmers) (29.6%); service occupations (19.4%); business and financial operations occupations (19.2%); computer and mathematical occupations (15.4%); construction, extraction, and maintenance occupations (15.4%); healthcare practitioners and technical occupations (10.0%)
Most popular occupations of females: sales and office occupations (18.5%); healthcare practitioners and technical occupations (17.5%); community and social services occupations (16.4%); management occupations (except farmers) (13.3%); education, training, and library occupations (12.9%); business and financial operations occupations (11.4%); material moving occupations (3.9%)
Ashley Manor neighborhood detailed profile
Area: 0.004 square miles
Population: 5
Population density:
| Ashley Manor: | 1,266 people per square mile |
| Vancouver: | 4,491 people per square mile |
Median household income in 2021:
| Ashley Manor: | $116,941 |
| Vancouver: | $69,993 |
Median rent in in 2021:
| Ashley Manor: | $1,798 |
| Vancouver: | $1,311 |
Male vs Females
| Males: | 2 |
| Females: | 2 |
Median age
| Males: | 44.4 years |
| Females: | 42.1 years |
Most popular occupations of males: sales and office occupations (34.0%); management occupations (except farmers) (29.6%); service occupations (19.4%); business and financial operations occupations (19.2%); computer and mathematical occupations (15.4%); construction, extraction, and maintenance occupations (15.4%); healthcare practitioners and technical occupations (10.0%)
Most popular occupations of females: sales and office occupations (18.5%); healthcare practitioners and technical occupations (17.5%); community and social services occupations (16.4%); management occupations (except farmers) (13.3%); education, training, and library occupations (12.9%); business and financial operations occupations (11.4%); material moving occupations (3.9%)
Ashley Manor neighborhood detailed profile
Ashley Meadows neighborhood in Vancouver statistics: (Find on map)
Area: 0.008 square miles
Population: 10
Population density:
Median household income in 2021:
Median rent in in 2021:
Male vs Females
Median age
Most popular occupations of males: sales and office occupations (34.0%); management occupations (except farmers) (29.6%); service occupations (18.7%); business and financial operations occupations (18.4%); construction, extraction, and maintenance occupations (15.4%); computer and mathematical occupations (14.8%); healthcare practitioners and technical occupations (10.0%)
Most popular occupations of females: sales and office occupations (18.5%); healthcare practitioners and technical occupations (17.5%); community and social services occupations (16.4%); management occupations (except farmers) (13.3%); education, training, and library occupations (12.9%); business and financial operations occupations (11.4%); material moving occupations (3.8%)
Ashley Meadows neighborhood detailed profile
Area: 0.008 square miles
Population: 10
Population density:
| Ashley Meadows: | 1,301 people per square mile |
| Vancouver: | 4,491 people per square mile |
Median household income in 2021:
| Ashley Meadows: | $116,941 |
| Vancouver: | $69,993 |
Median rent in in 2021:
| Ashley Meadows: | $1,798 |
| Vancouver: | $1,311 |
Male vs Females
| Males: | 5 |
| Females: | 5 |
Median age
| Males: | 44.4 years |
| Females: | 42.1 years |
Most popular occupations of males: sales and office occupations (34.0%); management occupations (except farmers) (29.6%); service occupations (18.7%); business and financial operations occupations (18.4%); construction, extraction, and maintenance occupations (15.4%); computer and mathematical occupations (14.8%); healthcare practitioners and technical occupations (10.0%)
Most popular occupations of females: sales and office occupations (18.5%); healthcare practitioners and technical occupations (17.5%); community and social services occupations (16.4%); management occupations (except farmers) (13.3%); education, training, and library occupations (12.9%); business and financial operations occupations (11.4%); material moving occupations (3.8%)
Ashley Meadows neighborhood detailed profile
Ashton Acres neighborhood in Vancouver statistics: (Find on map)
Area: 0.008 square miles
Population: 61
Population density:
Median household income in 2021:
Median rent in in 2021:
Male vs Females
Median age
Most popular occupations of males: construction, extraction, and maintenance occupations (18.0%); service occupations (14.5%); production occupations (13.4%); transportation occupations (13.1%); sales and office occupations (10.3%); management occupations (except farmers) (9.6%); material moving occupations (8.4%)
Most popular occupations of females: sales and office occupations (39.9%); service occupations (32.7%); business and financial operations occupations (10.2%); transportation occupations (4.9%); life, physical, and social science occupations (4.0%); material moving occupations (4.0%); construction, extraction, and maintenance occupations (3.0%)
Ashton Acres neighborhood detailed profile
Area: 0.008 square miles
Population: 61
Population density:
| Ashton Acres: | 7,292 people per square mile |
| Vancouver: | 4,491 people per square mile |
Median household income in 2021:
| Ashton Acres: | $62,988 |
| Vancouver: | $69,993 |
Median rent in in 2021:
| Ashton Acres: | $1,148 |
| Vancouver: | $1,311 |
Male vs Females
| Males: | 28 |
| Females: | 32 |
Median age
| Males: | 41.1 years |
| Females: | 30.4 years |
Most popular occupations of males: construction, extraction, and maintenance occupations (18.0%); service occupations (14.5%); production occupations (13.4%); transportation occupations (13.1%); sales and office occupations (10.3%); management occupations (except farmers) (9.6%); material moving occupations (8.4%)
Most popular occupations of females: sales and office occupations (39.9%); service occupations (32.7%); business and financial operations occupations (10.2%); transportation occupations (4.9%); life, physical, and social science occupations (4.0%); material moving occupations (4.0%); construction, extraction, and maintenance occupations (3.0%)
Ashton Acres neighborhood detailed profile
Autumn Chase neighborhood in Vancouver statistics: (Find on map)
Area: 0.006 square miles
Autumn Chase neighborhood detailed profile
Area: 0.006 square miles
Autumn Chase neighborhood detailed profile
Autumn Ridge neighborhood in Vancouver statistics: (Find on map)
Area: 0.014 square miles
Roads and streets: NE 5th Ave; NE 5th Ct.
Autumn Ridge neighborhood detailed profile
Area: 0.014 square miles
Roads and streets: NE 5th Ave; NE 5th Ct.
Autumn Ridge neighborhood detailed profile
Autumn Trace neighborhood in Vancouver statistics: (Find on map)
Area: 0.017 square miles
Population: 6
Population density:
Median household income in 2021:
Male vs Females
Median age
Housing prices:
Average estimated value of detached houses in 2021 (66.7% of all units):
Most popular occupations of males: sales and office occupations (43.9%); management occupations (except farmers) (14.0%); service occupations (7.5%); construction, extraction, and maintenance occupations (7.5%); production occupations (6.6%); architecture and engineering occupations (4.6%); computer and mathematical occupations (3.2%)
Most popular occupations of females: sales and office occupations (18.7%); healthcare practitioners and technical occupations (17.8%); management occupations (except farmers) (13.8%); business and financial operations occupations (12.9%); service occupations (11.1%); education, training, and library occupations (10.2%); material moving occupations (8.9%)
Roads and streets: NW 146th St; NW 148th St; NW 23rd Ave; NW 22nd Ave; NW 24th Ave.
Autumn Trace neighborhood detailed profile
Area: 0.017 square miles
Population: 6
Population density:
| Autumn Trace: | 351 people per square mile |
| Vancouver: | 4,491 people per square mile |
Median household income in 2021:
| Autumn Trace: | $78,958 |
| Vancouver: | $69,993 |
Male vs Females
| Males: | 3 |
| Females: | 2 |
Median age
| Males: | 38.1 years |
| Females: | 52.4 years |
Housing prices:
Average estimated value of detached houses in 2021 (66.7% of all units):
| Autumn Trace: | $645,828 |
| Vancouver: | $457,784 |
Most popular occupations of males: sales and office occupations (43.9%); management occupations (except farmers) (14.0%); service occupations (7.5%); construction, extraction, and maintenance occupations (7.5%); production occupations (6.6%); architecture and engineering occupations (4.6%); computer and mathematical occupations (3.2%)
Most popular occupations of females: sales and office occupations (18.7%); healthcare practitioners and technical occupations (17.8%); management occupations (except farmers) (13.8%); business and financial operations occupations (12.9%); service occupations (11.1%); education, training, and library occupations (10.2%); material moving occupations (8.9%)
Roads and streets: NW 146th St; NW 148th St; NW 23rd Ave; NW 22nd Ave; NW 24th Ave.
Autumn Trace neighborhood detailed profile
Autumn Walk neighborhood in Vancouver statistics: (Find on map)
Area: 0.014 square miles
Population: 8
Population density:
Median household income in 2021:
Median rent in in 2021:
Male vs Females
Median age
Most popular occupations of males: sales and office occupations (17.3%); service occupations (12.7%); management occupations (except farmers) (12.1%); education, training, and library occupations (9.5%); production occupations (9.0%); material moving occupations (8.0%); construction, extraction, and maintenance occupations (7.6%)
Most popular occupations of females: sales and office occupations (38.6%); service occupations (17.7%); management occupations (except farmers) (12.0%); healthcare practitioners and technical occupations (7.3%); transportation occupations (7.0%); education, training, and library occupations (6.0%); legal occupations (4.3%)
Roads and streets: NE 69th St; NE 68th Way; NE 152nd Ave; NE 151st Ave; NE 150th Pl.
Autumn Walk neighborhood detailed profile
Area: 0.014 square miles
Population: 8
Population density:
| Autumn Walk: | 573 people per square mile |
| Vancouver: | 4,491 people per square mile |
Median household income in 2021:
| Autumn Walk: | $95,230 |
| Vancouver: | $69,993 |
Median rent in in 2021:
| Autumn Walk: | $1,750 |
| Vancouver: | $1,311 |
Male vs Females
| Males: | 4 |
| Females: | 4 |
Median age
| Males: | 29.1 years |
| Females: | 32.9 years |
Most popular occupations of males: sales and office occupations (17.3%); service occupations (12.7%); management occupations (except farmers) (12.1%); education, training, and library occupations (9.5%); production occupations (9.0%); material moving occupations (8.0%); construction, extraction, and maintenance occupations (7.6%)
Most popular occupations of females: sales and office occupations (38.6%); service occupations (17.7%); management occupations (except farmers) (12.0%); healthcare practitioners and technical occupations (7.3%); transportation occupations (7.0%); education, training, and library occupations (6.0%); legal occupations (4.3%)
Roads and streets: NE 69th St; NE 68th Way; NE 152nd Ave; NE 151st Ave; NE 150th Pl.
Autumn Walk neighborhood detailed profile
Avalon neighborhood in Vancouver statistics: (Find on map)
Area: 0.003 square miles
Avalon neighborhood detailed profile
Area: 0.003 square miles
Avalon neighborhood detailed profile
Avalon Court neighborhood in Vancouver statistics: (Find on map)
Area: 0.015 square miles
Roads and streets: NE 51st Ave; NE 94th St.
Avalon Court neighborhood detailed profile
Area: 0.015 square miles
Roads and streets: NE 51st Ave; NE 94th St.
Avalon Court neighborhood detailed profile
Avalon Estates neighborhood in Vancouver statistics: (Find on map)
Area: 0.006 square miles
Avalon Estates neighborhood detailed profile
Area: 0.006 square miles
Avalon Estates neighborhood detailed profile
Avalon Heights neighborhood in Vancouver statistics: (Find on map)
Area: 0.005 square miles
Population: 10
Population density:
Median household income in 2021:
Median rent in in 2021:
Male vs Females
Median age
Average estimated value of detached houses in 2021 (100.0% of all units):
Most popular occupations of males: service occupations (15.2%); management occupations (except farmers) (14.6%); sales and office occupations (12.7%); architecture and engineering occupations (8.1%); production occupations (7.4%); education, training, and library occupations (7.0%); construction, extraction, and maintenance occupations (6.5%)
Most popular occupations of females: sales and office occupations (33.8%); business and financial operations occupations (26.1%); service occupations (13.0%); education, training, and library occupations (10.7%); healthcare practitioners and technical occupations (6.4%); arts, design, entertainment, sports, and media occupations (5.0%); community and social services occupations (3.0%)
Avalon Heights neighborhood detailed profile
Area: 0.005 square miles
Population: 10
Population density:
| Avalon Heights: | 2,032 people per square mile |
| Vancouver: | 4,491 people per square mile |
Median household income in 2021:
| Avalon Heights: | $97,031 |
| Vancouver: | $69,993 |
Median rent in in 2021:
| Avalon Heights: | $1,734 |
| Vancouver: | $1,311 |
Male vs Females
| Males: | 5 |
| Females: | 4 |
Median age
| Males: | 38.6 years |
| Females: | 49.9 years |
Average estimated value of detached houses in 2021 (100.0% of all units):
| Avalon Heights: | $421,431 |
| Vancouver: | $457,784 |
Most popular occupations of males: service occupations (15.2%); management occupations (except farmers) (14.6%); sales and office occupations (12.7%); architecture and engineering occupations (8.1%); production occupations (7.4%); education, training, and library occupations (7.0%); construction, extraction, and maintenance occupations (6.5%)
Most popular occupations of females: sales and office occupations (33.8%); business and financial operations occupations (26.1%); service occupations (13.0%); education, training, and library occupations (10.7%); healthcare practitioners and technical occupations (6.4%); arts, design, entertainment, sports, and media occupations (5.0%); community and social services occupations (3.0%)
Avalon Heights neighborhood detailed profile
Avalon Hills neighborhood in Vancouver statistics: (Find on map)
Area: 0.017 square miles
Roads and streets: NE 41st Ave; NE 95th Cir; NE 96th Cir.
Avalon Hills neighborhood detailed profile
Area: 0.017 square miles
Roads and streets: NE 41st Ave; NE 95th Cir; NE 96th Cir.
Avalon Hills neighborhood detailed profile
Avalon Meadows neighborhood in Vancouver statistics: (Find on map)
Area: 0.024 square miles
Roads and streets: NE 143rd St; NE 145th Cir; NE 144th St; NE 35th Ave; NE 30th Ct; NE 31st Ave.
Avalon Meadows neighborhood detailed profile
Area: 0.024 square miles
Roads and streets: NE 143rd St; NE 145th Cir; NE 144th St; NE 35th Ave; NE 30th Ct; NE 31st Ave.
Avalon Meadows neighborhood detailed profile
Avenues neighborhood in Vancouver statistics: (Find on map)
Area: 0.004 square miles
Avenues neighborhood detailed profile
Area: 0.004 square miles
Avenues neighborhood detailed profile
Avery Estates neighborhood in Vancouver statistics: (Find on map)
Area: 0.004 square miles
Avery Estates neighborhood detailed profile
Area: 0.004 square miles
Avery Estates neighborhood detailed profile
Axford Lane neighborhood in Vancouver statistics: (Find on map)
Area: 0.009 square miles
Axford Lane neighborhood detailed profile
Area: 0.009 square miles
Axford Lane neighborhood detailed profile
Axtell Acres neighborhood in Vancouver statistics: (Find on map)
Area: 0.003 square miles
Population: 11
Population density:
Median household income in 2021:
Median rent in in 2021:
Male vs Females
Median age
Housing prices:
Average estimated value of detached houses in 2021 (100.0% of all units):
Most popular occupations of males: material moving occupations (19.3%); construction, extraction, and maintenance occupations (13.3%); service occupations (9.4%); sales and office occupations (6.2%); production occupations (5.3%); arts, design, entertainment, sports, and media occupations (3.9%); transportation occupations (3.7%)
Most popular occupations of females: service occupations (30.8%); management occupations (except farmers) (22.5%); sales and office occupations (20.1%); healthcare practitioners and technical occupations (5.8%); education, training, and library occupations (5.1%); construction, extraction, and maintenance occupations (4.1%); business and financial operations occupations (3.6%)
Roads and streets: NE 109th Ct.
Axtell Acres neighborhood detailed profile
Area: 0.003 square miles
Population: 11
Population density:
| Axtell Acres: | 3,644 people per square mile |
| Vancouver: | 4,491 people per square mile |
Median household income in 2021:
| Axtell Acres: | $107,889 |
| Vancouver: | $69,993 |
Median rent in in 2021:
| Axtell Acres: | $1,711 |
| Vancouver: | $1,311 |
Male vs Females
| Males: | 6 |
| Females: | 4 |
Median age
| Males: | 40.3 years |
| Females: | 48.7 years |
Housing prices:
Average estimated value of detached houses in 2021 (100.0% of all units):
| Axtell Acres: | $280,746 |
| Vancouver: | $457,784 |
Most popular occupations of males: material moving occupations (19.3%); construction, extraction, and maintenance occupations (13.3%); service occupations (9.4%); sales and office occupations (6.2%); production occupations (5.3%); arts, design, entertainment, sports, and media occupations (3.9%); transportation occupations (3.7%)
Most popular occupations of females: service occupations (30.8%); management occupations (except farmers) (22.5%); sales and office occupations (20.1%); healthcare practitioners and technical occupations (5.8%); education, training, and library occupations (5.1%); construction, extraction, and maintenance occupations (4.1%); business and financial operations occupations (3.6%)
Roads and streets: NE 109th Ct.
Axtell Acres neighborhood detailed profile
Bacon Place neighborhood in Vancouver statistics: (Find on map)
Area: 0.028 square miles
Population: 188
Population density:
Median household income in 2021:
Median rent in in 2021:
Male vs Females
Median age
Average estimated value of detached houses in 2021 (86.2% of all units):
Most popular occupations of males: business and financial operations occupations (18.7%); computer and mathematical occupations (17.3%); transportation occupations (14.7%); architecture and engineering occupations (12.0%); life, physical, and social science occupations (7.1%); management occupations (except farmers) (6.9%); service occupations (5.4%)
Most popular occupations of females: healthcare practitioners and technical occupations (24.5%); service occupations (19.9%); business and financial operations occupations (8.7%); production occupations (7.3%); transportation occupations (7.1%); education, training, and library occupations (6.5%); sales and office occupations (6.4%)
Roads and streets: Columbia St; Washington St; W 29th St; W 28th St; W 27th St.
Bacon Place neighborhood detailed profile
Area: 0.028 square miles
Population: 188
Population density:
| Bacon Place: | 6,645 people per square mile |
| Vancouver: | 4,491 people per square mile |
Median household income in 2021:
| Bacon Place: | $90,935 |
| Vancouver: | $69,993 |
Median rent in in 2021:
| Bacon Place: | $1,251 |
| Vancouver: | $1,311 |
Male vs Females
| Males: | 91 |
| Females: | 97 |
Median age
| Males: | 42.2 years |
| Females: | 43.8 years |
Average estimated value of detached houses in 2021 (86.2% of all units):
| Bacon Place: | $525,203 |
| Vancouver: | $457,784 |
Most popular occupations of males: business and financial operations occupations (18.7%); computer and mathematical occupations (17.3%); transportation occupations (14.7%); architecture and engineering occupations (12.0%); life, physical, and social science occupations (7.1%); management occupations (except farmers) (6.9%); service occupations (5.4%)
Most popular occupations of females: healthcare practitioners and technical occupations (24.5%); service occupations (19.9%); business and financial operations occupations (8.7%); production occupations (7.3%); transportation occupations (7.1%); education, training, and library occupations (6.5%); sales and office occupations (6.4%)
Roads and streets: Columbia St; Washington St; W 29th St; W 28th St; W 27th St.
Bacon Place neighborhood detailed profile
Bagley Downs neighborhood in Vancouver statistics: (Find on map)
Area: 0.654 square miles
Population: 2,029
Population density:
Median household income in 2021:
Median rent in in 2021:
Male vs Females
Median age
Housing prices:
Average estimated value of detached houses in 2021 (45.1% of all units):
Average estimated value of townhouses or other attached units in 2021 (5.8% of all units):
Most popular occupations of males: service occupations (28.8%); construction, extraction, and maintenance occupations (17.1%); transportation occupations (11.8%); management occupations (except farmers) (9.8%); production occupations (7.5%); sales and office occupations (6.7%); business and financial operations occupations (6.0%)
Most popular occupations of females: service occupations (41.1%); management occupations (except farmers) (21.2%); sales and office occupations (8.2%); healthcare practitioners and technical occupations (7.0%); transportation occupations (7.0%); education, training, and library occupations (5.0%); production occupations (4.4%)
Limited-access highways (interstate or state) in this neighborhood: State Hwy 500.
Roads and streets: E Fourth Plain Blvd; NE 34th St; Nicholson Rd; Plomondon St; Falk Rd; Gibbons St; NE 57th Ave; NE Stapleton Rd; NE 62nd Ave; General Anderson Rd (General Anderson Ave); Caples Ave; NE 66th Ave; Linda Ln; NE Andresen Rd; NE Nicholson Loop; NE 35th Cir; (State Rte 500); NE 33rd Cir; NE 32nd St; Plomondon St (Plomondon Ln); NE 33rd St; E Spaulding Ave; NE 51st Ct; NE 50th Ct; NE 50th Ave; NE Stapleton Rd (NE 54th Ave).
Bagley Downs neighborhood detailed profile
Area: 0.654 square miles
Population: 2,029
Population density:
| Bagley Downs: | 3,103 people per square mile |
| Vancouver: | 4,491 people per square mile |
Median household income in 2021:
| Bagley Downs: | $77,814 |
| Vancouver: | $69,993 |
Median rent in in 2021:
| Bagley Downs: | $1,184 |
| Vancouver: | $1,311 |
Male vs Females
| Males: | 984 |
| Females: | 1,044 |
Median age
| Males: | 29.8 years |
| Females: | 30.6 years |
Housing prices:
Average estimated value of detached houses in 2021 (45.1% of all units):
| Bagley Downs: | $329,608 |
| Vancouver: | $457,784 |
Average estimated value of townhouses or other attached units in 2021 (5.8% of all units):
| This neighborhood: | $66,667 |
| city: | $310,311 |
Most popular occupations of males: service occupations (28.8%); construction, extraction, and maintenance occupations (17.1%); transportation occupations (11.8%); management occupations (except farmers) (9.8%); production occupations (7.5%); sales and office occupations (6.7%); business and financial operations occupations (6.0%)
Most popular occupations of females: service occupations (41.1%); management occupations (except farmers) (21.2%); sales and office occupations (8.2%); healthcare practitioners and technical occupations (7.0%); transportation occupations (7.0%); education, training, and library occupations (5.0%); production occupations (4.4%)
Limited-access highways (interstate or state) in this neighborhood: State Hwy 500.
Roads and streets: E Fourth Plain Blvd; NE 34th St; Nicholson Rd; Plomondon St; Falk Rd; Gibbons St; NE 57th Ave; NE Stapleton Rd; NE 62nd Ave; General Anderson Rd (General Anderson Ave); Caples Ave; NE 66th Ave; Linda Ln; NE Andresen Rd; NE Nicholson Loop; NE 35th Cir; (State Rte 500); NE 33rd Cir; NE 32nd St; Plomondon St (Plomondon Ln); NE 33rd St; E Spaulding Ave; NE 51st Ct; NE 50th Ct; NE 50th Ave; NE Stapleton Rd (NE 54th Ave).
Bagley Downs neighborhood detailed profile
Bagley Downs Estates neighborhood in Vancouver statistics: (Find on map)
Area: 0.003 square miles
Population: 5
Population density:
Median household income in 2021:
Median rent in in 2021:
Male vs Females
Median age
Most popular occupations of males: service occupations (31.8%); construction, extraction, and maintenance occupations (19.6%); management occupations (except farmers) (8.0%); transportation occupations (8.0%); sales and office occupations (7.6%); business and financial operations occupations (6.9%); production occupations (6.5%)
Most popular occupations of females: service occupations (44.0%); management occupations (except farmers) (17.6%); healthcare practitioners and technical occupations (8.5%); transportation occupations (8.5%); sales and office occupations (8.2%); production occupations (5.2%); education, training, and library occupations (3.0%)
Bagley Downs Estates neighborhood detailed profile
Area: 0.003 square miles
Population: 5
Population density:
| Bagley Downs Estates: | 1,883 people per square mile |
| Vancouver: | 4,491 people per square mile |
Median household income in 2021:
| Bagley Downs Estates: | $75,485 |
| Vancouver: | $69,993 |
Median rent in in 2021:
| Bagley Downs Estates: | $1,092 |
| Vancouver: | $1,311 |
Male vs Females
| Males: | 2 |
| Females: | 2 |
Median age
| Males: | 46.1 years |
| Females: | 42.1 years |
Most popular occupations of males: service occupations (31.8%); construction, extraction, and maintenance occupations (19.6%); management occupations (except farmers) (8.0%); transportation occupations (8.0%); sales and office occupations (7.6%); business and financial operations occupations (6.9%); production occupations (6.5%)
Most popular occupations of females: service occupations (44.0%); management occupations (except farmers) (17.6%); healthcare practitioners and technical occupations (8.5%); transportation occupations (8.5%); sales and office occupations (8.2%); production occupations (5.2%); education, training, and library occupations (3.0%)
Bagley Downs Estates neighborhood detailed profile
Bagley Park neighborhood in Vancouver statistics: (Find on map)
Area: 0.012 square miles
Population: 38
Population density:
Median household income in 2021:
Median rent in in 2021:
Male vs Females
Median age
Most popular occupations of males: service occupations (31.8%); construction, extraction, and maintenance occupations (19.6%); management occupations (except farmers) (8.0%); transportation occupations (8.0%); sales and office occupations (7.6%); business and financial operations occupations (6.9%); production occupations (6.5%)
Most popular occupations of females: service occupations (44.0%); management occupations (except farmers) (17.6%); healthcare practitioners and technical occupations (8.5%); transportation occupations (8.5%); sales and office occupations (8.2%); production occupations (5.2%); education, training, and library occupations (3.0%)
Bagley Park neighborhood detailed profile
Area: 0.012 square miles
Population: 38
Population density:
| Bagley Park: | 3,194 people per square mile |
| Vancouver: | 4,491 people per square mile |
Median household income in 2021:
| Bagley Park: | $63,333 |
| Vancouver: | $69,993 |
Median rent in in 2021:
| Bagley Park: | $916 |
| Vancouver: | $1,311 |
Male vs Females
| Males: | 18 |
| Females: | 19 |
Median age
| Males: | 38.7 years |
| Females: | 35.3 years |
Most popular occupations of males: service occupations (31.8%); construction, extraction, and maintenance occupations (19.6%); management occupations (except farmers) (8.0%); transportation occupations (8.0%); sales and office occupations (7.6%); business and financial operations occupations (6.9%); production occupations (6.5%)
Most popular occupations of females: service occupations (44.0%); management occupations (except farmers) (17.6%); healthcare practitioners and technical occupations (8.5%); transportation occupations (8.5%); sales and office occupations (8.2%); production occupations (5.2%); education, training, and library occupations (3.0%)
Bagley Park neighborhood detailed profile
Banbury Place neighborhood in Vancouver statistics: (Find on map)
Area: 0.002 square miles
Population: 14
Population density:
Median household income in 2021:
Median rent in in 2021:
Male vs Females
Median age
Most popular occupations of males: construction, extraction, and maintenance occupations (18.0%); service occupations (14.5%); production occupations (13.4%); transportation occupations (13.1%); sales and office occupations (10.3%); management occupations (except farmers) (9.6%); material moving occupations (8.4%)
Most popular occupations of females: sales and office occupations (39.9%); service occupations (32.7%); business and financial operations occupations (10.2%); transportation occupations (4.9%); life, physical, and social science occupations (4.0%); material moving occupations (4.0%); construction, extraction, and maintenance occupations (2.9%)
Banbury Place neighborhood detailed profile
Area: 0.002 square miles
Population: 14
Population density:
| Banbury Place: | 6,604 people per square mile |
| Vancouver: | 4,491 people per square mile |
Median household income in 2021:
| Banbury Place: | $62,988 |
| Vancouver: | $69,993 |
Median rent in in 2021:
| Banbury Place: | $1,148 |
| Vancouver: | $1,311 |
Male vs Females
| Males: | 6 |
| Females: | 7 |
Median age
| Males: | 41.1 years |
| Females: | 30.4 years |
Most popular occupations of males: construction, extraction, and maintenance occupations (18.0%); service occupations (14.5%); production occupations (13.4%); transportation occupations (13.1%); sales and office occupations (10.3%); management occupations (except farmers) (9.6%); material moving occupations (8.4%)
Most popular occupations of females: sales and office occupations (39.9%); service occupations (32.7%); business and financial operations occupations (10.2%); transportation occupations (4.9%); life, physical, and social science occupations (4.0%); material moving occupations (4.0%); construction, extraction, and maintenance occupations (2.9%)
Banbury Place neighborhood detailed profile
Barbeau Estates neighborhood in Vancouver statistics: (Find on map)
Area: 0.025 square miles
Population: 77
Population density:
Median household income in 2021:
Median rent in in 2021:
Male vs Females
Median age
Most popular occupations of males: service occupations (34.2%); production occupations (24.9%); construction, extraction, and maintenance occupations (9.3%); business and financial operations occupations (9.0%); material moving occupations (7.6%); healthcare practitioners and technical occupations (5.0%); sales and office occupations (5.0%)
Most popular occupations of females: service occupations (59.3%); healthcare practitioners and technical occupations (19.7%); sales and office occupations (18.1%); production occupations (16.6%); education, training, and library occupations (8.5%); material moving occupations (8.2%); arts, design, entertainment, sports, and media occupations (7.2%)
Roads and streets: NW 5th Ave; NW 6th Ave; NW 110th Way; NW 113th St; NW 109th Cir.
Barbeau Estates neighborhood detailed profile
Area: 0.025 square miles
Population: 77
Population density:
| Barbeau Estates: | 3,080 people per square mile |
| Vancouver: | 4,491 people per square mile |
Median household income in 2021:
| Barbeau Estates: | $36,628 |
| Vancouver: | $69,993 |
Median rent in in 2021:
| Barbeau Estates: | $1,063 |
| Vancouver: | $1,311 |
Male vs Females
| Males: | 34 |
| Females: | 42 |
Median age
| Males: | 39.6 years |
| Females: | 25.9 years |
Most popular occupations of males: service occupations (34.2%); production occupations (24.9%); construction, extraction, and maintenance occupations (9.3%); business and financial operations occupations (9.0%); material moving occupations (7.6%); healthcare practitioners and technical occupations (5.0%); sales and office occupations (5.0%)
Most popular occupations of females: service occupations (59.3%); healthcare practitioners and technical occupations (19.7%); sales and office occupations (18.1%); production occupations (16.6%); education, training, and library occupations (8.5%); material moving occupations (8.2%); arts, design, entertainment, sports, and media occupations (7.2%)
Roads and streets: NW 5th Ave; NW 6th Ave; NW 110th Way; NW 113th St; NW 109th Cir.
Barbeau Estates neighborhood detailed profile
Barberton Industrial Park neighborhood in Vancouver statistics: (Find on map)
Area: 0.029 square miles
Roads and streets: NE 72nd Ave; NE 100th Cir.
Barberton Industrial Park neighborhood detailed profile
Area: 0.029 square miles
Roads and streets: NE 72nd Ave; NE 100th Cir.
Barberton Industrial Park neighborhood detailed profile
Barg Acres neighborhood in Vancouver statistics: (Find on map)
Area: 0.127 square miles
Population: 173
Population density:
Median household income in 2021:
Median rent in in 2021:
Male vs Females
Median age
Average estimated value of detached houses in 2021 (73.3% of all units):
Most popular occupations of males: production occupations (21.2%); management occupations (except farmers) (17.2%); service occupations (12.5%); sales and office occupations (11.1%); transportation occupations (8.2%); construction, extraction, and maintenance occupations (6.6%); computer and mathematical occupations (2.9%)
Most popular occupations of females: sales and office occupations (50.6%); management occupations (except farmers) (40.7%); service occupations (15.7%); production occupations (11.5%); business and financial operations occupations (9.6%); life, physical, and social science occupations (8.4%); healthcare practitioners and technical occupations (8.4%)
Roads and streets: NE 47th Ave; NE 68th St.
Barg Acres neighborhood detailed profile
Area: 0.127 square miles
Population: 173
Population density:
| Barg Acres: | 1,359 people per square mile |
| Vancouver: | 4,491 people per square mile |
Median household income in 2021:
| Barg Acres: | $102,167 |
| Vancouver: | $69,993 |
Median rent in in 2021:
| Barg Acres: | $1,505 |
| Vancouver: | $1,311 |
Male vs Females
| Males: | 114 |
| Females: | 58 |
Median age
| Males: | 35.7 years |
| Females: | 59.7 years |
Average estimated value of detached houses in 2021 (73.3% of all units):
| Barg Acres: | $309,967 |
| Vancouver: | $457,784 |
Most popular occupations of males: production occupations (21.2%); management occupations (except farmers) (17.2%); service occupations (12.5%); sales and office occupations (11.1%); transportation occupations (8.2%); construction, extraction, and maintenance occupations (6.6%); computer and mathematical occupations (2.9%)
Most popular occupations of females: sales and office occupations (50.6%); management occupations (except farmers) (40.7%); service occupations (15.7%); production occupations (11.5%); business and financial operations occupations (9.6%); life, physical, and social science occupations (8.4%); healthcare practitioners and technical occupations (8.4%)
Roads and streets: NE 47th Ave; NE 68th St.
Barg Acres neighborhood detailed profile
Barnes Addition neighborhood in Vancouver statistics: (Find on map)
Area: 0.006 square miles
Population: 58
Population density:
Median household income in 2021:
Median rent in in 2021:
Male vs Females
Median age
Most popular occupations of males: sales and office occupations (27.7%); material moving occupations (12.2%); construction, extraction, and maintenance occupations (12.0%); production occupations (11.1%); service occupations (9.6%); farming, fishing, and forestry occupations (8.2%); management occupations (except farmers) (4.9%)
Most popular occupations of females: service occupations (32.4%); sales and office occupations (31.9%); management occupations (except farmers) (15.2%); life, physical, and social science occupations (11.9%); arts, design, entertainment, sports, and media occupations (7.1%); production occupations (5.8%); community and social services occupations (5.4%)
Barnes Addition neighborhood detailed profile
Area: 0.006 square miles
Population: 58
Population density:
| Barnes Addition: | 10,341 people per square mile |
| Vancouver: | 4,491 people per square mile |
Median household income in 2021:
| Barnes Addition: | $50,972 |
| Vancouver: | $69,993 |
Median rent in in 2021:
| Barnes Addition: | $982 |
| Vancouver: | $1,311 |
Male vs Females
| Males: | 33 |
| Females: | 24 |
Median age
| Males: | 32.6 years |
| Females: | 29.2 years |
Most popular occupations of males: sales and office occupations (27.7%); material moving occupations (12.2%); construction, extraction, and maintenance occupations (12.0%); production occupations (11.1%); service occupations (9.6%); farming, fishing, and forestry occupations (8.2%); management occupations (except farmers) (4.9%)
Most popular occupations of females: service occupations (32.4%); sales and office occupations (31.9%); management occupations (except farmers) (15.2%); life, physical, and social science occupations (11.9%); arts, design, entertainment, sports, and media occupations (7.1%); production occupations (5.8%); community and social services occupations (5.4%)
Barnes Addition neighborhood detailed profile
Barnes Crossing neighborhood in Vancouver statistics: (Find on map)
Area: 0.016 square miles
Roads and streets: NE 31st Way; NE 171st Ave; NE 170th Ave; NE 168th Ave.
Barnes Crossing neighborhood detailed profile
Area: 0.016 square miles
Roads and streets: NE 31st Way; NE 171st Ave; NE 170th Ave; NE 168th Ave.
Barnes Crossing neighborhood detailed profile
Barringer Ridge Estates neighborhood in Vancouver statistics: (Find on map)
Area: 0.008 square miles
Population: 38
Population density:
Median household income in 2021:
Median rent in in 2021:
Male vs Females
Median age
Most popular occupations of males: sales and office occupations (25.6%); construction, extraction, and maintenance occupations (18.2%); management occupations (except farmers) (16.2%); service occupations (12.8%); transportation occupations (10.1%); material moving occupations (6.8%); production occupations (6.4%)
Most popular occupations of females: service occupations (30.6%); education, training, and library occupations (16.1%); sales and office occupations (15.8%); management occupations (except farmers) (8.3%); healthcare practitioners and technical occupations (7.0%); legal occupations (6.2%); arts, design, entertainment, sports, and media occupations (6.2%)
Roads and streets: NE 103rd Ct.
Barringer Ridge Estates neighborhood detailed profile
Area: 0.008 square miles
Population: 38
Population density:
| Barringer Ridge Estates: | 4,693 people per square mile |
| Vancouver: | 4,491 people per square mile |
Median household income in 2021:
| Barringer Ridge Estates: | $63,665 |
| Vancouver: | $69,993 |
Median rent in in 2021:
| Barringer Ridge Estates: | $1,386 |
| Vancouver: | $1,311 |
Male vs Females
| Males: | 15 |
| Females: | 23 |
Median age
| Males: | 42.8 years |
| Females: | 43.4 years |
Most popular occupations of males: sales and office occupations (25.6%); construction, extraction, and maintenance occupations (18.2%); management occupations (except farmers) (16.2%); service occupations (12.8%); transportation occupations (10.1%); material moving occupations (6.8%); production occupations (6.4%)
Most popular occupations of females: service occupations (30.6%); education, training, and library occupations (16.1%); sales and office occupations (15.8%); management occupations (except farmers) (8.3%); healthcare practitioners and technical occupations (7.0%); legal occupations (6.2%); arts, design, entertainment, sports, and media occupations (6.2%)
Roads and streets: NE 103rd Ct.
Barringer Ridge Estates neighborhood detailed profile
Bay Berry Terrace neighborhood in Vancouver statistics: (Find on map)
Area: 0.008 square miles
Population: 29
Population density:
Median household income in 2021:
Median rent in in 2021:
Male vs Females
Median age
Housing prices:
Average estimated value of detached houses in 2021 (35.7% of all units):
Average estimated value of townhouses or other attached units in 2021 (7.1% of all units):
Average estimated '21 value of housing units in 5-or-more-unit structures (21.4% of all units):
Most popular occupations of males: sales and office occupations (23.2%); material moving occupations (11.6%); education, training, and library occupations (11.4%); service occupations (9.3%); healthcare practitioners and technical occupations (8.8%); management occupations (except farmers) (7.4%); construction, extraction, and maintenance occupations (7.2%)
Most popular occupations of females: sales and office occupations (29.2%); service occupations (21.1%); management occupations (except farmers) (20.7%); production occupations (12.8%); computer and mathematical occupations (6.7%); business and financial operations occupations (6.6%); material moving occupations (6.1%)
Bay Berry Terrace neighborhood detailed profile
Area: 0.008 square miles
Population: 29
Population density:
| Bay Berry Terrace: | 3,621 people per square mile |
| Vancouver: | 4,491 people per square mile |
Median household income in 2021:
| Bay Berry Terrace: | $57,315 |
| Vancouver: | $69,993 |
Median rent in in 2021:
| Bay Berry Terrace: | $1,452 |
| Vancouver: | $1,311 |
Male vs Females
| Males: | 14 |
| Females: | 15 |
Median age
| Males: | 41.5 years |
| Females: | 40.8 years |
Housing prices:
Average estimated value of detached houses in 2021 (35.7% of all units):
| Bay Berry Terrace: | $358,905 |
| Vancouver: | $457,784 |
Average estimated value of townhouses or other attached units in 2021 (7.1% of all units):
| This neighborhood: | $255,918 |
| city: | $310,311 |
Average estimated '21 value of housing units in 5-or-more-unit structures (21.4% of all units):
| Bay Berry Terrace: | $290,545 |
| Vancouver: | $351,621 |
Most popular occupations of males: sales and office occupations (23.2%); material moving occupations (11.6%); education, training, and library occupations (11.4%); service occupations (9.3%); healthcare practitioners and technical occupations (8.8%); management occupations (except farmers) (7.4%); construction, extraction, and maintenance occupations (7.2%)
Most popular occupations of females: sales and office occupations (29.2%); service occupations (21.1%); management occupations (except farmers) (20.7%); production occupations (12.8%); computer and mathematical occupations (6.7%); business and financial operations occupations (6.6%); material moving occupations (6.1%)
Bay Berry Terrace neighborhood detailed profile
Beautiful Downtown Orchards neighborhood in Vancouver statistics: (Find on map)
Area: 0.023 square miles
Population: 60
Population density:
Median household income in 2021:
Median rent in in 2021:
Male vs Females
Median age
Most popular occupations of males: sales and office occupations (32.1%); education, training, and library occupations (11.8%); production occupations (11.6%); service occupations (11.1%); management occupations (except farmers) (9.9%); material moving occupations (7.1%); transportation occupations (4.5%)
Most popular occupations of females: service occupations (41.8%); sales and office occupations (23.3%); production occupations (13.4%); transportation occupations (6.9%); education, training, and library occupations (3.8%); healthcare practitioners and technical occupations (3.4%); business and financial operations occupations (2.5%)
Roads and streets: NE Coxley Dr; NE 109th Ct.
Beautiful Downtown Orchards neighborhood detailed profile
Area: 0.023 square miles
Population: 60
Population density:
| Beautiful Downtown Orchards: | 2,600 people per square mile |
| Vancouver: | 4,491 people per square mile |
Median household income in 2021:
| Beautiful Downtown Orchards: | $54,406 |
| Vancouver: | $69,993 |
Median rent in in 2021:
| Beautiful Downtown Orchards: | $1,294 |
| Vancouver: | $1,311 |
Male vs Females
| Males: | 31 |
| Females: | 28 |
Median age
| Males: | 29.6 years |
| Females: | 30.7 years |
Most popular occupations of males: sales and office occupations (32.1%); education, training, and library occupations (11.8%); production occupations (11.6%); service occupations (11.1%); management occupations (except farmers) (9.9%); material moving occupations (7.1%); transportation occupations (4.5%)
Most popular occupations of females: service occupations (41.8%); sales and office occupations (23.3%); production occupations (13.4%); transportation occupations (6.9%); education, training, and library occupations (3.8%); healthcare practitioners and technical occupations (3.4%); business and financial operations occupations (2.5%)
Roads and streets: NE Coxley Dr; NE 109th Ct.
Beautiful Downtown Orchards neighborhood detailed profile
Beaver Garden Tracts neighborhood in Vancouver statistics: (Find on map)
Area: 0.191 square miles
Population: 141
Population density:
Median household income in 2021:
Median rent in in 2021:
Male vs Females
Median age
Housing prices:
Average estimated value of detached houses in 2021 (125.0% of all units):
Average estimated value of townhouses or other attached units in 2021 (3.1% of all units):
Average estimated '21 value of housing units in 5-or-more-unit structures (39.1% of all units):
Average estimated value of mobile home in 2021 (18.8% of all units):
Most popular occupations of males: transportation occupations (67.0%); sales and office occupations (39.2%); architecture and engineering occupations (26.5%); management occupations (except farmers) (25.5%); production occupations (18.6%); construction, extraction, and maintenance occupations (13.7%); business and financial operations occupations (13.5%)
Most popular occupations of females: healthcare practitioners and technical occupations (43.2%); sales and office occupations (36.1%); service occupations (26.8%); business and financial operations occupations (15.6%); management occupations (except farmers) (15.1%); education, training, and library occupations (14.1%); transportation occupations (13.9%)
Roads and streets: NE 139th Ave; NE 139th Loop; NE 50th St; NE 52nd St; NE 142nd Ave; NE 137th Ave; NE 54th Way; NE 51st St; NE 141st Ct; NE 138th Ave.
Beaver Garden Tracts neighborhood detailed profile
Area: 0.191 square miles
Population: 141
Population density:
| Beaver Garden Tracts: | 737 people per square mile |
| Vancouver: | 4,491 people per square mile |
Median household income in 2021:
| Beaver Garden Tracts: | $39,063 |
| Vancouver: | $69,993 |
Median rent in in 2021:
| Beaver Garden Tracts: | $1,349 |
| Vancouver: | $1,311 |
Male vs Females
| Males: | 53 |
| Females: | 88 |
Median age
| Males: | 34.2 years |
| Females: | 38.7 years |
Housing prices:
Average estimated value of detached houses in 2021 (125.0% of all units):
| Beaver Garden Tracts: | $324,749 |
| Vancouver: | $457,784 |
Average estimated value of townhouses or other attached units in 2021 (3.1% of all units):
| This neighborhood: | $275,138 |
| city: | $310,311 |
Average estimated '21 value of housing units in 5-or-more-unit structures (39.1% of all units):
| Beaver Garden Tracts: | $156,699 |
| Vancouver: | $351,621 |
Average estimated value of mobile home in 2021 (18.8% of all units):
| Beaver Garden Tracts: | $96,603 |
| Vancouver: | $109,677 |
Most popular occupations of males: transportation occupations (67.0%); sales and office occupations (39.2%); architecture and engineering occupations (26.5%); management occupations (except farmers) (25.5%); production occupations (18.6%); construction, extraction, and maintenance occupations (13.7%); business and financial operations occupations (13.5%)
Most popular occupations of females: healthcare practitioners and technical occupations (43.2%); sales and office occupations (36.1%); service occupations (26.8%); business and financial operations occupations (15.6%); management occupations (except farmers) (15.1%); education, training, and library occupations (14.1%); transportation occupations (13.9%)
Roads and streets: NE 139th Ave; NE 139th Loop; NE 50th St; NE 52nd St; NE 142nd Ave; NE 137th Ave; NE 54th Way; NE 51st St; NE 141st Ct; NE 138th Ave.
Beaver Garden Tracts neighborhood detailed profile
Beckinridge Infill neighborhood in Vancouver statistics: (Find on map)
Population: 1
Population density:
Median household income in 2021:
Median rent in in 2021:
Most popular occupations of males: production occupations (21.2%); management occupations (except farmers) (17.2%); service occupations (12.5%); sales and office occupations (11.1%); transportation occupations (8.2%); construction, extraction, and maintenance occupations (6.6%); computer and mathematical occupations (2.9%)
Most popular occupations of females: sales and office occupations (50.6%); management occupations (except farmers) (38.7%); service occupations (15.7%); production occupations (11.0%); business and financial operations occupations (9.6%); life, physical, and social science occupations (8.4%); healthcare practitioners and technical occupations (8.4%)
Beckinridge Infill neighborhood detailed profile
Population: 1
Population density:
| Beckinridge Infill: | 1,083 people per square mile |
| Vancouver: | 4,491 people per square mile |
Median household income in 2021:
| Beckinridge Infill: | $102,167 |
| Vancouver: | $69,993 |
Median rent in in 2021:
| Beckinridge Infill: | $1,505 |
| Vancouver: | $1,311 |
Most popular occupations of males: production occupations (21.2%); management occupations (except farmers) (17.2%); service occupations (12.5%); sales and office occupations (11.1%); transportation occupations (8.2%); construction, extraction, and maintenance occupations (6.6%); computer and mathematical occupations (2.9%)
Most popular occupations of females: sales and office occupations (50.6%); management occupations (except farmers) (38.7%); service occupations (15.7%); production occupations (11.0%); business and financial operations occupations (9.6%); life, physical, and social science occupations (8.4%); healthcare practitioners and technical occupations (8.4%)
Beckinridge Infill neighborhood detailed profile
Beckridge neighborhood in Vancouver statistics: (Find on map)
Area: 0.022 square miles
Population: 88
Population density:
Median household income in 2021:
Median rent in in 2021:
Male vs Females
Median age
Average estimated value of detached houses in 2021 (100.0% of all units):
Most popular occupations of males: sales and office occupations (21.0%); construction, extraction, and maintenance occupations (21.0%); architecture and engineering occupations (12.3%); production occupations (11.1%); computer and mathematical occupations (8.6%); material moving occupations (7.2%); education, training, and library occupations (6.9%)
Most popular occupations of females: sales and office occupations (40.3%); computer and mathematical occupations (21.5%); service occupations (17.9%); education, training, and library occupations (13.3%); management occupations (except farmers) (6.5%); business and financial operations occupations (5.7%); community and social services occupations (5.7%)
Roads and streets: NW 14th Ave; NW 97th St; NW 98th St; NW 12th Ave.
Beckridge neighborhood detailed profile
Area: 0.022 square miles
Population: 88
Population density:
| Beckridge: | 4,042 people per square mile |
| Vancouver: | 4,491 people per square mile |
Median household income in 2021:
| Beckridge: | $88,250 |
| Vancouver: | $69,993 |
Median rent in in 2021:
| Beckridge: | $1,693 |
| Vancouver: | $1,311 |
Male vs Females
| Males: | 48 |
| Females: | 40 |
Median age
| Males: | 37.5 years |
| Females: | 39.8 years |
Average estimated value of detached houses in 2021 (100.0% of all units):
| Beckridge: | $322,790 |
| Vancouver: | $457,784 |
Most popular occupations of males: sales and office occupations (21.0%); construction, extraction, and maintenance occupations (21.0%); architecture and engineering occupations (12.3%); production occupations (11.1%); computer and mathematical occupations (8.6%); material moving occupations (7.2%); education, training, and library occupations (6.9%)
Most popular occupations of females: sales and office occupations (40.3%); computer and mathematical occupations (21.5%); service occupations (17.9%); education, training, and library occupations (13.3%); management occupations (except farmers) (6.5%); business and financial operations occupations (5.7%); community and social services occupations (5.7%)
Roads and streets: NW 14th Ave; NW 97th St; NW 98th St; NW 12th Ave.
Beckridge neighborhood detailed profile
Bel-Air neighborhood in Vancouver statistics: (Find on map)
Area: 0.008 square miles
Roads and streets: SE 102nd Ave.
Bel-Air neighborhood detailed profile
Area: 0.008 square miles
Roads and streets: SE 102nd Ave.
Bel-Air neighborhood detailed profile
Bella Terra neighborhood in Vancouver statistics: (Find on map)
Area: 0.003 square miles
Population: 11
Population density:
Median household income in 2021:
Median rent in in 2021:
Male vs Females
Median age
Housing prices:
Average estimated value of detached houses in 2021 (66.7% of all units):
Most popular occupations of males: management occupations (except farmers) (16.3%); sales and office occupations (16.3%); construction, extraction, and maintenance occupations (13.7%); transportation occupations (12.2%); computer and mathematical occupations (10.7%); education, training, and library occupations (7.5%); production occupations (5.9%)
Most popular occupations of females: sales and office occupations (45.3%); service occupations (23.2%); management occupations (except farmers) (9.4%); production occupations (7.6%); education, training, and library occupations (7.2%); healthcare practitioners and technical occupations (3.5%); material moving occupations (3.2%)
Bella Terra neighborhood detailed profile
Area: 0.003 square miles
Population: 11
Population density:
| Bella Terra: | 3,338 people per square mile |
| Vancouver: | 4,491 people per square mile |
Median household income in 2021:
| Bella Terra: | $85,327 |
| Vancouver: | $69,993 |
Median rent in in 2021:
| Bella Terra: | $1,432 |
| Vancouver: | $1,311 |
Male vs Females
| Males: | 5 |
| Females: | 5 |
Median age
| Males: | 34.2 years |
| Females: | 34.8 years |
Housing prices:
Average estimated value of detached houses in 2021 (66.7% of all units):
| Bella Terra: | $327,562 |
| Vancouver: | $457,784 |
Most popular occupations of males: management occupations (except farmers) (16.3%); sales and office occupations (16.3%); construction, extraction, and maintenance occupations (13.7%); transportation occupations (12.2%); computer and mathematical occupations (10.7%); education, training, and library occupations (7.5%); production occupations (5.9%)
Most popular occupations of females: sales and office occupations (45.3%); service occupations (23.2%); management occupations (except farmers) (9.4%); production occupations (7.6%); education, training, and library occupations (7.2%); healthcare practitioners and technical occupations (3.5%); material moving occupations (3.2%)
Bella Terra neighborhood detailed profile
Bella Vista neighborhood in Vancouver statistics: (Find on map)
Area: 0.167 square miles
Population: 752
Population density:
Median household income in 2021:
Median rent in in 2021:
Male vs Females
Median age
Housing prices:
Average estimated value of detached houses in 2021 (76.8% of all units):
Average estimated value of townhouses or other attached units in 2021 (2.2% of all units):
Average estimated '21 value of housing units in 3-to-4-unit structures (16.2% of all units):
Average estimated '21 value of housing units in 5-or-more-unit structures (4.4% of all units):
Most popular occupations of males: business and financial operations occupations (18.6%); sales and office occupations (14.2%); transportation occupations (11.8%); material moving occupations (11.0%); architecture and engineering occupations (9.2%); service occupations (8.6%); construction, extraction, and maintenance occupations (5.2%)
Most popular occupations of females: sales and office occupations (28.0%); service occupations (21.8%); education, training, and library occupations (10.0%); healthcare practitioners and technical occupations (9.0%); community and social services occupations (8.1%); management occupations (except farmers) (6.8%); business and financial operations occupations (5.0%)
Roads and streets: SE Bella Vista Rd; SE Bella Vis Lp; SE 23rd Cir; SE 25th Cir; SE 21st St; SE 22nd Cir; SE 29th Cir; SE 141st Pl; SE 20th St; SE 20th Way; SE Cascade Park Dr; SE 140th Ave; SE 144th Ave; SE Mackwood Ct.
Bella Vista neighborhood detailed profile
Area: 0.167 square miles
Population: 752
Population density:
| Bella Vista: | 4,497 people per square mile |
| Vancouver: | 4,491 people per square mile |
Median household income in 2021:
| Bella Vista: | $97,009 |
| Vancouver: | $69,993 |
Median rent in in 2021:
| Bella Vista: | $1,363 |
| Vancouver: | $1,311 |
Male vs Females
| Males: | 387 |
| Females: | 364 |
Median age
| Males: | 42.8 years |
| Females: | 49.6 years |
Housing prices:
Average estimated value of detached houses in 2021 (76.8% of all units):
| Bella Vista: | $445,387 |
| Vancouver: | $457,784 |
Average estimated value of townhouses or other attached units in 2021 (2.2% of all units):
| This neighborhood: | $326,563 |
| city: | $310,311 |
Average estimated '21 value of housing units in 3-to-4-unit structures (16.2% of all units):
| Bella Vista: | $263,718 |
| city: | $1,050,955 |
Average estimated '21 value of housing units in 5-or-more-unit structures (4.4% of all units):
| Bella Vista: | $319,000 |
| Vancouver: | $351,621 |
Most popular occupations of males: business and financial operations occupations (18.6%); sales and office occupations (14.2%); transportation occupations (11.8%); material moving occupations (11.0%); architecture and engineering occupations (9.2%); service occupations (8.6%); construction, extraction, and maintenance occupations (5.2%)
Most popular occupations of females: sales and office occupations (28.0%); service occupations (21.8%); education, training, and library occupations (10.0%); healthcare practitioners and technical occupations (9.0%); community and social services occupations (8.1%); management occupations (except farmers) (6.8%); business and financial operations occupations (5.0%)
Roads and streets: SE Bella Vista Rd; SE Bella Vis Lp; SE 23rd Cir; SE 25th Cir; SE 21st St; SE 22nd Cir; SE 29th Cir; SE 141st Pl; SE 20th St; SE 20th Way; SE Cascade Park Dr; SE 140th Ave; SE 144th Ave; SE Mackwood Ct.
Bella Vista neighborhood detailed profile
Bella Vista Estates neighborhood in Vancouver statistics: (Find on map)
Area: 0.009 square miles
Population: 31
Population density:
Median household income in 2021:
Median rent in in 2021:
Male vs Females
Median age
Housing prices:
Average estimated value of detached houses in 2021 (90.9% of all units):
Average estimated '21 value of housing units in 3-to-4-unit structures (18.2% of all units):
Most popular occupations of males: business and financial operations occupations (51.9%); architecture and engineering occupations (11.0%); sales and office occupations (7.9%); service occupations (7.8%); healthcare practitioners and technical occupations (7.7%); management occupations (except farmers) (6.5%); education, training, and library occupations (6.5%)
Most popular occupations of females: sales and office occupations (25.3%); community and social services occupations (19.8%); business and financial operations occupations (14.6%); education, training, and library occupations (11.4%); service occupations (11.1%); management occupations (except farmers) (8.1%); healthcare practitioners and technical occupations (4.8%)
Bella Vista Estates neighborhood detailed profile
Area: 0.009 square miles
Population: 31
Population density:
| Bella Vista Estates: | 3,555 people per square mile |
| Vancouver: | 4,491 people per square mile |
Median household income in 2021:
| Bella Vista Estates: | $115,415 |
| Vancouver: | $69,993 |
Median rent in in 2021:
| Bella Vista Estates: | $1,363 |
| Vancouver: | $1,311 |
Male vs Females
| Males: | 16 |
| Females: | 15 |
Median age
| Males: | 40.9 years |
| Females: | 48.2 years |
Housing prices:
Average estimated value of detached houses in 2021 (90.9% of all units):
| Bella Vista Estates: | $449,235 |
| Vancouver: | $457,784 |
Average estimated '21 value of housing units in 3-to-4-unit structures (18.2% of all units):
| Bella Vista Estates: | $263,718 |
| city: | $1,050,955 |
Most popular occupations of males: business and financial operations occupations (51.9%); architecture and engineering occupations (11.0%); sales and office occupations (7.9%); service occupations (7.8%); healthcare practitioners and technical occupations (7.7%); management occupations (except farmers) (6.5%); education, training, and library occupations (6.5%)
Most popular occupations of females: sales and office occupations (25.3%); community and social services occupations (19.8%); business and financial operations occupations (14.6%); education, training, and library occupations (11.4%); service occupations (11.1%); management occupations (except farmers) (8.1%); healthcare practitioners and technical occupations (4.8%)
Bella Vista Estates neighborhood detailed profile
Bella Vista Heights neighborhood in Vancouver statistics: (Find on map)
Area: 0.010 square miles
Population: 19
Population density:
Median household income in 2021:
Median rent in in 2021:
Male vs Females
Median age
Housing prices:
Average estimated value of detached houses in 2021 (70.0% of all units):
Average estimated '21 value of housing units in 3-to-4-unit structures (20.0% of all units):
Most popular occupations of males: management occupations (except farmers) (26.3%); transportation occupations (21.5%); business and financial operations occupations (19.8%); sales and office occupations (19.5%); arts, design, entertainment, sports, and media occupations (13.7%); architecture and engineering occupations (8.3%); service occupations (6.8%)
Most popular occupations of females: education, training, and library occupations (33.9%); service occupations (27.4%); sales and office occupations (13.7%); management occupations (except farmers) (10.7%); architecture and engineering occupations (8.9%); healthcare practitioners and technical occupations (7.2%); business and financial operations occupations (6.2%)
Bella Vista Heights neighborhood detailed profile
Area: 0.010 square miles
Population: 19
Population density:
| Bella Vista Heights: | 1,990 people per square mile |
| Vancouver: | 4,491 people per square mile |
Median household income in 2021:
| Bella Vista Heights: | $73,029 |
| Vancouver: | $69,993 |
Median rent in in 2021:
| Bella Vista Heights: | $1,488 |
| Vancouver: | $1,311 |
Male vs Females
| Males: | 9 |
| Females: | 10 |
Median age
| Males: | 60.4 years |
| Females: | 71.6 years |
Housing prices:
Average estimated value of detached houses in 2021 (70.0% of all units):
| Bella Vista Heights: | $329,806 |
| Vancouver: | $457,784 |
Average estimated '21 value of housing units in 3-to-4-unit structures (20.0% of all units):
| Bella Vista Heights: | $263,718 |
| city: | $1,050,955 |
Most popular occupations of males: management occupations (except farmers) (26.3%); transportation occupations (21.5%); business and financial operations occupations (19.8%); sales and office occupations (19.5%); arts, design, entertainment, sports, and media occupations (13.7%); architecture and engineering occupations (8.3%); service occupations (6.8%)
Most popular occupations of females: education, training, and library occupations (33.9%); service occupations (27.4%); sales and office occupations (13.7%); management occupations (except farmers) (10.7%); architecture and engineering occupations (8.9%); healthcare practitioners and technical occupations (7.2%); business and financial operations occupations (6.2%)
Bella Vista Heights neighborhood detailed profile
Bella Vista Woods neighborhood in Vancouver statistics: (Find on map)
Area: 0.012 square miles
Population: 67
Population density:
Median household income in 2021:
Median rent in in 2021:
Male vs Females
Median age
Average estimated value of detached houses in 2021 (64.0% of all units):
Most popular occupations of males: sales and office occupations (16.1%); transportation occupations (15.9%); material moving occupations (14.3%); service occupations (9.8%); construction, extraction, and maintenance occupations (8.7%); architecture and engineering occupations (8.2%); production occupations (6.5%)
Most popular occupations of females: sales and office occupations (28.7%); service occupations (27.1%); healthcare practitioners and technical occupations (9.9%); education, training, and library occupations (8.7%); management occupations (except farmers) (8.1%); material moving occupations (4.6%); transportation occupations (3.5%)
Roads and streets: SE 20th St.
Bella Vista Woods neighborhood detailed profile
Area: 0.012 square miles
Population: 67
Population density:
| Bella Vista Woods: | 5,448 people per square mile |
| Vancouver: | 4,491 people per square mile |
Median household income in 2021:
| Bella Vista Woods: | $87,250 |
| Vancouver: | $69,993 |
Median rent in in 2021:
| Bella Vista Woods: | $1,363 |
| Vancouver: | $1,311 |
Male vs Females
| Males: | 34 |
| Females: | 33 |
Median age
| Males: | 38.2 years |
| Females: | 40.1 years |
Average estimated value of detached houses in 2021 (64.0% of all units):
| Bella Vista Woods: | $441,884 |
| Vancouver: | $457,784 |
Most popular occupations of males: sales and office occupations (16.1%); transportation occupations (15.9%); material moving occupations (14.3%); service occupations (9.8%); construction, extraction, and maintenance occupations (8.7%); architecture and engineering occupations (8.2%); production occupations (6.5%)
Most popular occupations of females: sales and office occupations (28.7%); service occupations (27.1%); healthcare practitioners and technical occupations (9.9%); education, training, and library occupations (8.7%); management occupations (except farmers) (8.1%); material moving occupations (4.6%); transportation occupations (3.5%)
Roads and streets: SE 20th St.
Bella Vista Woods neighborhood detailed profile
Belle Ridge neighborhood in Vancouver statistics: (Find on map)
Area: 0.021 square miles
Population: 62
Population density:
Median household income in 2021:
Median rent in in 2021:
Male vs Females
Median age
Housing prices:
Average estimated value of detached houses in 2021 (96.2% of all units):
Average estimated value of townhouses or other attached units in 2021 (3.8% of all units):
Most popular occupations of males: management occupations (except farmers) (25.6%); material moving occupations (19.2%); service occupations (13.8%); transportation occupations (8.8%); sales and office occupations (8.6%); construction, extraction, and maintenance occupations (6.6%); computer and mathematical occupations (4.5%)
Most popular occupations of females: sales and office occupations (31.2%); service occupations (22.9%); healthcare practitioners and technical occupations (16.6%); production occupations (10.0%); computer and mathematical occupations (5.8%); management occupations (except farmers) (4.1%); community and social services occupations (3.2%)
Roads and streets: NE 86th Ct.
Belle Ridge neighborhood detailed profile
Area: 0.021 square miles
Population: 62
Population density:
| Belle Ridge: | 2,896 people per square mile |
| Vancouver: | 4,491 people per square mile |
Median household income in 2021:
| Belle Ridge: | $98,859 |
| Vancouver: | $69,993 |
Median rent in in 2021:
| Belle Ridge: | $1,801 |
| Vancouver: | $1,311 |
Male vs Females
| Males: | 31 |
| Females: | 31 |
Median age
| Males: | 39.1 years |
| Females: | 42.4 years |
Housing prices:
Average estimated value of detached houses in 2021 (96.2% of all units):
| Belle Ridge: | $301,684 |
| Vancouver: | $457,784 |
Average estimated value of townhouses or other attached units in 2021 (3.8% of all units):
| This neighborhood: | $200,799 |
| city: | $310,311 |
Most popular occupations of males: management occupations (except farmers) (25.6%); material moving occupations (19.2%); service occupations (13.8%); transportation occupations (8.8%); sales and office occupations (8.6%); construction, extraction, and maintenance occupations (6.6%); computer and mathematical occupations (4.5%)
Most popular occupations of females: sales and office occupations (31.2%); service occupations (22.9%); healthcare practitioners and technical occupations (16.6%); production occupations (10.0%); computer and mathematical occupations (5.8%); management occupations (except farmers) (4.1%); community and social services occupations (3.2%)
Roads and streets: NE 86th Ct.
Belle Ridge neighborhood detailed profile
Belmont Estates neighborhood in Vancouver statistics: (Find on map)
Area: 0.017 square miles
Population: 105
Population density:
Median household income in 2021:
Median rent in in 2021:
Male vs Females
Median age
Housing prices:
Average estimated value of detached houses in 2021 (67.6% of all units):
Average estimated value of mobile home in 2021 (26.5% of all units):
Most popular occupations of males: management occupations (except farmers) (29.3%); production occupations (13.6%); transportation occupations (11.4%); sales and office occupations (10.3%); construction, extraction, and maintenance occupations (10.1%); service occupations (6.0%); healthcare practitioners and technical occupations (5.0%)
Most popular occupations of females: service occupations (37.2%); sales and office occupations (33.0%); healthcare practitioners and technical occupations (11.9%); education, training, and library occupations (5.3%); management occupations (except farmers) (4.4%); life, physical, and social science occupations (3.8%); community and social services occupations (3.5%)
Roads and streets: NE 10th Way; NE 9th St; NE 10th St; NE 169th Ave; NE 167th Ave.
Belmont Estates neighborhood detailed profile
Area: 0.017 square miles
Population: 105
Population density:
| Belmont Estates: | 6,091 people per square mile |
| Vancouver: | 4,491 people per square mile |
Median household income in 2021:
| Belmont Estates: | $85,521 |
| Vancouver: | $69,993 |
Median rent in in 2021:
| Belmont Estates: | $1,863 |
| Vancouver: | $1,311 |
Male vs Females
| Males: | 52 |
| Females: | 52 |
Median age
| Males: | 39.7 years |
| Females: | 34.9 years |
Housing prices:
Average estimated value of detached houses in 2021 (67.6% of all units):
| Belmont Estates: | $388,602 |
| Vancouver: | $457,784 |
Average estimated value of mobile home in 2021 (26.5% of all units):
| Belmont Estates: | $107,134 |
| Vancouver: | $109,677 |
Most popular occupations of males: management occupations (except farmers) (29.3%); production occupations (13.6%); transportation occupations (11.4%); sales and office occupations (10.3%); construction, extraction, and maintenance occupations (10.1%); service occupations (6.0%); healthcare practitioners and technical occupations (5.0%)
Most popular occupations of females: service occupations (37.2%); sales and office occupations (33.0%); healthcare practitioners and technical occupations (11.9%); education, training, and library occupations (5.3%); management occupations (except farmers) (4.4%); life, physical, and social science occupations (3.8%); community and social services occupations (3.5%)
Roads and streets: NE 10th Way; NE 9th St; NE 10th St; NE 169th Ave; NE 167th Ave.
Belmont Estates neighborhood detailed profile
Belmont Place neighborhood in Vancouver statistics: (Find on map)
Area: 0.060 square miles
Population: 384
Population density:
Median household income in 2021:
Median rent in in 2021:
Male vs Females
Median age
Housing prices:
Average estimated value of detached houses in 2021 (23.4% of all units):
Average estimated value of townhouses or other attached units in 2021 (19.8% of all units):
Most popular occupations of males: service occupations (19.7%); construction, extraction, and maintenance occupations (17.0%); business and financial operations occupations (15.1%); sales and office occupations (10.4%); production occupations (10.4%); material moving occupations (7.3%); transportation occupations (6.2%)
Most popular occupations of females: service occupations (35.7%); sales and office occupations (32.3%); management occupations (except farmers) (11.7%); healthcare practitioners and technical occupations (7.8%); education, training, and library occupations (6.6%); architecture and engineering occupations (5.9%); transportation occupations (3.0%)
Roads and streets: NE 77th Ave; NE 78th Ave; NE 21st St; NE 79th Ave; NE 78th Ct; NE 79th Ct.
Belmont Place neighborhood detailed profile
Area: 0.060 square miles
Population: 384
Population density:
| Belmont Place: | 6,352 people per square mile |
| Vancouver: | 4,491 people per square mile |
Median household income in 2021:
| Belmont Place: | $59,488 |
| Vancouver: | $69,993 |
Median rent in in 2021:
| Belmont Place: | $1,509 |
| Vancouver: | $1,311 |
Male vs Females
| Males: | 202 |
| Females: | 182 |
Median age
| Males: | 35.0 years |
| Females: | 33.8 years |
Housing prices:
Average estimated value of detached houses in 2021 (23.4% of all units):
| Belmont Place: | $302,541 |
| Vancouver: | $457,784 |
Average estimated value of townhouses or other attached units in 2021 (19.8% of all units):
| This neighborhood: | $234,005 |
| city: | $310,311 |
Most popular occupations of males: service occupations (19.7%); construction, extraction, and maintenance occupations (17.0%); business and financial operations occupations (15.1%); sales and office occupations (10.4%); production occupations (10.4%); material moving occupations (7.3%); transportation occupations (6.2%)
Most popular occupations of females: service occupations (35.7%); sales and office occupations (32.3%); management occupations (except farmers) (11.7%); healthcare practitioners and technical occupations (7.8%); education, training, and library occupations (6.6%); architecture and engineering occupations (5.9%); transportation occupations (3.0%)
Roads and streets: NE 77th Ave; NE 78th Ave; NE 21st St; NE 79th Ave; NE 78th Ct; NE 79th Ct.
Belmont Place neighborhood detailed profile
Ben-Hollow neighborhood in Vancouver statistics: (Find on map)
Area: 0.012 square miles
Population: 24
Population density:
Median household income in 2021:
Median rent in in 2021:
Male vs Females
Median age
Average estimated value of detached houses in 2021 (100.0% of all units):
Most popular occupations of males: service occupations (15.2%); management occupations (except farmers) (14.6%); sales and office occupations (12.8%); architecture and engineering occupations (8.1%); production occupations (7.4%); education, training, and library occupations (7.0%); construction, extraction, and maintenance occupations (6.6%)
Most popular occupations of females: sales and office occupations (33.5%); business and financial operations occupations (26.1%); service occupations (13.1%); education, training, and library occupations (10.7%); healthcare practitioners and technical occupations (6.4%); arts, design, entertainment, sports, and media occupations (5.0%); community and social services occupations (3.0%)
Roads and streets: NE 41st Ct; NE 42nd Ct.
Ben-Hollow neighborhood detailed profile
Area: 0.012 square miles
Population: 24
Population density:
| Ben-Hollow: | 1,946 people per square mile |
| Vancouver: | 4,491 people per square mile |
Median household income in 2021:
| Ben-Hollow: | $106,717 |
| Vancouver: | $69,993 |
Median rent in in 2021:
| Ben-Hollow: | $1,738 |
| Vancouver: | $1,311 |
Male vs Females
| Males: | 12 |
| Females: | 12 |
Median age
| Males: | 38.7 years |
| Females: | 46.4 years |
Average estimated value of detached houses in 2021 (100.0% of all units):
| Ben-Hollow: | $421,431 |
| Vancouver: | $457,784 |
Most popular occupations of males: service occupations (15.2%); management occupations (except farmers) (14.6%); sales and office occupations (12.8%); architecture and engineering occupations (8.1%); production occupations (7.4%); education, training, and library occupations (7.0%); construction, extraction, and maintenance occupations (6.6%)
Most popular occupations of females: sales and office occupations (33.5%); business and financial operations occupations (26.1%); service occupations (13.1%); education, training, and library occupations (10.7%); healthcare practitioners and technical occupations (6.4%); arts, design, entertainment, sports, and media occupations (5.0%); community and social services occupations (3.0%)
Roads and streets: NE 41st Ct; NE 42nd Ct.
Ben-Hollow neighborhood detailed profile
Bennett Estates neighborhood in Vancouver statistics: (Find on map)
Area: 0.064 square miles
Population: 303
Population density:
Median household income in 2021:
Median rent in in 2021:
Male vs Females
Median age
Most popular occupations of males: sales and office occupations (25.6%); construction, extraction, and maintenance occupations (18.2%); management occupations (except farmers) (16.2%); service occupations (12.8%); transportation occupations (10.1%); material moving occupations (6.8%); production occupations (6.4%)
Most popular occupations of females: service occupations (30.6%); education, training, and library occupations (16.1%); sales and office occupations (15.8%); management occupations (except farmers) (8.3%); healthcare practitioners and technical occupations (7.0%); legal occupations (6.2%); arts, design, entertainment, sports, and media occupations (6.2%)
Roads and streets: NE 98th Ave; NE 15th St; NE 16th St; NE 101st Ave; NE 17th Cir; NE 102nd Ave; NE 100th Ave; NE 99th Ave; NE 15th Cir.
Bennett Estates neighborhood detailed profile
Area: 0.064 square miles
Population: 303
Population density:
| Bennett Estates: | 4,761 people per square mile |
| Vancouver: | 4,491 people per square mile |
Median household income in 2021:
| Bennett Estates: | $64,630 |
| Vancouver: | $69,993 |
Median rent in in 2021:
| Bennett Estates: | $1,407 |
| Vancouver: | $1,311 |
Male vs Females
| Males: | 120 |
| Females: | 182 |
Median age
| Males: | 43.4 years |
| Females: | 44.1 years |
Most popular occupations of males: sales and office occupations (25.6%); construction, extraction, and maintenance occupations (18.2%); management occupations (except farmers) (16.2%); service occupations (12.8%); transportation occupations (10.1%); material moving occupations (6.8%); production occupations (6.4%)
Most popular occupations of females: service occupations (30.6%); education, training, and library occupations (16.1%); sales and office occupations (15.8%); management occupations (except farmers) (8.3%); healthcare practitioners and technical occupations (7.0%); legal occupations (6.2%); arts, design, entertainment, sports, and media occupations (6.2%)
Roads and streets: NE 98th Ave; NE 15th St; NE 16th St; NE 101st Ave; NE 17th Cir; NE 102nd Ave; NE 100th Ave; NE 99th Ave; NE 15th Cir.
Bennett Estates neighborhood detailed profile
Bennett Estates Foxcroft neighborhood in Vancouver statistics: (Find on map)
Area: 0.006 square miles
Population: 31
Population density:
Median household income in 2021:
Median rent in in 2021:
Male vs Females
Median age
Average estimated value of detached houses in 2021 (100.0% of all units):
Most popular occupations of males: sales and office occupations (27.3%); material moving occupations (22.2%); business and financial operations occupations (13.6%); management occupations (except farmers) (9.4%); construction, extraction, and maintenance occupations (8.2%); service occupations (7.4%); production occupations (4.5%)
Most popular occupations of females: education, training, and library occupations (55.6%); sales and office occupations (14.4%); service occupations (10.9%); production occupations (6.8%); healthcare practitioners and technical occupations (6.5%); arts, design, entertainment, sports, and media occupations (5.9%); business and financial operations occupations (4.3%)
Roads and streets: NE Sandpiper Cir.
Bennett Estates Foxcroft neighborhood detailed profile
Area: 0.006 square miles
Population: 31
Population density:
| Bennett Estates Foxcroft: | 4,938 people per square mile |
| Vancouver: | 4,491 people per square mile |
Median household income in 2021:
| Bennett Estates Foxcroft: | $73,291 |
| Vancouver: | $69,993 |
Median rent in in 2021:
| Bennett Estates Foxcroft: | $1,602 |
| Vancouver: | $1,311 |
Male vs Females
| Males: | 13 |
| Females: | 18 |
Median age
| Males: | 42.3 years |
| Females: | 40.3 years |
Average estimated value of detached houses in 2021 (100.0% of all units):
| Bennett Estates Foxcroft: | $303,060 |
| Vancouver: | $457,784 |
Most popular occupations of males: sales and office occupations (27.3%); material moving occupations (22.2%); business and financial operations occupations (13.6%); management occupations (except farmers) (9.4%); construction, extraction, and maintenance occupations (8.2%); service occupations (7.4%); production occupations (4.5%)
Most popular occupations of females: education, training, and library occupations (55.6%); sales and office occupations (14.4%); service occupations (10.9%); production occupations (6.8%); healthcare practitioners and technical occupations (6.5%); arts, design, entertainment, sports, and media occupations (5.9%); business and financial operations occupations (4.3%)
Roads and streets: NE Sandpiper Cir.
Bennett Estates Foxcroft neighborhood detailed profile
Bennington neighborhood in Vancouver statistics: (Find on map)
Area: 0.988 square miles
Population: 1,188
Population density:
Median household income in 2021:
Median rent in in 2021:
Male vs Females
Median age
Housing prices:
Average estimated value of detached houses in 2021 (78.6% of all units):
Average estimated value of townhouses or other attached units in 2021 (21.1% of all units):
Average estimated value of mobile home in 2021 (78.2% of all units):
Most popular occupations of males: service occupations (49.7%); sales and office occupations (19.4%); business and financial operations occupations (15.3%); community and social services occupations (5.1%); management occupations (except farmers) (1.5%)
Most popular occupations of females: sales and office occupations (27.7%); transportation occupations (25.0%); legal occupations (21.4%); production occupations (20.3%); service occupations (14.6%); education, training, and library occupations (10.3%); architecture and engineering occupations (4.3%)
Limited-access highways (interstate or state) in this neighborhood: SE 189th Pl (SE 189th Place).
Roads and streets: SE 1st St; SE 192nd Ave; SE Tech Center Dr; SE 15th St; SE Redwood Cir; SE 12th Dr; SE 11th St; SE 3rd St; SE 2nd St; SE Mill Plain Blvd (SE 172nd Ave); SE 187th Ave; SE 182nd Ave; SE Single Tree Dr; SE Mill Plain Blvd; SE 181st Ave; SE 12th Way; SE 11th Way; SE 188th Ave; SE 13th St; SE 14th St; SE 179th Ave; SE 4th St; SE 5th St; SE Sequoia Cir; SE 175th Ave; SE 169th Ave; SE 168th Ave; SE 171st Ave; SE 14th Cir; SE 6th St; SE 177th Ave; SE Cardinal Ct; SE 13th Cir; SE 12th Cir; SE 14th Way; SE 191st Ave; SE Alicia Cir; SE Tech Center Pl; SE 179th Ct; SE 12th St; SE 173rd Ave; SE 178th Ct; SE 170th Ct; SE 176th Ct.
Bennington neighborhood detailed profile
Area: 0.988 square miles
Population: 1,188
Population density:
| Bennington: | 1,202 people per square mile |
| Vancouver: | 4,491 people per square mile |
Median household income in 2021:
| Bennington: | $89,616 |
| Vancouver: | $69,993 |
Median rent in in 2021:
| Bennington: | $1,754 |
| Vancouver: | $1,311 |
Male vs Females
| Males: | 631 |
| Females: | 556 |
Median age
| Males: | 40.3 years |
| Females: | 36.5 years |
Housing prices:
Average estimated value of detached houses in 2021 (78.6% of all units):
| Bennington: | $395,602 |
| Vancouver: | $457,784 |
Average estimated value of townhouses or other attached units in 2021 (21.1% of all units):
| This neighborhood: | $296,447 |
| city: | $310,311 |
Average estimated value of mobile home in 2021 (78.2% of all units):
| Bennington: | $107,134 |
| Vancouver: | $109,677 |
Most popular occupations of males: service occupations (49.7%); sales and office occupations (19.4%); business and financial operations occupations (15.3%); community and social services occupations (5.1%); management occupations (except farmers) (1.5%)
Most popular occupations of females: sales and office occupations (27.7%); transportation occupations (25.0%); legal occupations (21.4%); production occupations (20.3%); service occupations (14.6%); education, training, and library occupations (10.3%); architecture and engineering occupations (4.3%)
Limited-access highways (interstate or state) in this neighborhood: SE 189th Pl (SE 189th Place).
Roads and streets: SE 1st St; SE 192nd Ave; SE Tech Center Dr; SE 15th St; SE Redwood Cir; SE 12th Dr; SE 11th St; SE 3rd St; SE 2nd St; SE Mill Plain Blvd (SE 172nd Ave); SE 187th Ave; SE 182nd Ave; SE Single Tree Dr; SE Mill Plain Blvd; SE 181st Ave; SE 12th Way; SE 11th Way; SE 188th Ave; SE 13th St; SE 14th St; SE 179th Ave; SE 4th St; SE 5th St; SE Sequoia Cir; SE 175th Ave; SE 169th Ave; SE 168th Ave; SE 171st Ave; SE 14th Cir; SE 6th St; SE 177th Ave; SE Cardinal Ct; SE 13th Cir; SE 12th Cir; SE 14th Way; SE 191st Ave; SE Alicia Cir; SE Tech Center Pl; SE 179th Ct; SE 12th St; SE 173rd Ave; SE 178th Ct; SE 170th Ct; SE 176th Ct.
Bennington neighborhood detailed profile
Berdie Acres neighborhood in Vancouver statistics: (Find on map)
Area: 0.016 square miles
Population: 61
Population density:
Median household income in 2021:
Median rent in in 2021:
Male vs Females
Median age
Average estimated value of detached houses in 2021 (77.8% of all units):
Most popular occupations of males: service occupations (27.9%); management occupations (except farmers) (15.6%); sales and office occupations (15.0%); production occupations (12.3%); material moving occupations (7.3%); healthcare practitioners and technical occupations (6.9%); construction, extraction, and maintenance occupations (6.5%)
Most popular occupations of females: service occupations (44.1%); sales and office occupations (14.6%); transportation occupations (14.6%); legal occupations (11.6%); business and financial operations occupations (6.5%); production occupations (5.8%); healthcare practitioners and technical occupations (5.0%)
Berdie Acres neighborhood detailed profile
Area: 0.016 square miles
Population: 61
Population density:
| Berdie Acres: | 3,849 people per square mile |
| Vancouver: | 4,491 people per square mile |
Median household income in 2021:
| Berdie Acres: | $83,750 |
| Vancouver: | $69,993 |
Median rent in in 2021:
| Berdie Acres: | $1,408 |
| Vancouver: | $1,311 |
Male vs Females
| Males: | 34 |
| Females: | 26 |
Median age
| Males: | 25.4 years |
| Females: | 30.3 years |
Average estimated value of detached houses in 2021 (77.8% of all units):
| Berdie Acres: | $362,336 |
| Vancouver: | $457,784 |
Most popular occupations of males: service occupations (27.9%); management occupations (except farmers) (15.6%); sales and office occupations (15.0%); production occupations (12.3%); material moving occupations (7.3%); healthcare practitioners and technical occupations (6.9%); construction, extraction, and maintenance occupations (6.5%)
Most popular occupations of females: service occupations (44.1%); sales and office occupations (14.6%); transportation occupations (14.6%); legal occupations (11.6%); business and financial operations occupations (6.5%); production occupations (5.8%); healthcare practitioners and technical occupations (5.0%)
Berdie Acres neighborhood detailed profile
Berry Acres neighborhood in Vancouver statistics: (Find on map)
Area: 0.252 square miles
Roads and streets: NE 124th Ave; NE 101st St; NE 99th St; NE 111th Cir; NE 122nd Ave; NE 130th Ave; NE 100th St; NE 131st Ave; NE 127th Ct; NE 129th Ave; NE 128th Ave; NE 123rd Ct; NE 99th Way.
Berry Acres neighborhood detailed profile
Area: 0.252 square miles
Roads and streets: NE 124th Ave; NE 101st St; NE 99th St; NE 111th Cir; NE 122nd Ave; NE 130th Ave; NE 100th St; NE 131st Ave; NE 127th Ct; NE 129th Ave; NE 128th Ave; NE 123rd Ct; NE 99th Way.
Berry Acres neighborhood detailed profile
Beverly Heights neighborhood in Vancouver statistics: (Find on map)
Area: 0.002 square miles
Population: 11
Population density:
Median household income in 2021:
Median rent in in 2021:
Male vs Females
Median age
Housing prices:
Average estimated value of detached houses in 2021 (80.0% of all units):
Most popular occupations of males: business and financial operations occupations (19.2%); construction, extraction, and maintenance occupations (16.0%); sales and office occupations (12.9%); transportation occupations (10.0%); material moving occupations (7.1%); management occupations (except farmers) (6.7%); computer and mathematical occupations (6.5%)
Most popular occupations of females: sales and office occupations (47.3%); service occupations (11.4%); healthcare practitioners and technical occupations (10.7%); arts, design, entertainment, sports, and media occupations (8.8%); management occupations (except farmers) (8.4%); business and financial operations occupations (4.4%); life, physical, and social science occupations (3.5%)
Beverly Heights neighborhood detailed profile
Area: 0.002 square miles
Population: 11
Population density:
| Beverly Heights: | 4,728 people per square mile |
| Vancouver: | 4,491 people per square mile |
Median household income in 2021:
| Beverly Heights: | $63,571 |
| Vancouver: | $69,993 |
Median rent in in 2021:
| Beverly Heights: | $1,160 |
| Vancouver: | $1,311 |
Male vs Females
| Males: | 5 |
| Females: | 5 |
Median age
| Males: | 46.6 years |
| Females: | 52.5 years |
Housing prices:
Average estimated value of detached houses in 2021 (80.0% of all units):
| Beverly Heights: | $502,469 |
| Vancouver: | $457,784 |
Most popular occupations of males: business and financial operations occupations (19.2%); construction, extraction, and maintenance occupations (16.0%); sales and office occupations (12.9%); transportation occupations (10.0%); material moving occupations (7.1%); management occupations (except farmers) (6.7%); computer and mathematical occupations (6.5%)
Most popular occupations of females: sales and office occupations (47.3%); service occupations (11.4%); healthcare practitioners and technical occupations (10.7%); arts, design, entertainment, sports, and media occupations (8.8%); management occupations (except farmers) (8.4%); business and financial operations occupations (4.4%); life, physical, and social science occupations (3.5%)
Beverly Heights neighborhood detailed profile
Beverly Park neighborhood in Vancouver statistics: (Find on map)
Area: 0.014 square miles
Population: 25
Population density:
Median household income in 2021:
Median rent in in 2021:
Male vs Females
Median age
Housing prices:
Average estimated value of detached houses in 2021 (100.0% of all units):
Most popular occupations of males: sales and office occupations (28.6%); management occupations (except farmers) (26.4%); transportation occupations (25.6%); construction, extraction, and maintenance occupations (14.5%); material moving occupations (10.6%); service occupations (10.1%); production occupations (9.5%)
Most popular occupations of females: sales and office occupations (37.6%); service occupations (19.0%); production occupations (13.8%); education, training, and library occupations (7.9%); business and financial operations occupations (6.3%); legal occupations (5.8%); healthcare practitioners and technical occupations (5.8%)
Roads and streets: NE 87th St; NE 87th Cir.
Beverly Park neighborhood detailed profile
Area: 0.014 square miles
Population: 25
Population density:
| Beverly Park: | 1,798 people per square mile |
| Vancouver: | 4,491 people per square mile |
Median household income in 2021:
| Beverly Park: | $78,152 |
| Vancouver: | $69,993 |
Median rent in in 2021:
| Beverly Park: | $1,733 |
| Vancouver: | $1,311 |
Male vs Females
| Males: | 13 |
| Females: | 12 |
Median age
| Males: | 51.8 years |
| Females: | 54.6 years |
Housing prices:
Average estimated value of detached houses in 2021 (100.0% of all units):
| Beverly Park: | $456,849 |
| Vancouver: | $457,784 |
Most popular occupations of males: sales and office occupations (28.6%); management occupations (except farmers) (26.4%); transportation occupations (25.6%); construction, extraction, and maintenance occupations (14.5%); material moving occupations (10.6%); service occupations (10.1%); production occupations (9.5%)
Most popular occupations of females: sales and office occupations (37.6%); service occupations (19.0%); production occupations (13.8%); education, training, and library occupations (7.9%); business and financial operations occupations (6.3%); legal occupations (5.8%); healthcare practitioners and technical occupations (5.8%)
Roads and streets: NE 87th St; NE 87th Cir.
Beverly Park neighborhood detailed profile
Biddles Landing neighborhood in Vancouver statistics: (Find on map)
Area: 0.025 square miles
Population: 52
Population density:
Median household income in 2021:
Median rent in in 2021:
Male vs Females
Median age
Housing prices:
Average estimated value of detached houses in 2021 (74.1% of all units):
Average estimated value of townhouses or other attached units in 2021 (3.7% of all units):
Average estimated '21 value of housing units in 3-to-4-unit structures (22.2% of all units):
Most popular occupations of males: management occupations (except farmers) (26.3%); transportation occupations (21.5%); business and financial operations occupations (19.6%); sales and office occupations (19.5%); arts, design, entertainment, sports, and media occupations (13.7%); architecture and engineering occupations (8.3%); service occupations (6.8%)
Most popular occupations of females: education, training, and library occupations (33.9%); service occupations (27.4%); sales and office occupations (13.7%); management occupations (except farmers) (10.7%); architecture and engineering occupations (8.9%); healthcare practitioners and technical occupations (7.1%); business and financial operations occupations (6.2%)
Roads and streets: SE Biddle Rd.
Biddles Landing neighborhood detailed profile
Area: 0.025 square miles
Population: 52
Population density:
| Biddles Landing: | 2,045 people per square mile |
| Vancouver: | 4,491 people per square mile |
Median household income in 2021:
| Biddles Landing: | $73,029 |
| Vancouver: | $69,993 |
Median rent in in 2021:
| Biddles Landing: | $1,488 |
| Vancouver: | $1,311 |
Male vs Females
| Males: | 25 |
| Females: | 26 |
Median age
| Males: | 60.4 years |
| Females: | 71.6 years |
Housing prices:
Average estimated value of detached houses in 2021 (74.1% of all units):
| Biddles Landing: | $329,806 |
| Vancouver: | $457,784 |
Average estimated value of townhouses or other attached units in 2021 (3.7% of all units):
| This neighborhood: | $326,563 |
| city: | $310,311 |
Average estimated '21 value of housing units in 3-to-4-unit structures (22.2% of all units):
| Biddles Landing: | $263,718 |
| city: | $1,050,955 |
Most popular occupations of males: management occupations (except farmers) (26.3%); transportation occupations (21.5%); business and financial operations occupations (19.6%); sales and office occupations (19.5%); arts, design, entertainment, sports, and media occupations (13.7%); architecture and engineering occupations (8.3%); service occupations (6.8%)
Most popular occupations of females: education, training, and library occupations (33.9%); service occupations (27.4%); sales and office occupations (13.7%); management occupations (except farmers) (10.7%); architecture and engineering occupations (8.9%); healthcare practitioners and technical occupations (7.1%); business and financial operations occupations (6.2%)
Roads and streets: SE Biddle Rd.
Biddles Landing neighborhood detailed profile
Biltmore Place neighborhood in Vancouver statistics: (Find on map)
Area: 0.016 square miles
Population: 52
Population density:
Median household income in 2021:
Median rent in in 2021:
Male vs Females
Median age
Housing prices:
Average estimated value of detached houses in 2021 (86.7% of all units):
Most popular occupations of males: sales and office occupations (16.2%); management occupations (except farmers) (16.1%); construction, extraction, and maintenance occupations (13.7%); transportation occupations (12.1%); computer and mathematical occupations (10.5%); education, training, and library occupations (7.4%); business and financial operations occupations (5.0%)
Most popular occupations of females: sales and office occupations (45.1%); service occupations (23.3%); management occupations (except farmers) (9.5%); production occupations (7.6%); education, training, and library occupations (7.1%); healthcare practitioners and technical occupations (3.5%); material moving occupations (3.2%)
Roads and streets: NE 94th St; NE 95th St; NE 105th Ave; NE 106th Ave; NE 104th Ave.
Biltmore Place neighborhood detailed profile
Area: 0.016 square miles
Population: 52
Population density:
| Biltmore Place: | 3,350 people per square mile |
| Vancouver: | 4,491 people per square mile |
Median household income in 2021:
| Biltmore Place: | $96,633 |
| Vancouver: | $69,993 |
Median rent in in 2021:
| Biltmore Place: | $1,434 |
| Vancouver: | $1,311 |
Male vs Females
| Males: | 26 |
| Females: | 25 |
Median age
| Males: | 37.3 years |
| Females: | 41.8 years |
Housing prices:
Average estimated value of detached houses in 2021 (86.7% of all units):
| Biltmore Place: | $280,746 |
| Vancouver: | $457,784 |
Most popular occupations of males: sales and office occupations (16.2%); management occupations (except farmers) (16.1%); construction, extraction, and maintenance occupations (13.7%); transportation occupations (12.1%); computer and mathematical occupations (10.5%); education, training, and library occupations (7.4%); business and financial operations occupations (5.0%)
Most popular occupations of females: sales and office occupations (45.1%); service occupations (23.3%); management occupations (except farmers) (9.5%); production occupations (7.6%); education, training, and library occupations (7.1%); healthcare practitioners and technical occupations (3.5%); material moving occupations (3.2%)
Roads and streets: NE 94th St; NE 95th St; NE 105th Ave; NE 106th Ave; NE 104th Ave.
Biltmore Place neighborhood detailed profile
Birch Tree Cove neighborhood in Vancouver statistics: (Find on map)
Area: 0.011 square miles
Population: 6
Population density:
Median household income in 2021:
Median rent in in 2021:
Male vs Females
Median age
Most popular occupations of males: sales and office occupations (17.3%); service occupations (12.7%); management occupations (except farmers) (12.1%); education, training, and library occupations (9.5%); production occupations (9.0%); construction, extraction, and maintenance occupations (8.1%); material moving occupations (8.0%)
Most popular occupations of females: sales and office occupations (38.6%); service occupations (17.7%); management occupations (except farmers) (12.0%); healthcare practitioners and technical occupations (7.3%); transportation occupations (7.0%); education, training, and library occupations (6.0%); legal occupations (4.3%)
Roads and streets: NE 152nd Ave; NE 76th Cir.
Birch Tree Cove neighborhood detailed profile
Area: 0.011 square miles
Population: 6
Population density:
| Birch Tree Cove: | 561 people per square mile |
| Vancouver: | 4,491 people per square mile |
Median household income in 2021:
| Birch Tree Cove: | $95,230 |
| Vancouver: | $69,993 |
Median rent in in 2021:
| Birch Tree Cove: | $1,750 |
| Vancouver: | $1,311 |
Male vs Females
| Males: | 3 |
| Females: | 3 |
Median age
| Males: | 29.1 years |
| Females: | 32.9 years |
Most popular occupations of males: sales and office occupations (17.3%); service occupations (12.7%); management occupations (except farmers) (12.1%); education, training, and library occupations (9.5%); production occupations (9.0%); construction, extraction, and maintenance occupations (8.1%); material moving occupations (8.0%)
Most popular occupations of females: sales and office occupations (38.6%); service occupations (17.7%); management occupations (except farmers) (12.0%); healthcare practitioners and technical occupations (7.3%); transportation occupations (7.0%); education, training, and library occupations (6.0%); legal occupations (4.3%)
Roads and streets: NE 152nd Ave; NE 76th Cir.
Birch Tree Cove neighborhood detailed profile
Birchwood Meadows neighborhood in Vancouver statistics: (Find on map)
Area: 0.027 square miles
Roads and streets: NE 164th Ave; NE 25th St; NE 24th St; NE 163rd Ct; NE 163rd Ave; NE 164th Pl.
Birchwood Meadows neighborhood detailed profile
Area: 0.027 square miles
Roads and streets: NE 164th Ave; NE 25th St; NE 24th St; NE 163rd Ct; NE 163rd Ave; NE 164th Pl.
Birchwood Meadows neighborhood detailed profile
Blakesfield neighborhood in Vancouver statistics: (Find on map)
Area: 0.014 square miles
Population: 34
Population density:
Median household income in 2021:
Median rent in in 2021:
Male vs Females
Median age
Housing prices:
Average estimated value of detached houses in 2021 (53.3% of all units):
Average estimated value of townhouses or other attached units in 2021 (6.7% of all units):
Most popular occupations of males: sales and office occupations (29.8%); production occupations (27.8%); service occupations (25.7%); management occupations (except farmers) (12.5%); arts, design, entertainment, sports, and media occupations (10.2%); construction, extraction, and maintenance occupations (9.0%); business and financial operations occupations (7.6%)
Most popular occupations of females: service occupations (43.1%); sales and office occupations (40.6%); management occupations (except farmers) (11.7%); education, training, and library occupations (10.6%); arts, design, entertainment, sports, and media occupations (9.2%); material moving occupations (5.6%); production occupations (2.5%)
Roads and streets: NE 26th St; NE 27th St; NE 99th Ave; NE 101st Ave.
Blakesfield neighborhood detailed profile
Area: 0.014 square miles
Population: 34
Population density:
| Blakesfield: | 2,486 people per square mile |
| Vancouver: | 4,491 people per square mile |
Median household income in 2021:
| Blakesfield: | $54,342 |
| Vancouver: | $69,993 |
Median rent in in 2021:
| Blakesfield: | $1,239 |
| Vancouver: | $1,311 |
Male vs Females
| Males: | 18 |
| Females: | 16 |
Median age
| Males: | 39.6 years |
| Females: | 40.4 years |
Housing prices:
Average estimated value of detached houses in 2021 (53.3% of all units):
| Blakesfield: | $314,440 |
| Vancouver: | $457,784 |
Average estimated value of townhouses or other attached units in 2021 (6.7% of all units):
| This neighborhood: | $275,769 |
| city: | $310,311 |
Most popular occupations of males: sales and office occupations (29.8%); production occupations (27.8%); service occupations (25.7%); management occupations (except farmers) (12.5%); arts, design, entertainment, sports, and media occupations (10.2%); construction, extraction, and maintenance occupations (9.0%); business and financial operations occupations (7.6%)
Most popular occupations of females: service occupations (43.1%); sales and office occupations (40.6%); management occupations (except farmers) (11.7%); education, training, and library occupations (10.6%); arts, design, entertainment, sports, and media occupations (9.2%); material moving occupations (5.6%); production occupations (2.5%)
Roads and streets: NE 26th St; NE 27th St; NE 99th Ave; NE 101st Ave.
Blakesfield neighborhood detailed profile
Blandford Terrace neighborhood in Vancouver statistics: (Find on map)
Area: 0.002 square miles
Population: 9
Population density:
Median household income in 2021:
Median rent in in 2021:
Male vs Females
Median age
Housing prices:
Average estimated value of detached houses in 2021 (80.0% of all units):
Most popular occupations of males: business and financial operations occupations (19.2%); construction, extraction, and maintenance occupations (16.0%); sales and office occupations (12.9%); transportation occupations (10.0%); material moving occupations (7.1%); management occupations (except farmers) (6.7%); computer and mathematical occupations (6.5%)
Most popular occupations of females: sales and office occupations (47.3%); service occupations (11.4%); healthcare practitioners and technical occupations (10.7%); arts, design, entertainment, sports, and media occupations (8.8%); management occupations (except farmers) (8.4%); business and financial operations occupations (4.4%); life, physical, and social science occupations (3.5%)
Blandford Terrace neighborhood detailed profile
Area: 0.002 square miles
Population: 9
Population density:
| Blandford Terrace: | 4,830 people per square mile |
| Vancouver: | 4,491 people per square mile |
Median household income in 2021:
| Blandford Terrace: | $63,571 |
| Vancouver: | $69,993 |
Median rent in in 2021:
| Blandford Terrace: | $1,160 |
| Vancouver: | $1,311 |
Male vs Females
| Males: | 4 |
| Females: | 5 |
Median age
| Males: | 46.6 years |
| Females: | 52.5 years |
Housing prices:
Average estimated value of detached houses in 2021 (80.0% of all units):
| Blandford Terrace: | $502,469 |
| Vancouver: | $457,784 |
Most popular occupations of males: business and financial operations occupations (19.2%); construction, extraction, and maintenance occupations (16.0%); sales and office occupations (12.9%); transportation occupations (10.0%); material moving occupations (7.1%); management occupations (except farmers) (6.7%); computer and mathematical occupations (6.5%)
Most popular occupations of females: sales and office occupations (47.3%); service occupations (11.4%); healthcare practitioners and technical occupations (10.7%); arts, design, entertainment, sports, and media occupations (8.8%); management occupations (except farmers) (8.4%); business and financial operations occupations (4.4%); life, physical, and social science occupations (3.5%)
Blandford Terrace neighborhood detailed profile
Blossomwood Farm neighborhood in Vancouver statistics: (Find on map)
Area: 0.010 square miles
Population: 13
Population density:
Median household income in 2021:
Median rent in in 2021:
Male vs Females
Median age
Average estimated value of detached houses in 2021 (80.0% of all units):
Most popular occupations of males: production occupations (21.2%); management occupations (except farmers) (17.2%); service occupations (12.5%); sales and office occupations (11.1%); transportation occupations (8.2%); construction, extraction, and maintenance occupations (6.6%); computer and mathematical occupations (2.9%)
Most popular occupations of females: sales and office occupations (50.6%); management occupations (except farmers) (40.5%); service occupations (15.7%); production occupations (11.5%); business and financial operations occupations (9.6%); life, physical, and social science occupations (8.4%); healthcare practitioners and technical occupations (8.4%)
Blossomwood Farm neighborhood detailed profile
Area: 0.010 square miles
Population: 13
Population density:
| Blossomwood Farm: | 1,280 people per square mile |
| Vancouver: | 4,491 people per square mile |
Median household income in 2021:
| Blossomwood Farm: | $102,167 |
| Vancouver: | $69,993 |
Median rent in in 2021:
| Blossomwood Farm: | $1,505 |
| Vancouver: | $1,311 |
Male vs Females
| Males: | 9 |
| Females: | 4 |
Median age
| Males: | 35.7 years |
| Females: | 59.7 years |
Average estimated value of detached houses in 2021 (80.0% of all units):
| Blossomwood Farm: | $309,967 |
| Vancouver: | $457,784 |
Most popular occupations of males: production occupations (21.2%); management occupations (except farmers) (17.2%); service occupations (12.5%); sales and office occupations (11.1%); transportation occupations (8.2%); construction, extraction, and maintenance occupations (6.6%); computer and mathematical occupations (2.9%)
Most popular occupations of females: sales and office occupations (50.6%); management occupations (except farmers) (40.5%); service occupations (15.7%); production occupations (11.5%); business and financial operations occupations (9.6%); life, physical, and social science occupations (8.4%); healthcare practitioners and technical occupations (8.4%)
Blossomwood Farm neighborhood detailed profile
Blue Heron Estates neighborhood in Vancouver statistics: (Find on map)
Area: 0.010 square miles
Population: 52
Population density:
Median household income in 2021:
Median rent in in 2021:
Male vs Females
Median age
Average estimated value of detached houses in 2021 (100.0% of all units):
Most popular occupations of males: construction, extraction, and maintenance occupations (38.2%); management occupations (except farmers) (15.1%); computer and mathematical occupations (12.8%); sales and office occupations (10.8%); business and financial operations occupations (4.8%); architecture and engineering occupations (4.5%); service occupations (3.0%)
Most popular occupations of females: sales and office occupations (56.5%); management occupations (except farmers) (17.7%); service occupations (9.7%); business and financial operations occupations (5.1%); healthcare practitioners and technical occupations (4.2%); computer and mathematical occupations (3.4%); education, training, and library occupations (3.4%)
Blue Heron Estates neighborhood detailed profile
Area: 0.010 square miles
Population: 52
Population density:
| Blue Heron Estates: | 5,184 people per square mile |
| Vancouver: | 4,491 people per square mile |
Median household income in 2021:
| Blue Heron Estates: | $127,902 |
| Vancouver: | $69,993 |
Median rent in in 2021:
| Blue Heron Estates: | $1,677 |
| Vancouver: | $1,311 |
Male vs Females
| Males: | 27 |
| Females: | 24 |
Median age
| Males: | 38.7 years |
| Females: | 43.2 years |
Average estimated value of detached houses in 2021 (100.0% of all units):
| Blue Heron Estates: | $556,365 |
| Vancouver: | $457,784 |
Most popular occupations of males: construction, extraction, and maintenance occupations (38.2%); management occupations (except farmers) (15.1%); computer and mathematical occupations (12.8%); sales and office occupations (10.8%); business and financial operations occupations (4.8%); architecture and engineering occupations (4.5%); service occupations (3.0%)
Most popular occupations of females: sales and office occupations (56.5%); management occupations (except farmers) (17.7%); service occupations (9.7%); business and financial operations occupations (5.1%); healthcare practitioners and technical occupations (4.2%); computer and mathematical occupations (3.4%); education, training, and library occupations (3.4%)
Blue Heron Estates neighborhood detailed profile
Blueberry Hill neighborhood in Vancouver statistics: (Find on map)
Area: 0.071 square miles
Population: 241
Population density:
Median household income in 2021:
Median rent in in 2021:
Male vs Females
Median age
Average estimated value of detached houses in 2021 (75.0% of all units):
Most popular occupations of males: production occupations (15.7%); sales and office occupations (15.2%); management occupations (except farmers) (13.5%); service occupations (13.1%); construction, extraction, and maintenance occupations (7.4%); transportation occupations (5.8%); material moving occupations (5.7%)
Most popular occupations of females: sales and office occupations (40.3%); service occupations (18.0%); business and financial operations occupations (8.7%); education, training, and library occupations (8.7%); healthcare practitioners and technical occupations (8.4%); management occupations (except farmers) (4.4%); community and social services occupations (4.0%)
Roads and streets: NE 26th Ave; NE 113th St; NE 116th St; NE 114th St; NE 27th Ave; NE 29th Ave; NE 109th St; NE 115th St; NE 111th St; NE 28th Ave; NW 111th St.
Blueberry Hill neighborhood detailed profile
Area: 0.071 square miles
Population: 241
Population density:
| Blueberry Hill: | 3,399 people per square mile |
| Vancouver: | 4,491 people per square mile |
Median household income in 2021:
| Blueberry Hill: | $72,465 |
| Vancouver: | $69,993 |
Median rent in in 2021:
| Blueberry Hill: | $1,137 |
| Vancouver: | $1,311 |
Male vs Females
| Males: | 114 |
| Females: | 127 |
Median age
| Males: | 42.4 years |
| Females: | 40.4 years |
Average estimated value of detached houses in 2021 (75.0% of all units):
| Blueberry Hill: | $378,871 |
| Vancouver: | $457,784 |
Most popular occupations of males: production occupations (15.7%); sales and office occupations (15.2%); management occupations (except farmers) (13.5%); service occupations (13.1%); construction, extraction, and maintenance occupations (7.4%); transportation occupations (5.8%); material moving occupations (5.7%)
Most popular occupations of females: sales and office occupations (40.3%); service occupations (18.0%); business and financial operations occupations (8.7%); education, training, and library occupations (8.7%); healthcare practitioners and technical occupations (8.4%); management occupations (except farmers) (4.4%); community and social services occupations (4.0%)
Roads and streets: NE 26th Ave; NE 113th St; NE 116th St; NE 114th St; NE 27th Ave; NE 29th Ave; NE 109th St; NE 115th St; NE 111th St; NE 28th Ave; NW 111th St.
Blueberry Hill neighborhood detailed profile
Blueberry Homes neighborhood in Vancouver statistics: (Find on map)
Area: 0.005 square miles
Population: 6
Population density:
Median household income in 2021:
Median rent in in 2021:
Male vs Females
Median age
Average estimated value of detached houses in 2021 (100.0% of all units):
Most popular occupations of males: production occupations (21.2%); management occupations (except farmers) (17.2%); service occupations (12.5%); sales and office occupations (11.1%); transportation occupations (8.2%); construction, extraction, and maintenance occupations (6.6%); computer and mathematical occupations (2.9%)
Most popular occupations of females: sales and office occupations (50.6%); management occupations (except farmers) (40.3%); service occupations (15.7%); production occupations (11.4%); business and financial operations occupations (9.6%); life, physical, and social science occupations (8.4%); healthcare practitioners and technical occupations (8.4%)
Roads and streets: NE 59th Cir.
Blueberry Homes neighborhood detailed profile
Area: 0.005 square miles
Population: 6
Population density:
| Blueberry Homes: | 1,289 people per square mile |
| Vancouver: | 4,491 people per square mile |
Median household income in 2021:
| Blueberry Homes: | $102,167 |
| Vancouver: | $69,993 |
Median rent in in 2021:
| Blueberry Homes: | $1,505 |
| Vancouver: | $1,311 |
Male vs Females
| Males: | 4 |
| Females: | 2 |
Median age
| Males: | 35.7 years |
| Females: | 59.7 years |
Average estimated value of detached houses in 2021 (100.0% of all units):
| Blueberry Homes: | $309,967 |
| Vancouver: | $457,784 |
Most popular occupations of males: production occupations (21.2%); management occupations (except farmers) (17.2%); service occupations (12.5%); sales and office occupations (11.1%); transportation occupations (8.2%); construction, extraction, and maintenance occupations (6.6%); computer and mathematical occupations (2.9%)
Most popular occupations of females: sales and office occupations (50.6%); management occupations (except farmers) (40.3%); service occupations (15.7%); production occupations (11.4%); business and financial operations occupations (9.6%); life, physical, and social science occupations (8.4%); healthcare practitioners and technical occupations (8.4%)
Roads and streets: NE 59th Cir.
Blueberry Homes neighborhood detailed profile
Blurock Homestead neighborhood in Vancouver statistics: (Find on map)
Area: 0.064 square miles
Roads and streets: E 2nd St; E 3rd Loop; N V St; N X St (X St).
Blurock Homestead neighborhood detailed profile
Area: 0.064 square miles
Roads and streets: E 2nd St; E 3rd Loop; N V St; N X St (X St).
Blurock Homestead neighborhood detailed profile
Boardwalk Garden Homes neighborhood in Vancouver statistics: (Find on map)
Area: 0.003 square miles
Population: 7
Population density:
Median household income in 2021:
Median rent in in 2021:
Male vs Females
Median age
Most popular occupations of males: management occupations (except farmers) (33.5%); construction, extraction, and maintenance occupations (24.4%); transportation occupations (16.3%); production occupations (15.9%); service occupations (14.0%); architecture and engineering occupations (12.6%); material moving occupations (12.6%)
Most popular occupations of females: sales and office occupations (44.1%); management occupations (except farmers) (19.4%); healthcare practitioners and technical occupations (15.8%); transportation occupations (6.6%); arts, design, entertainment, sports, and media occupations (5.9%); architecture and engineering occupations (4.4%); service occupations (4.3%)
Boardwalk Garden Homes neighborhood detailed profile
Area: 0.003 square miles
Population: 7
Population density:
| Boardwalk Garden Homes: | 2,212 people per square mile |
| Vancouver: | 4,491 people per square mile |
Median household income in 2021:
| Boardwalk Garden Homes: | $98,986 |
| Vancouver: | $69,993 |
Median rent in in 2021:
| Boardwalk Garden Homes: | $1,570 |
| Vancouver: | $1,311 |
Male vs Females
| Males: | 4 |
| Females: | 3 |
Median age
| Males: | 41.5 years |
| Females: | 41.8 years |
Most popular occupations of males: management occupations (except farmers) (33.5%); construction, extraction, and maintenance occupations (24.4%); transportation occupations (16.3%); production occupations (15.9%); service occupations (14.0%); architecture and engineering occupations (12.6%); material moving occupations (12.6%)
Most popular occupations of females: sales and office occupations (44.1%); management occupations (except farmers) (19.4%); healthcare practitioners and technical occupations (15.8%); transportation occupations (6.6%); arts, design, entertainment, sports, and media occupations (5.9%); architecture and engineering occupations (4.4%); service occupations (4.3%)
Boardwalk Garden Homes neighborhood detailed profile
Bold Estates neighborhood in Vancouver statistics: (Find on map)
Area: 0.013 square miles
Roads and streets: NE 51st Way; NE 52nd St; NE 77th Ave; NE 75th Ave; NE 76th Ave.
Bold Estates neighborhood detailed profile
Area: 0.013 square miles
Roads and streets: NE 51st Way; NE 52nd St; NE 77th Ave; NE 75th Ave; NE 76th Ave.
Bold Estates neighborhood detailed profile
Bonnies Vista neighborhood in Vancouver statistics: (Find on map)
Area: 0.026 square miles
Population: 51
Population density:
Median household income in 2021:
Median rent in in 2021:
Male vs Females
Median age
Average estimated value of detached houses in 2021 (100.0% of all units):
Most popular occupations of males: service occupations (15.2%); management occupations (except farmers) (14.6%); sales and office occupations (12.7%); architecture and engineering occupations (8.1%); production occupations (7.4%); education, training, and library occupations (7.0%); construction, extraction, and maintenance occupations (6.5%)
Most popular occupations of females: sales and office occupations (33.8%); business and financial operations occupations (26.1%); service occupations (13.0%); education, training, and library occupations (10.7%); healthcare practitioners and technical occupations (6.4%); arts, design, entertainment, sports, and media occupations (5.0%); community and social services occupations (3.0%)
Roads and streets: NE 43rd Ave; NE 41st Ave; NE Bonnie Dr; NE 103rd St; NE 41st Ct.
Bonnies Vista neighborhood detailed profile
Area: 0.026 square miles
Population: 51
Population density:
| Bonnies Vista: | 1,987 people per square mile |
| Vancouver: | 4,491 people per square mile |
Median household income in 2021:
| Bonnies Vista: | $97,031 |
| Vancouver: | $69,993 |
Median rent in in 2021:
| Bonnies Vista: | $1,734 |
| Vancouver: | $1,311 |
Male vs Females
| Males: | 26 |
| Females: | 25 |
Median age
| Males: | 38.6 years |
| Females: | 49.9 years |
Average estimated value of detached houses in 2021 (100.0% of all units):
| Bonnies Vista: | $421,431 |
| Vancouver: | $457,784 |
Most popular occupations of males: service occupations (15.2%); management occupations (except farmers) (14.6%); sales and office occupations (12.7%); architecture and engineering occupations (8.1%); production occupations (7.4%); education, training, and library occupations (7.0%); construction, extraction, and maintenance occupations (6.5%)
Most popular occupations of females: sales and office occupations (33.8%); business and financial operations occupations (26.1%); service occupations (13.0%); education, training, and library occupations (10.7%); healthcare practitioners and technical occupations (6.4%); arts, design, entertainment, sports, and media occupations (5.0%); community and social services occupations (3.0%)
Roads and streets: NE 43rd Ave; NE 41st Ave; NE Bonnie Dr; NE 103rd St; NE 41st Ct.
Bonnies Vista neighborhood detailed profile
Bradleys Place neighborhood in Vancouver statistics: (Find on map)
Area: 0.005 square miles
Population: 29
Population density:
Median household income in 2021:
Median rent in in 2021:
Male vs Females
Median age
Most popular occupations of males: sales and office occupations (30.4%); production occupations (24.1%); material moving occupations (16.0%); architecture and engineering occupations (12.5%); education, training, and library occupations (10.8%); service occupations (10.5%); transportation occupations (7.2%)
Most popular occupations of females: service occupations (33.7%); sales and office occupations (25.5%); arts, design, entertainment, sports, and media occupations (20.7%); business and financial operations occupations (5.2%); healthcare practitioners and technical occupations (4.2%); management occupations (except farmers) (2.2%); education, training, and library occupations (2.0%)
Bradleys Place neighborhood detailed profile
Area: 0.005 square miles
Population: 29
Population density:
| Bradleys Place: | 5,930 people per square mile |
| Vancouver: | 4,491 people per square mile |
Median household income in 2021:
| Bradleys Place: | $72,143 |
| Vancouver: | $69,993 |
Median rent in in 2021:
| Bradleys Place: | $1,264 |
| Vancouver: | $1,311 |
Male vs Females
| Males: | 11 |
| Females: | 18 |
Median age
| Males: | 30.6 years |
| Females: | 28.3 years |
Most popular occupations of males: sales and office occupations (30.4%); production occupations (24.1%); material moving occupations (16.0%); architecture and engineering occupations (12.5%); education, training, and library occupations (10.8%); service occupations (10.5%); transportation occupations (7.2%)
Most popular occupations of females: service occupations (33.7%); sales and office occupations (25.5%); arts, design, entertainment, sports, and media occupations (20.7%); business and financial operations occupations (5.2%); healthcare practitioners and technical occupations (4.2%); management occupations (except farmers) (2.2%); education, training, and library occupations (2.0%)
Bradleys Place neighborhood detailed profile
Braewood neighborhood in Vancouver statistics: (Find on map)
Area: 0.082 square miles
Population: 158
Population density:
Median household income in 2021:
Median rent in in 2021:
Male vs Females
Median age
Housing prices:
Average estimated value of detached houses in 2021 (89.9% of all units):
Average estimated value of housing units in 2-unit structures in 2021 (5.1% of all units):
Most popular occupations of males: transportation occupations (20.9%); business and financial operations occupations (15.8%); management occupations (except farmers) (12.8%); production occupations (10.4%); construction, extraction, and maintenance occupations (8.7%); material moving occupations (6.6%); architecture and engineering occupations (6.0%)
Most popular occupations of females: education, training, and library occupations (33.1%); management occupations (except farmers) (20.1%); business and financial operations occupations (16.4%); sales and office occupations (14.5%); arts, design, entertainment, sports, and media occupations (7.1%); healthcare practitioners and technical occupations (6.7%); legal occupations (3.3%)
Roads and streets: Dubois Dr (du Bois Dr); Pasadena Way; California St; Monterey Way; Tucson Way; Phoenix Way; S Santa Fe Ct; du Bois Ct (Dubois Ct); Arizona Dr.
Braewood neighborhood detailed profile
Area: 0.082 square miles
Population: 158
Population density:
| Braewood: | 1,924 people per square mile |
| Vancouver: | 4,491 people per square mile |
Median household income in 2021:
| Braewood: | $104,464 |
| Vancouver: | $69,993 |
Median rent in in 2021:
| Braewood: | $1,301 |
| Vancouver: | $1,311 |
Male vs Females
| Males: | 85 |
| Females: | 72 |
Median age
| Males: | 48.4 years |
| Females: | 53.5 years |
Housing prices:
Average estimated value of detached houses in 2021 (89.9% of all units):
| Braewood: | $521,841 |
| Vancouver: | $457,784 |
Average estimated value of housing units in 2-unit structures in 2021 (5.1% of all units):
| This neighborhood: | $137,271 |
| Vancouver: | $1,909,132 |
Most popular occupations of males: transportation occupations (20.9%); business and financial operations occupations (15.8%); management occupations (except farmers) (12.8%); production occupations (10.4%); construction, extraction, and maintenance occupations (8.7%); material moving occupations (6.6%); architecture and engineering occupations (6.0%)
Most popular occupations of females: education, training, and library occupations (33.1%); management occupations (except farmers) (20.1%); business and financial operations occupations (16.4%); sales and office occupations (14.5%); arts, design, entertainment, sports, and media occupations (7.1%); healthcare practitioners and technical occupations (6.7%); legal occupations (3.3%)
Roads and streets: Dubois Dr (du Bois Dr); Pasadena Way; California St; Monterey Way; Tucson Way; Phoenix Way; S Santa Fe Ct; du Bois Ct (Dubois Ct); Arizona Dr.
Braewood neighborhood detailed profile
Brandt Terrace neighborhood in Vancouver statistics: (Find on map)
Area: 0.010 square miles
Population: 63
Population density:
Median household income in 2021:
Median rent in in 2021:
Male vs Females
Median age
Housing prices:
Average estimated value of detached houses in 2021 (16.7% of all units):
Average estimated value of mobile home in 2021 (4.2% of all units):
Most popular occupations of males: production occupations (22.5%); sales and office occupations (17.7%); management occupations (except farmers) (16.5%); construction, extraction, and maintenance occupations (14.4%); service occupations (12.9%); material moving occupations (5.0%); architecture and engineering occupations (2.7%)
Most popular occupations of females: service occupations (31.9%); sales and office occupations (30.4%); material moving occupations (11.4%); management occupations (except farmers) (7.6%); education, training, and library occupations (7.6%); community and social services occupations (4.5%); business and financial operations occupations (4.2%)
Brandt Terrace neighborhood detailed profile
Area: 0.010 square miles
Population: 63
Population density:
| Brandt Terrace: | 6,629 people per square mile |
| Vancouver: | 4,491 people per square mile |
Median household income in 2021:
| Brandt Terrace: | $46,351 |
| Vancouver: | $69,993 |
Median rent in in 2021:
| Brandt Terrace: | $896 |
| Vancouver: | $1,311 |
Male vs Females
| Males: | 29 |
| Females: | 34 |
Median age
| Males: | 27.9 years |
| Females: | 26.4 years |
Housing prices:
Average estimated value of detached houses in 2021 (16.7% of all units):
| Brandt Terrace: | $218,182 |
| Vancouver: | $457,784 |
Average estimated value of mobile home in 2021 (4.2% of all units):
| Brandt Terrace: | $40,000 |
| Vancouver: | $109,677 |
Most popular occupations of males: production occupations (22.5%); sales and office occupations (17.7%); management occupations (except farmers) (16.5%); construction, extraction, and maintenance occupations (14.4%); service occupations (12.9%); material moving occupations (5.0%); architecture and engineering occupations (2.7%)
Most popular occupations of females: service occupations (31.9%); sales and office occupations (30.4%); material moving occupations (11.4%); management occupations (except farmers) (7.6%); education, training, and library occupations (7.6%); community and social services occupations (4.5%); business and financial operations occupations (4.2%)
Brandt Terrace neighborhood detailed profile
Brekke Farms neighborhood in Vancouver statistics: (Find on map)
Area: 0.004 square miles
Population: 4
Population density:
Median household income in 2021:
Median rent in in 2021:
Male vs Females
Median age
Average estimated value of detached houses in 2021 (50.0% of all units):
Most popular occupations of males: production occupations (21.2%); management occupations (except farmers) (17.2%); service occupations (12.5%); sales and office occupations (11.1%); transportation occupations (8.2%); construction, extraction, and maintenance occupations (6.6%); computer and mathematical occupations (2.9%)
Most popular occupations of females: sales and office occupations (50.6%); management occupations (except farmers) (40.7%); service occupations (15.7%); production occupations (11.5%); business and financial operations occupations (9.6%); life, physical, and social science occupations (8.4%); healthcare practitioners and technical occupations (8.4%)
Brekke Farms neighborhood detailed profile
Area: 0.004 square miles
Population: 4
Population density:
| Brekke Farms: | 1,064 people per square mile |
| Vancouver: | 4,491 people per square mile |
Median household income in 2021:
| Brekke Farms: | $102,167 |
| Vancouver: | $69,993 |
Median rent in in 2021:
| Brekke Farms: | $1,505 |
| Vancouver: | $1,311 |
Male vs Females
| Males: | 3 |
| Females: | 1 |
Median age
| Males: | 35.7 years |
| Females: | 59.7 years |
Average estimated value of detached houses in 2021 (50.0% of all units):
| Brekke Farms: | $309,967 |
| Vancouver: | $457,784 |
Most popular occupations of males: production occupations (21.2%); management occupations (except farmers) (17.2%); service occupations (12.5%); sales and office occupations (11.1%); transportation occupations (8.2%); construction, extraction, and maintenance occupations (6.6%); computer and mathematical occupations (2.9%)
Most popular occupations of females: sales and office occupations (50.6%); management occupations (except farmers) (40.7%); service occupations (15.7%); production occupations (11.5%); business and financial operations occupations (9.6%); life, physical, and social science occupations (8.4%); healthcare practitioners and technical occupations (8.4%)
Brekke Farms neighborhood detailed profile
Brentwood neighborhood in Vancouver statistics: (Find on map)
Area: 0.019 square miles
Population: 64
Population density:
Median household income in 2021:
Median rent in in 2021:
Male vs Females
Median age
Housing prices:
Average estimated value of detached houses in 2021 (88.9% of all units):
Most popular occupations of males: management occupations (except farmers) (16.3%); sales and office occupations (16.3%); construction, extraction, and maintenance occupations (13.7%); transportation occupations (12.2%); computer and mathematical occupations (10.7%); education, training, and library occupations (7.5%); production occupations (5.8%)
Most popular occupations of females: sales and office occupations (45.3%); service occupations (23.2%); management occupations (except farmers) (9.4%); production occupations (7.6%); education, training, and library occupations (7.2%); healthcare practitioners and technical occupations (3.5%); material moving occupations (3.2%)
Roads and streets: NE 101st Ave.
Brentwood neighborhood detailed profile
Area: 0.019 square miles
Population: 64
Population density:
| Brentwood: | 3,317 people per square mile |
| Vancouver: | 4,491 people per square mile |
Median household income in 2021:
| Brentwood: | $85,327 |
| Vancouver: | $69,993 |
Median rent in in 2021:
| Brentwood: | $1,432 |
| Vancouver: | $1,311 |
Male vs Females
| Males: | 32 |
| Females: | 31 |
Median age
| Males: | 34.2 years |
| Females: | 34.8 years |
Housing prices:
Average estimated value of detached houses in 2021 (88.9% of all units):
| Brentwood: | $327,562 |
| Vancouver: | $457,784 |
Most popular occupations of males: management occupations (except farmers) (16.3%); sales and office occupations (16.3%); construction, extraction, and maintenance occupations (13.7%); transportation occupations (12.2%); computer and mathematical occupations (10.7%); education, training, and library occupations (7.5%); production occupations (5.8%)
Most popular occupations of females: sales and office occupations (45.3%); service occupations (23.2%); management occupations (except farmers) (9.4%); production occupations (7.6%); education, training, and library occupations (7.2%); healthcare practitioners and technical occupations (3.5%); material moving occupations (3.2%)
Roads and streets: NE 101st Ave.
Brentwood neighborhood detailed profile
Brentwood South neighborhood in Vancouver statistics: (Find on map)
Area: 0.022 square miles
Population: 75
Population density:
Median household income in 2021:
Median rent in in 2021:
Male vs Females
Median age
Housing prices:
Average estimated value of detached houses in 2021 (61.1% of all units):
Average estimated value of mobile home in 2021 (8.3% of all units):
Most popular occupations of males: construction, extraction, and maintenance occupations (45.5%); service occupations (19.5%); sales and office occupations (14.3%); material moving occupations (12.6%); business and financial operations occupations (11.0%); management occupations (except farmers) (10.0%); transportation occupations (8.7%)
Most popular occupations of females: sales and office occupations (57.1%); service occupations (31.9%); business and financial operations occupations (12.5%); management occupations (except farmers) (7.6%); education, training, and library occupations (7.1%); production occupations (7.1%); transportation occupations (7.1%)
Roads and streets: NE 75th St; NE 74th St; NE 100th Ave; NE 101st Ave.
Brentwood South neighborhood detailed profile
Area: 0.022 square miles
Population: 75
Population density:
| Brentwood South: | 3,463 people per square mile |
| Vancouver: | 4,491 people per square mile |
Median household income in 2021:
| Brentwood South: | $60,670 |
| Vancouver: | $69,993 |
Median rent in in 2021:
| Brentwood South: | $1,689 |
| Vancouver: | $1,311 |
Male vs Females
| Males: | 25 |
| Females: | 49 |
Median age
| Males: | 57.4 years |
| Females: | 36.6 years |
Housing prices:
Average estimated value of detached houses in 2021 (61.1% of all units):
| Brentwood South: | $301,807 |
| Vancouver: | $457,784 |
Average estimated value of mobile home in 2021 (8.3% of all units):
| Brentwood South: | $130,345 |
| Vancouver: | $109,677 |
Most popular occupations of males: construction, extraction, and maintenance occupations (45.5%); service occupations (19.5%); sales and office occupations (14.3%); material moving occupations (12.6%); business and financial operations occupations (11.0%); management occupations (except farmers) (10.0%); transportation occupations (8.7%)
Most popular occupations of females: sales and office occupations (57.1%); service occupations (31.9%); business and financial operations occupations (12.5%); management occupations (except farmers) (7.6%); education, training, and library occupations (7.1%); production occupations (7.1%); transportation occupations (7.1%)
Roads and streets: NE 75th St; NE 74th St; NE 100th Ave; NE 101st Ave.
Brentwood South neighborhood detailed profile
Brentwood West neighborhood in Vancouver statistics: (Find on map)
Area: 0.062 square miles
Population: 348
Population density:
Median household income in 2021:
Median rent in in 2021:
Male vs Females
Median age
Most popular occupations of males: production occupations (22.6%); construction, extraction, and maintenance occupations (13.6%); management occupations (except farmers) (8.8%); community and social services occupations (8.4%); sales and office occupations (6.4%); computer and mathematical occupations (5.5%); farming, fishing, and forestry occupations (5.1%)
Most popular occupations of females: service occupations (33.2%); management occupations (except farmers) (28.5%); sales and office occupations (26.7%); healthcare practitioners and technical occupations (13.9%); business and financial operations occupations (7.9%); legal occupations (4.3%); transportation occupations (4.3%)
Roads and streets: NE 75th St; NE 74th St; NE 73rd St; NE 69th Ave; NE 67th Ave; NE 72nd Ave; NE 66th Ave; NE 63rd Ave; NE 62nd Ave; NE 64th Ct; NE 70th Ct.
Brentwood West neighborhood detailed profile
Area: 0.062 square miles
Population: 348
Population density:
| Brentwood West: | 5,602 people per square mile |
| Vancouver: | 4,491 people per square mile |
Median household income in 2021:
| Brentwood West: | $58,650 |
| Vancouver: | $69,993 |
Median rent in in 2021:
| Brentwood West: | $1,070 |
| Vancouver: | $1,311 |
Male vs Females
| Males: | 165 |
| Females: | 183 |
Median age
| Males: | 41.2 years |
| Females: | 33.7 years |
Most popular occupations of males: production occupations (22.6%); construction, extraction, and maintenance occupations (13.6%); management occupations (except farmers) (8.8%); community and social services occupations (8.4%); sales and office occupations (6.4%); computer and mathematical occupations (5.5%); farming, fishing, and forestry occupations (5.1%)
Most popular occupations of females: service occupations (33.2%); management occupations (except farmers) (28.5%); sales and office occupations (26.7%); healthcare practitioners and technical occupations (13.9%); business and financial operations occupations (7.9%); legal occupations (4.3%); transportation occupations (4.3%)
Roads and streets: NE 75th St; NE 74th St; NE 73rd St; NE 69th Ave; NE 67th Ave; NE 72nd Ave; NE 66th Ave; NE 63rd Ave; NE 62nd Ave; NE 64th Ct; NE 70th Ct.
Brentwood West neighborhood detailed profile
Brett Acres neighborhood in Vancouver statistics: (Find on map)
Area: 0.005 square miles
Brett Acres neighborhood detailed profile
Area: 0.005 square miles
Brett Acres neighborhood detailed profile
Briarwood neighborhood in Vancouver statistics: (Find on map)
Area: 0.036 square miles
Population: 96
Population density:
Median household income in 2021:
Median rent in in 2021:
Male vs Females
Median age
Most popular occupations of males: management occupations (except farmers) (33.5%); construction, extraction, and maintenance occupations (24.9%); transportation occupations (16.3%); production occupations (16.2%); service occupations (14.0%); material moving occupations (12.9%); architecture and engineering occupations (12.6%)
Most popular occupations of females: sales and office occupations (44.1%); management occupations (except farmers) (19.4%); healthcare practitioners and technical occupations (15.8%); transportation occupations (6.7%); arts, design, entertainment, sports, and media occupations (5.9%); architecture and engineering occupations (4.4%); service occupations (4.3%)
Roads and streets: NE 12th St; NE 85th Ave; NE 86th Ave; NE 13th St; NE 87th Ave.
Briarwood neighborhood detailed profile
Area: 0.036 square miles
Population: 96
Population density:
| Briarwood: | 2,644 people per square mile |
| Vancouver: | 4,491 people per square mile |
Median household income in 2021:
| Briarwood: | $98,986 |
| Vancouver: | $69,993 |
Median rent in in 2021:
| Briarwood: | $1,570 |
| Vancouver: | $1,311 |
Male vs Females
| Males: | 52 |
| Females: | 44 |
Median age
| Males: | 41.5 years |
| Females: | 41.8 years |
Most popular occupations of males: management occupations (except farmers) (33.5%); construction, extraction, and maintenance occupations (24.9%); transportation occupations (16.3%); production occupations (16.2%); service occupations (14.0%); material moving occupations (12.9%); architecture and engineering occupations (12.6%)
Most popular occupations of females: sales and office occupations (44.1%); management occupations (except farmers) (19.4%); healthcare practitioners and technical occupations (15.8%); transportation occupations (6.7%); arts, design, entertainment, sports, and media occupations (5.9%); architecture and engineering occupations (4.4%); service occupations (4.3%)
Roads and streets: NE 12th St; NE 85th Ave; NE 86th Ave; NE 13th St; NE 87th Ave.
Briarwood neighborhood detailed profile
Brickhaven neighborhood in Vancouver statistics: (Find on map)
Area: 0.009 square miles
Roads and streets: NE 145th Ave.
Brickhaven neighborhood detailed profile
Area: 0.009 square miles
Roads and streets: NE 145th Ave.
Brickhaven neighborhood detailed profile
Bridge Creek Village neighborhood in Vancouver statistics: (Find on map)
Area: 0.009 square miles
Roads and streets: NE 62nd St; NE 138th Ave; NE 62nd Cir.
Bridge Creek Village neighborhood detailed profile
Area: 0.009 square miles
Roads and streets: NE 62nd St; NE 138th Ave; NE 62nd Cir.
Bridge Creek Village neighborhood detailed profile
Bridlewood neighborhood in Vancouver statistics: (Find on map)
Area: 0.013 square miles
Population: 9
Population density:
Median household income in 2021:
Median rent in in 2021:
Male vs Females
Median age
Housing prices:
Average estimated value of detached houses in 2021 (100.0% of all units):
Average estimated '21 value of housing units in 5-or-more-unit structures (25.0% of all units):
Most popular occupations of males: transportation occupations (60.9%); sales and office occupations (39.2%); architecture and engineering occupations (24.1%); management occupations (except farmers) (23.2%); production occupations (18.6%); construction, extraction, and maintenance occupations (13.7%); business and financial operations occupations (12.3%)
Most popular occupations of females: healthcare practitioners and technical occupations (39.3%); sales and office occupations (36.1%); service occupations (26.8%); management occupations (except farmers) (15.1%); business and financial operations occupations (14.2%); education, training, and library occupations (14.1%); transportation occupations (12.7%)
Roads and streets: NE 124th Ave; NE 123rd Ave; NE 63rd St.
Bridlewood neighborhood detailed profile
Area: 0.013 square miles
Population: 9
Population density:
| Bridlewood: | 703 people per square mile |
| Vancouver: | 4,491 people per square mile |
Median household income in 2021:
| Bridlewood: | $39,063 |
| Vancouver: | $69,993 |
Median rent in in 2021:
| Bridlewood: | $1,349 |
| Vancouver: | $1,311 |
Male vs Females
| Males: | 3 |
| Females: | 5 |
Median age
| Males: | 34.2 years |
| Females: | 38.7 years |
Housing prices:
Average estimated value of detached houses in 2021 (100.0% of all units):
| Bridlewood: | $324,749 |
| Vancouver: | $457,784 |
Average estimated '21 value of housing units in 5-or-more-unit structures (25.0% of all units):
| Bridlewood: | $156,699 |
| Vancouver: | $351,621 |
Most popular occupations of males: transportation occupations (60.9%); sales and office occupations (39.2%); architecture and engineering occupations (24.1%); management occupations (except farmers) (23.2%); production occupations (18.6%); construction, extraction, and maintenance occupations (13.7%); business and financial operations occupations (12.3%)
Most popular occupations of females: healthcare practitioners and technical occupations (39.3%); sales and office occupations (36.1%); service occupations (26.8%); management occupations (except farmers) (15.1%); business and financial operations occupations (14.2%); education, training, and library occupations (14.1%); transportation occupations (12.7%)
Roads and streets: NE 124th Ave; NE 123rd Ave; NE 63rd St.
Bridlewood neighborhood detailed profile
Brier Tree neighborhood in Vancouver statistics: (Find on map)
Area: 0.048 square miles
Roads and streets: NE 84th St; NE 85th St; NE 82nd St; NE 81st St; NE 143rd Ave; NE 145th Ave; NE 83rd St; NE 83rd Way; NE 86th Cir; NE 144th Ave; NE 147th Ave.
Brier Tree neighborhood detailed profile
Area: 0.048 square miles
Roads and streets: NE 84th St; NE 85th St; NE 82nd St; NE 81st St; NE 143rd Ave; NE 145th Ave; NE 83rd St; NE 83rd Way; NE 86th Cir; NE 144th Ave; NE 147th Ave.
Brier Tree neighborhood detailed profile
Brislawn neighborhood in Vancouver statistics: (Find on map)
Area: 0.008 square miles
Population: 57
Population density:
Median household income in 2021:
Median rent in in 2021:
Male vs Females
Median age
Most popular occupations of males: management occupations (except farmers) (26.9%); transportation occupations (18.1%); service occupations (16.8%); construction, extraction, and maintenance occupations (12.4%); business and financial operations occupations (6.4%); sales and office occupations (5.4%); computer and mathematical occupations (4.1%)
Most popular occupations of females: service occupations (38.1%); sales and office occupations (22.0%); healthcare practitioners and technical occupations (7.9%); business and financial operations occupations (5.4%); community and social services occupations (5.4%); education, training, and library occupations (5.0%); computer and mathematical occupations (4.2%)
Brislawn neighborhood detailed profile
Area: 0.008 square miles
Population: 57
Population density:
| Brislawn: | 7,545 people per square mile |
| Vancouver: | 4,491 people per square mile |
Median household income in 2021:
| Brislawn: | $77,279 |
| Vancouver: | $69,993 |
Median rent in in 2021:
| Brislawn: | $1,231 |
| Vancouver: | $1,311 |
Male vs Females
| Males: | 27 |
| Females: | 29 |
Median age
| Males: | 28.2 years |
| Females: | 29.1 years |
Most popular occupations of males: management occupations (except farmers) (26.9%); transportation occupations (18.1%); service occupations (16.8%); construction, extraction, and maintenance occupations (12.4%); business and financial operations occupations (6.4%); sales and office occupations (5.4%); computer and mathematical occupations (4.1%)
Most popular occupations of females: service occupations (38.1%); sales and office occupations (22.0%); healthcare practitioners and technical occupations (7.9%); business and financial operations occupations (5.4%); community and social services occupations (5.4%); education, training, and library occupations (5.0%); computer and mathematical occupations (4.2%)
Brislawn neighborhood detailed profile
Bristol Manor neighborhood in Vancouver statistics: (Find on map)
Area: 0.030 square miles
Population: 181
Population density:
Median household income in 2021:
Median rent in in 2021:
Male vs Females
Median age
Housing prices:
Average estimated value of detached houses in 2021 (67.2% of all units):
Average estimated value of mobile home in 2021 (29.3% of all units):
Most popular occupations of males: management occupations (except farmers) (29.3%); production occupations (13.6%); transportation occupations (11.4%); sales and office occupations (10.3%); construction, extraction, and maintenance occupations (10.1%); service occupations (6.0%); healthcare practitioners and technical occupations (5.0%)
Most popular occupations of females: service occupations (37.2%); sales and office occupations (33.0%); healthcare practitioners and technical occupations (11.9%); education, training, and library occupations (5.4%); management occupations (except farmers) (4.4%); community and social services occupations (3.5%); business and financial operations occupations (2.4%)
Roads and streets: NE 11th St; NE 12th St; NE 167th Ave; NE 13th Cir; NE 172nd Ave; NE 169th Ave; NE 171st Ct; NE 170th Ct (NE 70th Ct).
Bristol Manor neighborhood detailed profile
Area: 0.030 square miles
Population: 181
Population density:
| Bristol Manor: | 6,020 people per square mile |
| Vancouver: | 4,491 people per square mile |
Median household income in 2021:
| Bristol Manor: | $89,616 |
| Vancouver: | $69,993 |
Median rent in in 2021:
| Bristol Manor: | $1,863 |
| Vancouver: | $1,311 |
Male vs Females
| Males: | 90 |
| Females: | 90 |
Median age
| Males: | 41.1 years |
| Females: | 37.1 years |
Housing prices:
Average estimated value of detached houses in 2021 (67.2% of all units):
| Bristol Manor: | $388,629 |
| Vancouver: | $457,784 |
Average estimated value of mobile home in 2021 (29.3% of all units):
| Bristol Manor: | $107,134 |
| Vancouver: | $109,677 |
Most popular occupations of males: management occupations (except farmers) (29.3%); production occupations (13.6%); transportation occupations (11.4%); sales and office occupations (10.3%); construction, extraction, and maintenance occupations (10.1%); service occupations (6.0%); healthcare practitioners and technical occupations (5.0%)
Most popular occupations of females: service occupations (37.2%); sales and office occupations (33.0%); healthcare practitioners and technical occupations (11.9%); education, training, and library occupations (5.4%); management occupations (except farmers) (4.4%); community and social services occupations (3.5%); business and financial operations occupations (2.4%)
Roads and streets: NE 11th St; NE 12th St; NE 167th Ave; NE 13th Cir; NE 172nd Ave; NE 169th Ave; NE 171st Ct; NE 170th Ct (NE 70th Ct).
Bristol Manor neighborhood detailed profile
Brittany Court neighborhood in Vancouver statistics: (Find on map)
Area: 0.007 square miles
Roads and streets: NE 101st St; NE 121st Ct.
Brittany Court neighborhood detailed profile
Area: 0.007 square miles
Roads and streets: NE 101st St; NE 121st Ct.
Brittany Court neighborhood detailed profile
Broad Acres neighborhood in Vancouver statistics: (Find on map)
Area: 0.011 square miles
Roads and streets: NE 129th St.
Broad Acres neighborhood detailed profile
Area: 0.011 square miles
Roads and streets: NE 129th St.
Broad Acres neighborhood detailed profile
Broadmoor neighborhood in Vancouver statistics: (Find on map)
Area: 0.164 square miles
Population: 147
Population density:
Median household income in 2021:
Median rent in in 2021:
Male vs Females
Median age
Housing prices:
Average estimated value of detached houses in 2021 (89.2% of all units):
Average estimated value of housing units in 2-unit structures in 2021 (5.4% of all units):
Most popular occupations of males: transportation occupations (20.9%); business and financial operations occupations (15.8%); management occupations (except farmers) (12.8%); production occupations (10.4%); construction, extraction, and maintenance occupations (8.7%); material moving occupations (6.6%); architecture and engineering occupations (6.0%)
Most popular occupations of females: education, training, and library occupations (33.1%); management occupations (except farmers) (20.1%); business and financial operations occupations (16.4%); sales and office occupations (14.5%); arts, design, entertainment, sports, and media occupations (13.0%); life, physical, and social science occupations (12.0%); architecture and engineering occupations (11.6%)
Roads and streets: Oklahoma Dr; N Texas Dr (Texas Dr, S Texas Dr); Arizona Dr; N Santa Fe Dr (Santa Fe Dr); Louisiana Dr; Palo Alto Dr; Phoenix Way; Eureka Way; Enid Ave; Berkeley Way; S Burdick Ave; Tulsa Ave (S Tulsa Ave); N Burdick Ave; Arizona Ct.
Broadmoor neighborhood detailed profile
Area: 0.164 square miles
Population: 147
Population density:
| Broadmoor: | 895 people per square mile |
| Vancouver: | 4,491 people per square mile |
Median household income in 2021:
| Broadmoor: | $96,769 |
| Vancouver: | $69,993 |
Median rent in in 2021:
| Broadmoor: | $1,205 |
| Vancouver: | $1,311 |
Male vs Females
| Males: | 80 |
| Females: | 67 |
Median age
| Males: | 44.8 years |
| Females: | 49.6 years |
Housing prices:
Average estimated value of detached houses in 2021 (89.2% of all units):
| Broadmoor: | $705,102 |
| Vancouver: | $457,784 |
Average estimated value of housing units in 2-unit structures in 2021 (5.4% of all units):
| This neighborhood: | $248,914 |
| Vancouver: | $1,909,132 |
Most popular occupations of males: transportation occupations (20.9%); business and financial operations occupations (15.8%); management occupations (except farmers) (12.8%); production occupations (10.4%); construction, extraction, and maintenance occupations (8.7%); material moving occupations (6.6%); architecture and engineering occupations (6.0%)
Most popular occupations of females: education, training, and library occupations (33.1%); management occupations (except farmers) (20.1%); business and financial operations occupations (16.4%); sales and office occupations (14.5%); arts, design, entertainment, sports, and media occupations (13.0%); life, physical, and social science occupations (12.0%); architecture and engineering occupations (11.6%)
Roads and streets: Oklahoma Dr; N Texas Dr (Texas Dr, S Texas Dr); Arizona Dr; N Santa Fe Dr (Santa Fe Dr); Louisiana Dr; Palo Alto Dr; Phoenix Way; Eureka Way; Enid Ave; Berkeley Way; S Burdick Ave; Tulsa Ave (S Tulsa Ave); N Burdick Ave; Arizona Ct.
Broadmoor neighborhood detailed profile
Broadview neighborhood in Vancouver statistics: (Find on map)
Area: 0.003 square miles
Broadview neighborhood detailed profile
Area: 0.003 square miles
Broadview neighborhood detailed profile
Brook Run neighborhood in Vancouver statistics: (Find on map)
Area: 0.012 square miles
Roads and streets: NW 7th Pl.
Brook Run neighborhood detailed profile
Area: 0.012 square miles
Roads and streets: NW 7th Pl.
Brook Run neighborhood detailed profile
Brookside neighborhood in Vancouver statistics: (Find on map)
Area: 0.020 square miles
Population: 154
Population density:
Median household income in 2021:
Median rent in in 2021:
Male vs Females
Median age
Housing prices:
Average estimated value of detached houses in 2021 (41.8% of all units):
Average estimated value of townhouses or other attached units in 2021 (7.5% of all units):
Most popular occupations of males: service occupations (32.8%); computer and mathematical occupations (13.6%); material moving occupations (9.5%); construction, extraction, and maintenance occupations (6.3%); farming, fishing, and forestry occupations (5.7%); life, physical, and social science occupations (5.5%); architecture and engineering occupations (4.4%)
Most popular occupations of females: sales and office occupations (34.7%); service occupations (25.7%); management occupations (except farmers) (9.2%); production occupations (7.8%); community and social services occupations (7.2%); computer and mathematical occupations (5.1%); life, physical, and social science occupations (3.9%)
Roads and streets: Algona Dr; Terrace Dr; Hazelwood Dr; Overlook Dr; Cedar Dr; Cedar Rd.
Brookside neighborhood detailed profile
Area: 0.020 square miles
Population: 154
Population density:
| Brookside: | 7,666 people per square mile |
| Vancouver: | 4,491 people per square mile |
Median household income in 2021:
| Brookside: | $66,642 |
| Vancouver: | $69,993 |
Median rent in in 2021:
| Brookside: | $1,106 |
| Vancouver: | $1,311 |
Male vs Females
| Males: | 54 |
| Females: | 99 |
Median age
| Males: | 36.9 years |
| Females: | 28.5 years |
Housing prices:
Average estimated value of detached houses in 2021 (41.8% of all units):
| Brookside: | $288,098 |
| Vancouver: | $457,784 |
Average estimated value of townhouses or other attached units in 2021 (7.5% of all units):
| This neighborhood: | $66,667 |
| city: | $310,311 |
Most popular occupations of males: service occupations (32.8%); computer and mathematical occupations (13.6%); material moving occupations (9.5%); construction, extraction, and maintenance occupations (6.3%); farming, fishing, and forestry occupations (5.7%); life, physical, and social science occupations (5.5%); architecture and engineering occupations (4.4%)
Most popular occupations of females: sales and office occupations (34.7%); service occupations (25.7%); management occupations (except farmers) (9.2%); production occupations (7.8%); community and social services occupations (7.2%); computer and mathematical occupations (5.1%); life, physical, and social science occupations (3.9%)
Roads and streets: Algona Dr; Terrace Dr; Hazelwood Dr; Overlook Dr; Cedar Dr; Cedar Rd.
Brookside neighborhood detailed profile
Brookside Knoll neighborhood in Vancouver statistics: (Find on map)
Area: 0.007 square miles
Population: 40
Population density:
Median household income in 2021:
Median rent in in 2021:
Male vs Females
Median age
Most popular occupations of males: production occupations (26.9%); sales and office occupations (15.3%); service occupations (15.1%); computer and mathematical occupations (6.9%); transportation occupations (6.7%); management occupations (except farmers) (6.0%); construction, extraction, and maintenance occupations (2.1%)
Most popular occupations of females: sales and office occupations (29.9%); service occupations (25.9%); healthcare practitioners and technical occupations (10.4%); construction, extraction, and maintenance occupations (9.6%); education, training, and library occupations (9.1%); business and financial operations occupations (4.8%); management occupations (except farmers) (3.2%)
Brookside Knoll neighborhood detailed profile
Area: 0.007 square miles
Population: 40
Population density:
| Brookside Knoll: | 5,424 people per square mile |
| Vancouver: | 4,491 people per square mile |
Median household income in 2021:
| Brookside Knoll: | $58,750 |
| Vancouver: | $69,993 |
Median rent in in 2021:
| Brookside Knoll: | $900 |
| Vancouver: | $1,311 |
Male vs Females
| Males: | 20 |
| Females: | 19 |
Median age
| Males: | 34.4 years |
| Females: | 39.2 years |
Most popular occupations of males: production occupations (26.9%); sales and office occupations (15.3%); service occupations (15.1%); computer and mathematical occupations (6.9%); transportation occupations (6.7%); management occupations (except farmers) (6.0%); construction, extraction, and maintenance occupations (2.1%)
Most popular occupations of females: sales and office occupations (29.9%); service occupations (25.9%); healthcare practitioners and technical occupations (10.4%); construction, extraction, and maintenance occupations (9.6%); education, training, and library occupations (9.1%); business and financial operations occupations (4.8%); management occupations (except farmers) (3.2%)
Brookside Knoll neighborhood detailed profile
Browns Manor neighborhood in Vancouver statistics: (Find on map)
Area: 0.006 square miles
Roads and streets: NE 24th Ct.
Browns Manor neighborhood detailed profile
Area: 0.006 square miles
Roads and streets: NE 24th Ct.
Browns Manor neighborhood detailed profile
Browns Place neighborhood in Vancouver statistics: (Find on map)
Area: 0.002 square miles
Browns Place neighborhood detailed profile
Area: 0.002 square miles
Browns Place neighborhood detailed profile
Buckman Garden North neighborhood in Vancouver statistics: (Find on map)
Area: 0.014 square miles
Roads and streets: NE 41st Ave.
Buckman Garden North neighborhood detailed profile
Area: 0.014 square miles
Roads and streets: NE 41st Ave.
Buckman Garden North neighborhood detailed profile
Buckman Garden Tracts neighborhood in Vancouver statistics: (Find on map)
Area: 0.187 square miles
Roads and streets: NE 94th St; NE 88th St; NE 41st Ave; NE 93rd St; NE 45th Ave; NE 89th Way; NE 91st St; NE 37th Ave; NE 39th Ave; NE 38th Ave; NE 40th Ave; NE 92nd St; NE 95th Cir; NE 42nd Ave; NE 44th Ave; NE 88th Way; NE 90th St; NE 40th Pl; NE 40th Dr; NE 91st Way; NE 91st Cir; NE 36th Pl; NE 96th Cir; NE 89th St; NE 90th Cir; NE 41st St.
Buckman Garden Tracts neighborhood detailed profile
Buckman Heights neighborhood in Vancouver statistics: (Find on map)
Area: 0.051 square miles
Roads and streets: NE 59th St; NE 58th St; NE St James Rd.
Buckman Heights neighborhood detailed profile
Area: 0.051 square miles
Roads and streets: NE 59th St; NE 58th St; NE St James Rd.
Buckman Heights neighborhood detailed profile
Buena Vista neighborhood in Vancouver statistics: (Find on map)
Area: 0.027 square miles
Population: 157
Population density:
Median household income in 2021:
Median rent in in 2021:
Male vs Females
Median age
Average estimated value of detached houses in 2021 (55.2% of all units):
Most popular occupations of males: service occupations (17.3%); sales and office occupations (13.3%); transportation occupations (12.4%); construction, extraction, and maintenance occupations (8.8%); production occupations (8.2%); management occupations (except farmers) (7.1%); computer and mathematical occupations (6.9%)
Most popular occupations of females: sales and office occupations (24.7%); management occupations (except farmers) (21.9%); service occupations (17.0%); healthcare practitioners and technical occupations (9.1%); education, training, and library occupations (8.3%); arts, design, entertainment, sports, and media occupations (5.5%); business and financial operations occupations (5.3%)
Roads and streets: Harney St; NW Grant St (Grant St); W 36th St; W 37th St; W 38th St.
Buena Vista neighborhood detailed profile
Area: 0.027 square miles
Population: 157
Population density:
| Buena Vista: | 5,735 people per square mile |
| Vancouver: | 4,491 people per square mile |
Median household income in 2021:
| Buena Vista: | $82,233 |
| Vancouver: | $69,993 |
Median rent in in 2021:
| Buena Vista: | $1,086 |
| Vancouver: | $1,311 |
Male vs Females
| Males: | 76 |
| Females: | 81 |
Median age
| Males: | 34.5 years |
| Females: | 36.3 years |
Average estimated value of detached houses in 2021 (55.2% of all units):
| Buena Vista: | $370,182 |
| Vancouver: | $457,784 |
Most popular occupations of males: service occupations (17.3%); sales and office occupations (13.3%); transportation occupations (12.4%); construction, extraction, and maintenance occupations (8.8%); production occupations (8.2%); management occupations (except farmers) (7.1%); computer and mathematical occupations (6.9%)
Most popular occupations of females: sales and office occupations (24.7%); management occupations (except farmers) (21.9%); service occupations (17.0%); healthcare practitioners and technical occupations (9.1%); education, training, and library occupations (8.3%); arts, design, entertainment, sports, and media occupations (5.5%); business and financial operations occupations (5.3%)
Roads and streets: Harney St; NW Grant St (Grant St); W 36th St; W 37th St; W 38th St.
Buena Vista neighborhood detailed profile
Buena Vista Heights neighborhood in Vancouver statistics: (Find on map)
Area: 0.009 square miles
Buena Vista Heights neighborhood detailed profile
Area: 0.009 square miles
Buena Vista Heights neighborhood detailed profile
Buena Vista Meadows neighborhood in Vancouver statistics: (Find on map)
Area: 0.008 square miles
Buena Vista Meadows neighborhood detailed profile
Area: 0.008 square miles
Buena Vista Meadows neighborhood detailed profile
Burberry neighborhood in Vancouver statistics: (Find on map)
Area: 0.005 square miles
Burberry neighborhood detailed profile
Area: 0.005 square miles
Burberry neighborhood detailed profile
Burlwood Estates neighborhood in Vancouver statistics: (Find on map)
Area: 0.007 square miles
Population: 20
Population density:
Median household income in 2021:
Median rent in in 2021:
Male vs Females
Median age
Average estimated value of detached houses in 2021 (83.3% of all units):
Most popular occupations of males: transportation occupations (38.8%); management occupations (except farmers) (22.7%); sales and office occupations (16.3%); construction, extraction, and maintenance occupations (15.4%); production occupations (14.5%); material moving occupations (12.0%); community and social services occupations (7.9%)
Most popular occupations of females: management occupations (except farmers) (39.9%); healthcare practitioners and technical occupations (30.5%); service occupations (27.7%); education, training, and library occupations (15.2%); computer and mathematical occupations (10.6%); business and financial operations occupations (7.8%); sales and office occupations (6.6%)
Burlwood Estates neighborhood detailed profile
Area: 0.007 square miles
Population: 20
Population density:
| Burlwood Estates: | 2,774 people per square mile |
| Vancouver: | 4,491 people per square mile |
Median household income in 2021:
| Burlwood Estates: | $166,064 |
| Vancouver: | $69,993 |
Median rent in in 2021:
| Burlwood Estates: | $1,778 |
| Vancouver: | $1,311 |
Male vs Females
| Males: | 8 |
| Females: | 11 |
Median age
| Males: | 40.8 years |
| Females: | 33.5 years |
Average estimated value of detached houses in 2021 (83.3% of all units):
| Burlwood Estates: | $330,882 |
| Vancouver: | $457,784 |
Most popular occupations of males: transportation occupations (38.8%); management occupations (except farmers) (22.7%); sales and office occupations (16.3%); construction, extraction, and maintenance occupations (15.4%); production occupations (14.5%); material moving occupations (12.0%); community and social services occupations (7.9%)
Most popular occupations of females: management occupations (except farmers) (39.9%); healthcare practitioners and technical occupations (30.5%); service occupations (27.7%); education, training, and library occupations (15.2%); computer and mathematical occupations (10.6%); business and financial operations occupations (7.8%); sales and office occupations (6.6%)
Burlwood Estates neighborhood detailed profile
Burning Green neighborhood in Vancouver statistics: (Find on map)
Area: 0.008 square miles
Burning Green neighborhood detailed profile
Area: 0.008 square miles
Burning Green neighborhood detailed profile
Burnt Bridge Creek neighborhood in Vancouver statistics: (Find on map)
Area: 0.874 square miles
Population: 645
Population density:
Median household income in 2021:
Median rent in in 2021:
Male vs Females
Median age
Housing prices:
Average estimated value of detached houses in 2021 (154.4% of all units):
Average estimated value of townhouses or other attached units in 2021 (3.7% of all units):
Average estimated '21 value of housing units in 5-or-more-unit structures (38.8% of all units):
Average estimated value of mobile home in 2021 (19.7% of all units):
Most popular occupations of males: transportation occupations (81.3%); sales and office occupations (39.2%); architecture and engineering occupations (32.2%); management occupations (except farmers) (31.0%); production occupations (18.6%); business and financial operations occupations (16.4%); construction, extraction, and maintenance occupations (13.7%)
Most popular occupations of females: healthcare practitioners and technical occupations (52.4%); sales and office occupations (36.1%); service occupations (26.8%); business and financial operations occupations (18.9%); transportation occupations (16.9%); management occupations (except farmers) (15.1%); education, training, and library occupations (14.1%)
Roads and streets: NE 50th St; NE 42nd St; NE 47th St; NE 46th St; NE 45th St; NE 49th St; NE 48th St; NE 43rd St; NE 139th Ave; NE 51st St; NE 151st Ave; NE 39th St; NE 155th Ave; NE Poplar St; NE Hickory St; NE 145th Ave; NE 41st St; NE 44th St; NE 52nd St; NE 141st Ave; NE 40th St; NE 158th Ave; NE 152nd Ave; NE 142nd Ave; NE 147th Ave; NE Columbine Dr; NE 144th Ave; NE 53rd St; NE Wildrose Dr; NE 138th Ave; NE 143rd Ave; NE 140th Ave; NE Noble St; NE 160th Ave; NE Sorrel Dr; NE Rancho Dr; NE 161st Ave; NE 139th Loop; NE 43rd Way; NE 159th Ave; NE 47th Way (NE Noble St); NE 150th Ave; NE 162nd Ave; NE 157th Ave; NE 138th Pl; NE 48th Cir; NE 148th Ave; NE 141st Ct; NE 49th Way; NE 157th Ct; NE 138th Ct; NE 137th Ave; NE 40th Pl; NE 52nd Cir; NE 44th Cir; NE 49th Cir; NE 47th Cir; NE 156th Ct; NE 149th Ave; NE 158th Pl; NE 146th Ave; NE 50th Cir; NE 144th Ct; NE 40th Cir; NE 153rd Ave; NE 152nd Pl; NE 154th Ct; NE 153rd Ct; NE 152nd Ct; NE 143rd Ct.
Burnt Bridge Creek neighborhood detailed profile
Area: 0.874 square miles
Population: 645
Population density:
| Burnt Bridge Creek: | 738 people per square mile |
| Vancouver: | 4,491 people per square mile |
Median household income in 2021:
| Burnt Bridge Creek: | $39,040 |
| Vancouver: | $69,993 |
Median rent in in 2021:
| Burnt Bridge Creek: | $1,348 |
| Vancouver: | $1,311 |
Male vs Females
| Males: | 242 |
| Females: | 402 |
Median age
| Males: | 34.2 years |
| Females: | 38.7 years |
Housing prices:
Average estimated value of detached houses in 2021 (154.4% of all units):
| Burnt Bridge Creek: | $324,749 |
| Vancouver: | $457,784 |
Average estimated value of townhouses or other attached units in 2021 (3.7% of all units):
| This neighborhood: | $275,138 |
| city: | $310,311 |
Average estimated '21 value of housing units in 5-or-more-unit structures (38.8% of all units):
| Burnt Bridge Creek: | $156,699 |
| Vancouver: | $351,621 |
Average estimated value of mobile home in 2021 (19.7% of all units):
| Burnt Bridge Creek: | $96,603 |
| Vancouver: | $109,677 |
Most popular occupations of males: transportation occupations (81.3%); sales and office occupations (39.2%); architecture and engineering occupations (32.2%); management occupations (except farmers) (31.0%); production occupations (18.6%); business and financial operations occupations (16.4%); construction, extraction, and maintenance occupations (13.7%)
Most popular occupations of females: healthcare practitioners and technical occupations (52.4%); sales and office occupations (36.1%); service occupations (26.8%); business and financial operations occupations (18.9%); transportation occupations (16.9%); management occupations (except farmers) (15.1%); education, training, and library occupations (14.1%)
Roads and streets: NE 50th St; NE 42nd St; NE 47th St; NE 46th St; NE 45th St; NE 49th St; NE 48th St; NE 43rd St; NE 139th Ave; NE 51st St; NE 151st Ave; NE 39th St; NE 155th Ave; NE Poplar St; NE Hickory St; NE 145th Ave; NE 41st St; NE 44th St; NE 52nd St; NE 141st Ave; NE 40th St; NE 158th Ave; NE 152nd Ave; NE 142nd Ave; NE 147th Ave; NE Columbine Dr; NE 144th Ave; NE 53rd St; NE Wildrose Dr; NE 138th Ave; NE 143rd Ave; NE 140th Ave; NE Noble St; NE 160th Ave; NE Sorrel Dr; NE Rancho Dr; NE 161st Ave; NE 139th Loop; NE 43rd Way; NE 159th Ave; NE 47th Way (NE Noble St); NE 150th Ave; NE 162nd Ave; NE 157th Ave; NE 138th Pl; NE 48th Cir; NE 148th Ave; NE 141st Ct; NE 49th Way; NE 157th Ct; NE 138th Ct; NE 137th Ave; NE 40th Pl; NE 52nd Cir; NE 44th Cir; NE 49th Cir; NE 47th Cir; NE 156th Ct; NE 149th Ave; NE 158th Pl; NE 146th Ave; NE 50th Cir; NE 144th Ct; NE 40th Cir; NE 153rd Ave; NE 152nd Pl; NE 154th Ct; NE 153rd Ct; NE 152nd Ct; NE 143rd Ct.
Burnt Bridge Creek neighborhood detailed profile
Burnt Bridge Crest neighborhood in Vancouver statistics: (Find on map)
Area: 0.009 square miles
Population: 20
Population density:
Median household income in 2021:
Median rent in in 2021:
Male vs Females
Median age
Most popular occupations of males: material moving occupations (29.6%); service occupations (29.2%); sales and office occupations (11.8%); transportation occupations (11.1%); management occupations (except farmers) (8.3%); business and financial operations occupations (5.1%); legal occupations (2.6%)
Most popular occupations of females: sales and office occupations (37.1%); service occupations (33.8%); education, training, and library occupations (9.5%); management occupations (except farmers) (7.4%); healthcare practitioners and technical occupations (5.9%); material moving occupations (5.6%); business and financial operations occupations (3.6%)
Burnt Bridge Crest neighborhood detailed profile
Area: 0.009 square miles
Population: 20
Population density:
| Burnt Bridge Crest: | 2,306 people per square mile |
| Vancouver: | 4,491 people per square mile |
Median household income in 2021:
| Burnt Bridge Crest: | $75,134 |
| Vancouver: | $69,993 |
Median rent in in 2021:
| Burnt Bridge Crest: | $1,292 |
| Vancouver: | $1,311 |
Male vs Females
| Males: | 10 |
| Females: | 10 |
Median age
| Males: | 37.7 years |
| Females: | 51.7 years |
Most popular occupations of males: material moving occupations (29.6%); service occupations (29.2%); sales and office occupations (11.8%); transportation occupations (11.1%); management occupations (except farmers) (8.3%); business and financial operations occupations (5.1%); legal occupations (2.6%)
Most popular occupations of females: sales and office occupations (37.1%); service occupations (33.8%); education, training, and library occupations (9.5%); management occupations (except farmers) (7.4%); healthcare practitioners and technical occupations (5.9%); material moving occupations (5.6%); business and financial operations occupations (3.6%)
Burnt Bridge Crest neighborhood detailed profile
Burnt Bridge Vista neighborhood in Vancouver statistics: (Find on map)
Area: 0.002 square miles
Burnt Bridge Vista neighborhood detailed profile
Area: 0.002 square miles
Burnt Bridge Vista neighborhood detailed profile
Burroughs Estates neighborhood in Vancouver statistics: (Find on map)
Area: 0.006 square miles
Population: 15
Population density:
Median household income in 2021:
Median rent in in 2021:
Male vs Females
Median age
Most popular occupations of males: sales and office occupations (13.3%); service occupations (11.6%); arts, design, entertainment, sports, and media occupations (9.4%); management occupations (except farmers) (9.2%); construction, extraction, and maintenance occupations (7.1%); transportation occupations (6.6%); production occupations (5.4%)
Most popular occupations of females: sales and office occupations (25.4%); service occupations (22.8%); arts, design, entertainment, sports, and media occupations (17.6%); healthcare practitioners and technical occupations (8.8%); education, training, and library occupations (7.3%); production occupations (4.9%); computer and mathematical occupations (4.1%)
Roads and streets: NE 88th Ave.
Burroughs Estates neighborhood detailed profile
Area: 0.006 square miles
Population: 15
Population density:
| Burroughs Estates: | 2,355 people per square mile |
| Vancouver: | 4,491 people per square mile |
Median household income in 2021:
| Burroughs Estates: | $97,783 |
| Vancouver: | $69,993 |
Median rent in in 2021:
| Burroughs Estates: | $1,582 |
| Vancouver: | $1,311 |
Male vs Females
| Males: | 8 |
| Females: | 7 |
Median age
| Males: | 35.3 years |
| Females: | 37.0 years |
Most popular occupations of males: sales and office occupations (13.3%); service occupations (11.6%); arts, design, entertainment, sports, and media occupations (9.4%); management occupations (except farmers) (9.2%); construction, extraction, and maintenance occupations (7.1%); transportation occupations (6.6%); production occupations (5.4%)
Most popular occupations of females: sales and office occupations (25.4%); service occupations (22.8%); arts, design, entertainment, sports, and media occupations (17.6%); healthcare practitioners and technical occupations (8.8%); education, training, and library occupations (7.3%); production occupations (4.9%); computer and mathematical occupations (4.1%)
Roads and streets: NE 88th Ave.
Burroughs Estates neighborhood detailed profile
Burton Evergreen neighborhood in Vancouver statistics: (Find on map)
Area: 0.185 square miles
Population: 721
Population density:
Median household income in 2021:
Median rent in in 2021:
Male vs Females
Median age
Average estimated value of detached houses in 2021 (76.6% of all units):
Most popular occupations of males: service occupations (27.9%); management occupations (except farmers) (15.6%); sales and office occupations (15.0%); production occupations (12.3%); material moving occupations (7.3%); construction, extraction, and maintenance occupations (6.5%); education, training, and library occupations (2.9%)
Most popular occupations of females: service occupations (44.1%); sales and office occupations (14.6%); transportation occupations (14.6%); legal occupations (11.6%); business and financial operations occupations (6.5%); healthcare practitioners and technical occupations (5.0%); education, training, and library occupations (3.5%)
Roads and streets: NE 149th Ave; NE 26th St; NE 18th St; NE 151st Ave; NE 20th Cir; NE 153rd Ave; NE 24th St; NE 25th St; NE 27th St; NE 20th St; NE 147th Ct; NE 150th Ave; NE 148th Ct; NE 21st St; NE 149th Ct; NE 152nd Pl; NE 19th Cir; NE 151st Ct; NE 19th St.
Burton Evergreen neighborhood detailed profile
Area: 0.185 square miles
Population: 721
Population density:
| Burton Evergreen: | 3,892 people per square mile |
| Vancouver: | 4,491 people per square mile |
Median household income in 2021:
| Burton Evergreen: | $88,034 |
| Vancouver: | $69,993 |
Median rent in in 2021:
| Burton Evergreen: | $1,408 |
| Vancouver: | $1,311 |
Male vs Females
| Males: | 409 |
| Females: | 311 |
Median age
| Males: | 38.3 years |
| Females: | 39.9 years |
Average estimated value of detached houses in 2021 (76.6% of all units):
| Burton Evergreen: | $362,336 |
| Vancouver: | $457,784 |
Most popular occupations of males: service occupations (27.9%); management occupations (except farmers) (15.6%); sales and office occupations (15.0%); production occupations (12.3%); material moving occupations (7.3%); construction, extraction, and maintenance occupations (6.5%); education, training, and library occupations (2.9%)
Most popular occupations of females: service occupations (44.1%); sales and office occupations (14.6%); transportation occupations (14.6%); legal occupations (11.6%); business and financial operations occupations (6.5%); healthcare practitioners and technical occupations (5.0%); education, training, and library occupations (3.5%)
Roads and streets: NE 149th Ave; NE 26th St; NE 18th St; NE 151st Ave; NE 20th Cir; NE 153rd Ave; NE 24th St; NE 25th St; NE 27th St; NE 20th St; NE 147th Ct; NE 150th Ave; NE 148th Ct; NE 21st St; NE 149th Ct; NE 152nd Pl; NE 19th Cir; NE 151st Ct; NE 19th St.
Burton Evergreen neighborhood detailed profile
Burton Meadows neighborhood in Vancouver statistics: (Find on map)
Area: 0.011 square miles
Roads and streets: NE 33rd Cir.
Burton Meadows neighborhood detailed profile
Area: 0.011 square miles
Roads and streets: NE 33rd Cir.
Burton Meadows neighborhood detailed profile
Burton Place neighborhood in Vancouver statistics: (Find on map)
Area: 0.001 square miles
Population: 6
Population density:
Median household income in 2021:
Median rent in in 2021:
Male vs Females
Median age
Average estimated value of detached houses in 2021 (100.0% of all units):
Most popular occupations of males: sales and office occupations (27.3%); material moving occupations (22.2%); business and financial operations occupations (13.6%); management occupations (except farmers) (9.4%); construction, extraction, and maintenance occupations (8.2%); service occupations (7.4%); production occupations (4.5%)
Most popular occupations of females: education, training, and library occupations (55.6%); sales and office occupations (14.4%); service occupations (10.9%); production occupations (6.8%); healthcare practitioners and technical occupations (6.5%); arts, design, entertainment, sports, and media occupations (5.9%); business and financial operations occupations (4.4%)
Burton Place neighborhood detailed profile
Area: 0.001 square miles
Population: 6
Population density:
| Burton Place: | 4,657 people per square mile |
| Vancouver: | 4,491 people per square mile |
Median household income in 2021:
| Burton Place: | $73,291 |
| Vancouver: | $69,993 |
Median rent in in 2021:
| Burton Place: | $1,602 |
| Vancouver: | $1,311 |
Male vs Females
| Males: | 2 |
| Females: | 3 |
Median age
| Males: | 42.3 years |
| Females: | 40.3 years |
Average estimated value of detached houses in 2021 (100.0% of all units):
| Burton Place: | $303,060 |
| Vancouver: | $457,784 |
Most popular occupations of males: sales and office occupations (27.3%); material moving occupations (22.2%); business and financial operations occupations (13.6%); management occupations (except farmers) (9.4%); construction, extraction, and maintenance occupations (8.2%); service occupations (7.4%); production occupations (4.5%)
Most popular occupations of females: education, training, and library occupations (55.6%); sales and office occupations (14.4%); service occupations (10.9%); production occupations (6.8%); healthcare practitioners and technical occupations (6.5%); arts, design, entertainment, sports, and media occupations (5.9%); business and financial operations occupations (4.4%)
Burton Place neighborhood detailed profile
Burton Ridge neighborhood in Vancouver statistics: (Find on map)
Area: 0.259 square miles
Population: 1,290
Population density:
Median household income in 2021:
Median rent in in 2021:
Male vs Females
Median age
Average estimated value of detached houses in 2021 (100.0% of all units):
Most popular occupations of males: sales and office occupations (27.3%); material moving occupations (22.2%); business and financial operations occupations (13.6%); management occupations (except farmers) (9.4%); construction, extraction, and maintenance occupations (8.2%); service occupations (7.4%); production occupations (4.5%)
Most popular occupations of females: education, training, and library occupations (55.6%); sales and office occupations (14.4%); service occupations (10.9%); production occupations (6.8%); healthcare practitioners and technical occupations (6.5%); arts, design, entertainment, sports, and media occupations (5.9%); business and financial operations occupations (4.3%)
Roads and streets: NE 21st St; NE 20th St; NE 19th St; NE 18th St; NE 18th Ave; NE 22nd St; NE 23rd St; NE 102nd Ave; NE Cranbrook Dr; NE 98th Ave; NE 98th Loop; NE 94th Ct; NE 105th Ave; NE 96th Ct; NE 104th Ave; NE Heron Cir; NE 107th Ave; NE Holly St; NE 24th St; NE 22nd Cir; NE Sandpiper Cir; NE 100th Ave; NE 25th St; NE 106th Ave; I-205; NE 24th Cir; NE 95th Ave; NE 20th Cir; NE 101st Ave; NE Holly Ct.
Burton Ridge neighborhood detailed profile
Area: 0.259 square miles
Population: 1,290
Population density:
| Burton Ridge: | 4,985 people per square mile |
| Vancouver: | 4,491 people per square mile |
Median household income in 2021:
| Burton Ridge: | $73,291 |
| Vancouver: | $69,993 |
Median rent in in 2021:
| Burton Ridge: | $1,602 |
| Vancouver: | $1,311 |
Male vs Females
| Males: | 541 |
| Females: | 748 |
Median age
| Males: | 42.3 years |
| Females: | 40.3 years |
Average estimated value of detached houses in 2021 (100.0% of all units):
| Burton Ridge: | $303,060 |
| Vancouver: | $457,784 |
Most popular occupations of males: sales and office occupations (27.3%); material moving occupations (22.2%); business and financial operations occupations (13.6%); management occupations (except farmers) (9.4%); construction, extraction, and maintenance occupations (8.2%); service occupations (7.4%); production occupations (4.5%)
Most popular occupations of females: education, training, and library occupations (55.6%); sales and office occupations (14.4%); service occupations (10.9%); production occupations (6.8%); healthcare practitioners and technical occupations (6.5%); arts, design, entertainment, sports, and media occupations (5.9%); business and financial operations occupations (4.3%)
Roads and streets: NE 21st St; NE 20th St; NE 19th St; NE 18th St; NE 18th Ave; NE 22nd St; NE 23rd St; NE 102nd Ave; NE Cranbrook Dr; NE 98th Ave; NE 98th Loop; NE 94th Ct; NE 105th Ave; NE 96th Ct; NE 104th Ave; NE Heron Cir; NE 107th Ave; NE Holly St; NE 24th St; NE 22nd Cir; NE Sandpiper Cir; NE 100th Ave; NE 25th St; NE 106th Ave; I-205; NE 24th Cir; NE 95th Ave; NE 20th Cir; NE 101st Ave; NE Holly Ct.
Burton Ridge neighborhood detailed profile
Bush Gardens neighborhood in Vancouver statistics: (Find on map)
Area: 0.057 square miles
Roads and streets: NE 149th Ave; NE 148th Ave; NE Orion St; NE 38th St; NE 35th Cir; NE 34th St; NE 36th St; NE 150th Ave; NE 151st Ave; NE 151st Ct; NE 148th Ct.
Bush Gardens neighborhood detailed profile
Area: 0.057 square miles
Roads and streets: NE 149th Ave; NE 148th Ave; NE Orion St; NE 38th St; NE 35th Cir; NE 34th St; NE 36th St; NE 150th Ave; NE 151st Ave; NE 151st Ct; NE 148th Ct.
Bush Gardens neighborhood detailed profile
Buttercup Estates neighborhood in Vancouver statistics: (Find on map)
Area: 0.011 square miles
Buttercup Estates neighborhood detailed profile
Area: 0.011 square miles
Buttercup Estates neighborhood detailed profile
Butternut Hill neighborhood in Vancouver statistics: (Find on map)
Area: 0.006 square miles
Population: 17
Population density:
Median household income in 2021:
Median rent in in 2021:
Male vs Females
Median age
Average estimated value of detached houses in 2021 (80.0% of all units):
Most popular occupations of males: transportation occupations (38.8%); management occupations (except farmers) (22.7%); sales and office occupations (16.6%); construction, extraction, and maintenance occupations (15.6%); production occupations (14.5%); material moving occupations (12.0%); community and social services occupations (8.0%)
Most popular occupations of females: management occupations (except farmers) (39.9%); healthcare practitioners and technical occupations (30.9%); service occupations (27.7%); education, training, and library occupations (15.2%); computer and mathematical occupations (10.6%); business and financial operations occupations (7.9%); sales and office occupations (6.6%)
Butternut Hill neighborhood detailed profile
Area: 0.006 square miles
Population: 17
Population density:
| Butternut Hill: | 2,709 people per square mile |
| Vancouver: | 4,491 people per square mile |
Median household income in 2021:
| Butternut Hill: | $166,064 |
| Vancouver: | $69,993 |
Median rent in in 2021:
| Butternut Hill: | $1,778 |
| Vancouver: | $1,311 |
Male vs Females
| Males: | 7 |
| Females: | 9 |
Median age
| Males: | 40.8 years |
| Females: | 33.5 years |
Average estimated value of detached houses in 2021 (80.0% of all units):
| Butternut Hill: | $330,882 |
| Vancouver: | $457,784 |
Most popular occupations of males: transportation occupations (38.8%); management occupations (except farmers) (22.7%); sales and office occupations (16.6%); construction, extraction, and maintenance occupations (15.6%); production occupations (14.5%); material moving occupations (12.0%); community and social services occupations (8.0%)
Most popular occupations of females: management occupations (except farmers) (39.9%); healthcare practitioners and technical occupations (30.9%); service occupations (27.7%); education, training, and library occupations (15.2%); computer and mathematical occupations (10.6%); business and financial operations occupations (7.9%); sales and office occupations (6.6%)
Butternut Hill neighborhood detailed profile
Cabes Acres neighborhood in Vancouver statistics: (Find on map)
Area: 0.007 square miles
Population: 47
Population density:
Median household income in 2021:
Median rent in in 2021:
Male vs Females
Median age
Average estimated value of detached houses in 2021 (100.0% of all units):
Most popular occupations of males: service occupations (29.3%); management occupations (except farmers) (21.8%); sales and office occupations (17.2%); transportation occupations (5.1%); material moving occupations (4.8%); healthcare practitioners and technical occupations (4.4%); production occupations (4.1%)
Most popular occupations of females: healthcare practitioners and technical occupations (34.9%); sales and office occupations (26.0%); service occupations (17.1%); legal occupations (6.8%); education, training, and library occupations (6.0%); computer and mathematical occupations (4.0%); life, physical, and social science occupations (2.8%)
Roads and streets: NE 52nd St; NE 42nd Ct.
Cabes Acres neighborhood detailed profile
Area: 0.007 square miles
Population: 47
Population density:
| Cabes Acres: | 7,219 people per square mile |
| Vancouver: | 4,491 people per square mile |
Median household income in 2021:
| Cabes Acres: | $122,949 |
| Vancouver: | $69,993 |
Median rent in in 2021:
| Cabes Acres: | $1,693 |
| Vancouver: | $1,311 |
Male vs Females
| Males: | 18 |
| Females: | 29 |
Median age
| Males: | 34.5 years |
| Females: | 29.0 years |
Average estimated value of detached houses in 2021 (100.0% of all units):
| Cabes Acres: | $379,477 |
| Vancouver: | $457,784 |
Most popular occupations of males: service occupations (29.3%); management occupations (except farmers) (21.8%); sales and office occupations (17.2%); transportation occupations (5.1%); material moving occupations (4.8%); healthcare practitioners and technical occupations (4.4%); production occupations (4.1%)
Most popular occupations of females: healthcare practitioners and technical occupations (34.9%); sales and office occupations (26.0%); service occupations (17.1%); legal occupations (6.8%); education, training, and library occupations (6.0%); computer and mathematical occupations (4.0%); life, physical, and social science occupations (2.8%)
Roads and streets: NE 52nd St; NE 42nd Ct.
Cabes Acres neighborhood detailed profile
Cady Court neighborhood in Vancouver statistics: (Find on map)
Area: 0.005 square miles
Population: 7
Population density:
Median household income in 2021:
Median rent in in 2021:
Male vs Females
Median age
Most popular occupations of males: service occupations (47.3%); computer and mathematical occupations (35.6%); legal occupations (29.9%); material moving occupations (26.0%); transportation occupations (18.4%); arts, design, entertainment, sports, and media occupations (12.8%); management occupations (except farmers) (12.1%)
Most popular occupations of females: sales and office occupations (41.1%); management occupations (except farmers) (26.6%); service occupations (18.4%); education, training, and library occupations (10.5%); healthcare practitioners and technical occupations (10.5%); material moving occupations (5.8%); transportation occupations (5.6%)
Cady Court neighborhood detailed profile
Area: 0.005 square miles
Population: 7
Population density:
| Cady Court: | 1,475 people per square mile |
| Vancouver: | 4,491 people per square mile |
Median household income in 2021:
| Cady Court: | $104,435 |
| Vancouver: | $69,993 |
Median rent in in 2021:
| Cady Court: | $1,393 |
| Vancouver: | $1,311 |
Male vs Females
| Males: | 3 |
| Females: | 4 |
Median age
| Males: | 64.3 years |
| Females: | 59.3 years |
Most popular occupations of males: service occupations (47.3%); computer and mathematical occupations (35.6%); legal occupations (29.9%); material moving occupations (26.0%); transportation occupations (18.4%); arts, design, entertainment, sports, and media occupations (12.8%); management occupations (except farmers) (12.1%)
Most popular occupations of females: sales and office occupations (41.1%); management occupations (except farmers) (26.6%); service occupations (18.4%); education, training, and library occupations (10.5%); healthcare practitioners and technical occupations (10.5%); material moving occupations (5.8%); transportation occupations (5.6%)
Cady Court neighborhood detailed profile
Caitlin Glen neighborhood in Vancouver statistics: (Find on map)
Area: 0.001 square miles
Population: 7
Population density:
Median household income in 2021:
Median rent in in 2021:
Male vs Females
Median age
Most popular occupations of males: production occupations (22.6%); construction, extraction, and maintenance occupations (13.6%); management occupations (except farmers) (8.8%); community and social services occupations (8.4%); sales and office occupations (6.4%); computer and mathematical occupations (5.5%); farming, fishing, and forestry occupations (5.1%)
Most popular occupations of females: service occupations (33.2%); management occupations (except farmers) (28.5%); sales and office occupations (26.3%); healthcare practitioners and technical occupations (13.9%); business and financial operations occupations (7.9%); legal occupations (4.3%); transportation occupations (4.3%)
Caitlin Glen neighborhood detailed profile
Area: 0.001 square miles
Population: 7
Population density:
| Caitlin Glen: | 5,584 people per square mile |
| Vancouver: | 4,491 people per square mile |
Median household income in 2021:
| Caitlin Glen: | $58,650 |
| Vancouver: | $69,993 |
Median rent in in 2021:
| Caitlin Glen: | $1,070 |
| Vancouver: | $1,311 |
Male vs Females
| Males: | 3 |
| Females: | 3 |
Median age
| Males: | 41.2 years |
| Females: | 33.7 years |
Most popular occupations of males: production occupations (22.6%); construction, extraction, and maintenance occupations (13.6%); management occupations (except farmers) (8.8%); community and social services occupations (8.4%); sales and office occupations (6.4%); computer and mathematical occupations (5.5%); farming, fishing, and forestry occupations (5.1%)
Most popular occupations of females: service occupations (33.2%); management occupations (except farmers) (28.5%); sales and office occupations (26.3%); healthcare practitioners and technical occupations (13.9%); business and financial operations occupations (7.9%); legal occupations (4.3%); transportation occupations (4.3%)
Caitlin Glen neighborhood detailed profile
Cambridge Estates neighborhood in Vancouver statistics: (Find on map)
Area: 0.060 square miles
Population: 39
Population density:
Median household income in 2021:
Median rent in in 2021:
Male vs Females
Median age
Most popular occupations of males: sales and office occupations (26.6%); material moving occupations (14.8%); management occupations (except farmers) (12.2%); production occupations (8.2%); architecture and engineering occupations (7.6%); service occupations (5.9%); business and financial operations occupations (5.3%)
Most popular occupations of females: sales and office occupations (32.0%); business and financial operations occupations (15.2%); service occupations (14.6%); education, training, and library occupations (13.7%); healthcare practitioners and technical occupations (13.3%); material moving occupations (4.5%); management occupations (except farmers) (3.9%)
Roads and streets: NE 49th Cir.
Cambridge Estates neighborhood detailed profile
Area: 0.060 square miles
Population: 39
Population density:
| Cambridge Estates: | 653 people per square mile |
| Vancouver: | 4,491 people per square mile |
Median household income in 2021:
| Cambridge Estates: | $114,639 |
| Vancouver: | $69,993 |
Median rent in in 2021:
| Cambridge Estates: | $1,561 |
| Vancouver: | $1,311 |
Male vs Females
| Males: | 21 |
| Females: | 17 |
Median age
| Males: | 33.1 years |
| Females: | 45.0 years |
Most popular occupations of males: sales and office occupations (26.6%); material moving occupations (14.8%); management occupations (except farmers) (12.2%); production occupations (8.2%); architecture and engineering occupations (7.6%); service occupations (5.9%); business and financial operations occupations (5.3%)
Most popular occupations of females: sales and office occupations (32.0%); business and financial operations occupations (15.2%); service occupations (14.6%); education, training, and library occupations (13.7%); healthcare practitioners and technical occupations (13.3%); material moving occupations (4.5%); management occupations (except farmers) (3.9%)
Roads and streets: NE 49th Cir.
Cambridge Estates neighborhood detailed profile
Camelot Court neighborhood in Vancouver statistics: (Find on map)
Area: 0.027 square miles
Population: 109
Population density:
Median household income in 2021:
Median rent in in 2021:
Male vs Females
Median age
Most popular occupations of males: computer and mathematical occupations (15.4%); service occupations (14.2%); management occupations (except farmers) (12.5%); transportation occupations (11.2%); business and financial operations occupations (11.0%); sales and office occupations (10.8%); construction, extraction, and maintenance occupations (10.4%)
Most popular occupations of females: service occupations (40.2%); sales and office occupations (34.5%); business and financial operations occupations (7.1%); healthcare practitioners and technical occupations (6.2%); management occupations (except farmers) (6.0%); production occupations (6.0%); farming, fishing, and forestry occupations (4.5%)
Roads and streets: NE 126th Ave; NE 125th Ave; NE 127th Ave; NE 12th St; NE 11th St; NE 9th St.
Camelot Court neighborhood detailed profile
Area: 0.027 square miles
Population: 109
Population density:
| Camelot Court: | 3,970 people per square mile |
| Vancouver: | 4,491 people per square mile |
Median household income in 2021:
| Camelot Court: | $70,577 |
| Vancouver: | $69,993 |
Median rent in in 2021:
| Camelot Court: | $1,311 |
| Vancouver: | $1,311 |
Male vs Females
| Males: | 48 |
| Females: | 60 |
Median age
| Males: | 31.5 years |
| Females: | 29.4 years |
Most popular occupations of males: computer and mathematical occupations (15.4%); service occupations (14.2%); management occupations (except farmers) (12.5%); transportation occupations (11.2%); business and financial operations occupations (11.0%); sales and office occupations (10.8%); construction, extraction, and maintenance occupations (10.4%)
Most popular occupations of females: service occupations (40.2%); sales and office occupations (34.5%); business and financial operations occupations (7.1%); healthcare practitioners and technical occupations (6.2%); management occupations (except farmers) (6.0%); production occupations (6.0%); farming, fishing, and forestry occupations (4.5%)
Roads and streets: NE 126th Ave; NE 125th Ave; NE 127th Ave; NE 12th St; NE 11th St; NE 9th St.
Camelot Court neighborhood detailed profile
Camelot Crest neighborhood in Vancouver statistics: (Find on map)
Area: 0.059 square miles
Population: 69
Population density:
Median household income in 2021:
Median rent in in 2021:
Male vs Females
Median age
Housing prices:
Average estimated value of detached houses in 2021 (78.6% of all units):
Average estimated value of townhouses or other attached units in 2021 (21.4% of all units):
Most popular occupations of males: service occupations (52.9%); computer and mathematical occupations (20.5%); sales and office occupations (20.0%); business and financial operations occupations (15.9%); healthcare practitioners and technical occupations (9.3%); community and social services occupations (2.7%)
Most popular occupations of females: sales and office occupations (27.6%); transportation occupations (25.7%); legal occupations (22.0%); service occupations (14.1%); education, training, and library occupations (10.4%); computer and mathematical occupations (3.4%); architecture and engineering occupations (2.2%)
Roads and streets: SE 157th Ave; SE 3rd St; SE 2nd St; SE 157th Loop; SE 156th Ave; SE Mill Plain Blvd; SE 5th St; SE 159th Ave; SE 158th Ct.
Camelot Crest neighborhood detailed profile
Area: 0.059 square miles
Population: 69
Population density:
| Camelot Crest: | 1,171 people per square mile |
| Vancouver: | 4,491 people per square mile |
Median household income in 2021:
| Camelot Crest: | $82,844 |
| Vancouver: | $69,993 |
Median rent in in 2021:
| Camelot Crest: | $1,928 |
| Vancouver: | $1,311 |
Male vs Females
| Males: | 36 |
| Females: | 32 |
Median age
| Males: | 44.1 years |
| Females: | 38.6 years |
Housing prices:
Average estimated value of detached houses in 2021 (78.6% of all units):
| Camelot Crest: | $311,472 |
| Vancouver: | $457,784 |
Average estimated value of townhouses or other attached units in 2021 (21.4% of all units):
| This neighborhood: | $73,819 |
| city: | $310,311 |
Most popular occupations of males: service occupations (52.9%); computer and mathematical occupations (20.5%); sales and office occupations (20.0%); business and financial operations occupations (15.9%); healthcare practitioners and technical occupations (9.3%); community and social services occupations (2.7%)
Most popular occupations of females: sales and office occupations (27.6%); transportation occupations (25.7%); legal occupations (22.0%); service occupations (14.1%); education, training, and library occupations (10.4%); computer and mathematical occupations (3.4%); architecture and engineering occupations (2.2%)
Roads and streets: SE 157th Ave; SE 3rd St; SE 2nd St; SE 157th Loop; SE 156th Ave; SE Mill Plain Blvd; SE 5th St; SE 159th Ave; SE 158th Ct.
Camelot Crest neighborhood detailed profile
Camille Court neighborhood in Vancouver statistics: (Find on map)
Area: 0.002 square miles
Camille Court neighborhood detailed profile
Area: 0.002 square miles
Camille Court neighborhood detailed profile
Camille Estates neighborhood in Vancouver statistics: (Find on map)
Area: 0.016 square miles
Camille Estates neighborhood detailed profile
Area: 0.016 square miles
Camille Estates neighborhood detailed profile
Camino Village neighborhood in Vancouver statistics: (Find on map)
Area: 0.008 square miles
Camino Village neighborhood detailed profile
Area: 0.008 square miles
Camino Village neighborhood detailed profile
Canaan Acres neighborhood in Vancouver statistics: (Find on map)
Area: 0.016 square miles
Population: 88
Population density:
Median household income in 2021:
Median rent in in 2021:
Male vs Females
Median age
Most popular occupations of males: production occupations (22.6%); construction, extraction, and maintenance occupations (13.6%); management occupations (except farmers) (8.8%); community and social services occupations (8.4%); sales and office occupations (6.4%); computer and mathematical occupations (5.5%); farming, fishing, and forestry occupations (5.1%)
Most popular occupations of females: service occupations (33.2%); management occupations (except farmers) (28.5%); sales and office occupations (26.8%); healthcare practitioners and technical occupations (13.9%); business and financial operations occupations (7.9%); legal occupations (4.3%); transportation occupations (4.3%)
Roads and streets: NE 70th St.
Canaan Acres neighborhood detailed profile
Area: 0.016 square miles
Population: 88
Population density:
| Canaan Acres: | 5,595 people per square mile |
| Vancouver: | 4,491 people per square mile |
Median household income in 2021:
| Canaan Acres: | $58,650 |
| Vancouver: | $69,993 |
Median rent in in 2021:
| Canaan Acres: | $1,070 |
| Vancouver: | $1,311 |
Male vs Females
| Males: | 41 |
| Females: | 46 |
Median age
| Males: | 41.2 years |
| Females: | 33.7 years |
Most popular occupations of males: production occupations (22.6%); construction, extraction, and maintenance occupations (13.6%); management occupations (except farmers) (8.8%); community and social services occupations (8.4%); sales and office occupations (6.4%); computer and mathematical occupations (5.5%); farming, fishing, and forestry occupations (5.1%)
Most popular occupations of females: service occupations (33.2%); management occupations (except farmers) (28.5%); sales and office occupations (26.8%); healthcare practitioners and technical occupations (13.9%); business and financial operations occupations (7.9%); legal occupations (4.3%); transportation occupations (4.3%)
Roads and streets: NE 70th St.
Canaan Acres neighborhood detailed profile
Candlebrooke neighborhood in Vancouver statistics: (Find on map)
Area: 0.016 square miles
Population: 50
Population density:
Median household income in 2021:
Median rent in in 2021:
Male vs Females
Median age
Most popular occupations of males: service occupations (33.9%); production occupations (24.7%); material moving occupations (7.5%); healthcare practitioners and technical occupations (5.0%); sales and office occupations (5.0%); management occupations (except farmers) (4.8%); transportation occupations (3.7%)
Most popular occupations of females: service occupations (58.6%); sales and office occupations (18.1%); production occupations (16.3%); education, training, and library occupations (8.6%); material moving occupations (8.0%); management occupations (except farmers) (5.2%); legal occupations (4.5%)
Roads and streets: NW 109th St; NW 8th Ct.
Candlebrooke neighborhood detailed profile
Area: 0.016 square miles
Population: 50
Population density:
| Candlebrooke: | 3,038 people per square mile |
| Vancouver: | 4,491 people per square mile |
Median household income in 2021:
| Candlebrooke: | $92,473 |
| Vancouver: | $69,993 |
Median rent in in 2021:
| Candlebrooke: | $1,068 |
| Vancouver: | $1,311 |
Male vs Females
| Males: | 22 |
| Females: | 27 |
Median age
| Males: | 41.1 years |
| Females: | 31.8 years |
Most popular occupations of males: service occupations (33.9%); production occupations (24.7%); material moving occupations (7.5%); healthcare practitioners and technical occupations (5.0%); sales and office occupations (5.0%); management occupations (except farmers) (4.8%); transportation occupations (3.7%)
Most popular occupations of females: service occupations (58.6%); sales and office occupations (18.1%); production occupations (16.3%); education, training, and library occupations (8.6%); material moving occupations (8.0%); management occupations (except farmers) (5.2%); legal occupations (4.5%)
Roads and streets: NW 109th St; NW 8th Ct.
Candlebrooke neighborhood detailed profile
Candlewood neighborhood in Vancouver statistics: (Find on map)
Area: 0.008 square miles
Candlewood neighborhood detailed profile
Area: 0.008 square miles
Candlewood neighborhood detailed profile
Canter Wood neighborhood in Vancouver statistics: (Find on map)
Area: 0.017 square miles
Population: 62
Population density:
Median household income in 2021:
Median rent in in 2021:
Male vs Females
Median age
Average estimated value of detached houses in 2021 (95.8% of all units):
Most popular occupations of males: service occupations (21.0%); sales and office occupations (20.4%); construction, extraction, and maintenance occupations (18.0%); management occupations (except farmers) (10.2%); arts, design, entertainment, sports, and media occupations (9.4%); production occupations (8.0%); material moving occupations (4.9%)
Most popular occupations of females: business and financial operations occupations (27.1%); service occupations (19.7%); education, training, and library occupations (11.3%); healthcare practitioners and technical occupations (9.3%); sales and office occupations (8.8%); computer and mathematical occupations (8.3%); architecture and engineering occupations (4.1%)
Roads and streets: NE 105th Cir; NE 33rd Ave; NE 104th Cir.
Canter Wood neighborhood detailed profile
Area: 0.017 square miles
Population: 62
Population density:
| Canter Wood: | 3,724 people per square mile |
| Vancouver: | 4,491 people per square mile |
Median household income in 2021:
| Canter Wood: | $106,717 |
| Vancouver: | $69,993 |
Median rent in in 2021:
| Canter Wood: | $2,098 |
| Vancouver: | $1,311 |
Male vs Females
| Males: | 35 |
| Females: | 27 |
Median age
| Males: | 38.7 years |
| Females: | 46.4 years |
Average estimated value of detached houses in 2021 (95.8% of all units):
| Canter Wood: | $421,431 |
| Vancouver: | $457,784 |
Most popular occupations of males: service occupations (21.0%); sales and office occupations (20.4%); construction, extraction, and maintenance occupations (18.0%); management occupations (except farmers) (10.2%); arts, design, entertainment, sports, and media occupations (9.4%); production occupations (8.0%); material moving occupations (4.9%)
Most popular occupations of females: business and financial operations occupations (27.1%); service occupations (19.7%); education, training, and library occupations (11.3%); healthcare practitioners and technical occupations (9.3%); sales and office occupations (8.8%); computer and mathematical occupations (8.3%); architecture and engineering occupations (4.1%)
Roads and streets: NE 105th Cir; NE 33rd Ave; NE 104th Cir.
Canter Wood neighborhood detailed profile
Canyon Crest neighborhood in Vancouver statistics: (Find on map)
Area: 0.027 square miles
Population: 103
Population density:
Median household income in 2021:
Median rent in in 2021:
Male vs Females
Median age
Average estimated value of detached houses in 2021 (97.7% of all units):
Most popular occupations of males: sales and office occupations (21.7%); management occupations (except farmers) (10.7%); material moving occupations (9.9%); business and financial operations occupations (8.8%); education, training, and library occupations (7.5%); arts, design, entertainment, sports, and media occupations (6.6%); architecture and engineering occupations (6.3%)
Most popular occupations of females: education, training, and library occupations (25.9%); sales and office occupations (19.4%); arts, design, entertainment, sports, and media occupations (18.2%); service occupations (15.1%); healthcare practitioners and technical occupations (13.7%); management occupations (except farmers) (11.8%); business and financial operations occupations (6.9%)
Roads and streets: NW Overlook Dr; NW Canyon Crst Lp.
Canyon Crest neighborhood detailed profile
Area: 0.027 square miles
Population: 103
Population density:
| Canyon Crest: | 3,816 people per square mile |
| Vancouver: | 4,491 people per square mile |
Median household income in 2021:
| Canyon Crest: | $95,348 |
| Vancouver: | $69,993 |
Median rent in in 2021:
| Canyon Crest: | $867 |
| Vancouver: | $1,311 |
Male vs Females
| Males: | 60 |
| Females: | 43 |
Median age
| Males: | 38.9 years |
| Females: | 50.9 years |
Average estimated value of detached houses in 2021 (97.7% of all units):
| Canyon Crest: | $354,525 |
| Vancouver: | $457,784 |
Most popular occupations of males: sales and office occupations (21.7%); management occupations (except farmers) (10.7%); material moving occupations (9.9%); business and financial operations occupations (8.8%); education, training, and library occupations (7.5%); arts, design, entertainment, sports, and media occupations (6.6%); architecture and engineering occupations (6.3%)
Most popular occupations of females: education, training, and library occupations (25.9%); sales and office occupations (19.4%); arts, design, entertainment, sports, and media occupations (18.2%); service occupations (15.1%); healthcare practitioners and technical occupations (13.7%); management occupations (except farmers) (11.8%); business and financial operations occupations (6.9%)
Roads and streets: NW Overlook Dr; NW Canyon Crst Lp.
Canyon Crest neighborhood detailed profile
Canyon Ridge neighborhood in Vancouver statistics: (Find on map)
Area: 0.007 square miles
Canyon Ridge neighborhood detailed profile
Area: 0.007 square miles
Canyon Ridge neighborhood detailed profile
Capitol Hills neighborhood in Vancouver statistics: (Find on map)
Area: 0.007 square miles
Population: 43
Population density:
Median household income in 2021:
Median rent in in 2021:
Male vs Females
Median age
Average estimated value of detached houses in 2021 (80.0% of all units):
Most popular occupations of males: management occupations (except farmers) (27.5%); sales and office occupations (12.3%); service occupations (10.4%); healthcare practitioners and technical occupations (9.7%); construction, extraction, and maintenance occupations (7.8%); material moving occupations (7.8%); computer and mathematical occupations (6.7%)
Most popular occupations of females: management occupations (except farmers) (23.2%); sales and office occupations (19.9%); education, training, and library occupations (15.5%); business and financial operations occupations (12.2%); service occupations (12.2%); community and social services occupations (6.1%); life, physical, and social science occupations (4.4%)
Capitol Hills neighborhood detailed profile
Area: 0.007 square miles
Population: 43
Population density:
| Capitol Hills: | 5,882 people per square mile |
| Vancouver: | 4,491 people per square mile |
Median household income in 2021:
| Capitol Hills: | $83,750 |
| Vancouver: | $69,993 |
Median rent in in 2021:
| Capitol Hills: | $1,204 |
| Vancouver: | $1,311 |
Male vs Females
| Males: | 24 |
| Females: | 19 |
Median age
| Males: | 31.8 years |
| Females: | 39.0 years |
Average estimated value of detached houses in 2021 (80.0% of all units):
| Capitol Hills: | $355,384 |
| Vancouver: | $457,784 |
Most popular occupations of males: management occupations (except farmers) (27.5%); sales and office occupations (12.3%); service occupations (10.4%); healthcare practitioners and technical occupations (9.7%); construction, extraction, and maintenance occupations (7.8%); material moving occupations (7.8%); computer and mathematical occupations (6.7%)
Most popular occupations of females: management occupations (except farmers) (23.2%); sales and office occupations (19.9%); education, training, and library occupations (15.5%); business and financial operations occupations (12.2%); service occupations (12.2%); community and social services occupations (6.1%); life, physical, and social science occupations (4.4%)
Capitol Hills neighborhood detailed profile
Capri Hill neighborhood in Vancouver statistics: (Find on map)
Area: 0.010 square miles
Population: 42
Population density:
Median household income in 2021:
Median rent in in 2021:
Male vs Females
Median age
Average estimated value of detached houses in 2021 (100.0% of all units):
Most popular occupations of males: sales and office occupations (21.0%); construction, extraction, and maintenance occupations (21.0%); architecture and engineering occupations (12.3%); production occupations (11.1%); computer and mathematical occupations (8.5%); material moving occupations (7.2%); education, training, and library occupations (6.9%)
Most popular occupations of females: sales and office occupations (40.3%); computer and mathematical occupations (21.4%); service occupations (17.9%); education, training, and library occupations (13.3%); management occupations (except farmers) (6.5%); business and financial operations occupations (5.7%); community and social services occupations (5.7%)
Roads and streets: NW 90th St; NW 19th Ct.
Capri Hill neighborhood detailed profile
Area: 0.010 square miles
Population: 42
Population density:
| Capri Hill: | 4,045 people per square mile |
| Vancouver: | 4,491 people per square mile |
Median household income in 2021:
| Capri Hill: | $88,250 |
| Vancouver: | $69,993 |
Median rent in in 2021:
| Capri Hill: | $1,693 |
| Vancouver: | $1,311 |
Male vs Females
| Males: | 23 |
| Females: | 19 |
Median age
| Males: | 37.5 years |
| Females: | 39.8 years |
Average estimated value of detached houses in 2021 (100.0% of all units):
| Capri Hill: | $322,790 |
| Vancouver: | $457,784 |
Most popular occupations of males: sales and office occupations (21.0%); construction, extraction, and maintenance occupations (21.0%); architecture and engineering occupations (12.3%); production occupations (11.1%); computer and mathematical occupations (8.5%); material moving occupations (7.2%); education, training, and library occupations (6.9%)
Most popular occupations of females: sales and office occupations (40.3%); computer and mathematical occupations (21.4%); service occupations (17.9%); education, training, and library occupations (13.3%); management occupations (except farmers) (6.5%); business and financial operations occupations (5.7%); community and social services occupations (5.7%)
Roads and streets: NW 90th St; NW 19th Ct.
Capri Hill neighborhood detailed profile
Capris Hill Terrace neighborhood in Vancouver statistics: (Find on map)
Area: 0.004 square miles
Population: 17
Population density:
Median household income in 2021:
Median rent in in 2021:
Male vs Females
Median age
Average estimated value of detached houses in 2021 (100.0% of all units):
Most popular occupations of males: construction, extraction, and maintenance occupations (20.9%); sales and office occupations (20.8%); architecture and engineering occupations (12.2%); production occupations (11.0%); material moving occupations (7.1%); education, training, and library occupations (6.8%); arts, design, entertainment, sports, and media occupations (6.8%)
Most popular occupations of females: sales and office occupations (39.9%); service occupations (17.8%); education, training, and library occupations (13.4%); management occupations (except farmers) (6.4%); business and financial operations occupations (5.7%); community and social services occupations (5.7%); material moving occupations (3.8%)
Capris Hill Terrace neighborhood detailed profile
Area: 0.004 square miles
Population: 17
Population density:
| Capris Hill Terrace: | 3,885 people per square mile |
| Vancouver: | 4,491 people per square mile |
Median household income in 2021:
| Capris Hill Terrace: | $116,019 |
| Vancouver: | $69,993 |
Median rent in in 2021:
| Capris Hill Terrace: | $1,690 |
| Vancouver: | $1,311 |
Male vs Females
| Males: | 9 |
| Females: | 8 |
Median age
| Males: | 41.4 years |
| Females: | 43.0 years |
Average estimated value of detached houses in 2021 (100.0% of all units):
| Capris Hill Terrace: | $324,515 |
| Vancouver: | $457,784 |
Most popular occupations of males: construction, extraction, and maintenance occupations (20.9%); sales and office occupations (20.8%); architecture and engineering occupations (12.2%); production occupations (11.0%); material moving occupations (7.1%); education, training, and library occupations (6.8%); arts, design, entertainment, sports, and media occupations (6.8%)
Most popular occupations of females: sales and office occupations (39.9%); service occupations (17.8%); education, training, and library occupations (13.4%); management occupations (except farmers) (6.4%); business and financial operations occupations (5.7%); community and social services occupations (5.7%); material moving occupations (3.8%)
Capris Hill Terrace neighborhood detailed profile
Carlson Estates neighborhood in Vancouver statistics: (Find on map)
Area: 0.008 square miles
Population: 26
Population density:
Median household income in 2021:
Median rent in in 2021:
Male vs Females
Median age
Housing prices:
Average estimated value of detached houses in 2021 (85.7% of all units):
Most popular occupations of males: management occupations (except farmers) (16.3%); sales and office occupations (16.3%); construction, extraction, and maintenance occupations (13.7%); transportation occupations (12.2%); computer and mathematical occupations (10.7%); education, training, and library occupations (7.5%); production occupations (5.9%)
Most popular occupations of females: sales and office occupations (45.3%); service occupations (23.2%); management occupations (except farmers) (9.4%); production occupations (7.6%); education, training, and library occupations (7.2%); healthcare practitioners and technical occupations (3.5%); material moving occupations (3.2%)
Roads and streets: NE 89th St; NE 89th Cir.
Carlson Estates neighborhood detailed profile
Area: 0.008 square miles
Population: 26
Population density:
| Carlson Estates: | 3,275 people per square mile |
| Vancouver: | 4,491 people per square mile |
Median household income in 2021:
| Carlson Estates: | $85,327 |
| Vancouver: | $69,993 |
Median rent in in 2021:
| Carlson Estates: | $1,432 |
| Vancouver: | $1,311 |
Male vs Females
| Males: | 13 |
| Females: | 13 |
Median age
| Males: | 34.2 years |
| Females: | 34.8 years |
Housing prices:
Average estimated value of detached houses in 2021 (85.7% of all units):
| Carlson Estates: | $327,634 |
| Vancouver: | $457,784 |
Most popular occupations of males: management occupations (except farmers) (16.3%); sales and office occupations (16.3%); construction, extraction, and maintenance occupations (13.7%); transportation occupations (12.2%); computer and mathematical occupations (10.7%); education, training, and library occupations (7.5%); production occupations (5.9%)
Most popular occupations of females: sales and office occupations (45.3%); service occupations (23.2%); management occupations (except farmers) (9.4%); production occupations (7.6%); education, training, and library occupations (7.2%); healthcare practitioners and technical occupations (3.5%); material moving occupations (3.2%)
Roads and streets: NE 89th St; NE 89th Cir.
Carlson Estates neighborhood detailed profile
Carlson Place neighborhood in Vancouver statistics: (Find on map)
Area: 0.001 square miles
Population: 1
Population density:
Median household income in 2021:
Median rent in in 2021:
Male vs Females
Median age
Most popular occupations of males: production occupations (21.2%); management occupations (except farmers) (17.2%); service occupations (12.5%); sales and office occupations (11.1%); transportation occupations (8.2%); construction, extraction, and maintenance occupations (6.6%); computer and mathematical occupations (2.9%)
Most popular occupations of females: sales and office occupations (50.6%); management occupations (except farmers) (39.8%); service occupations (15.7%); production occupations (11.3%); business and financial operations occupations (9.6%); life, physical, and social science occupations (8.4%); healthcare practitioners and technical occupations (8.4%)
Carlson Place neighborhood detailed profile
Area: 0.001 square miles
Population: 1
Population density:
| Carlson Place: | 715 people per square mile |
| Vancouver: | 4,491 people per square mile |
Median household income in 2021:
| Carlson Place: | $102,167 |
| Vancouver: | $69,993 |
Median rent in in 2021:
| Carlson Place: | $1,505 |
| Vancouver: | $1,311 |
Male vs Females
| Males: | 1 |
| Females: | 0 |
Median age
| Males: | 35.7 years |
| Females: | 59.7 years |
Most popular occupations of males: production occupations (21.2%); management occupations (except farmers) (17.2%); service occupations (12.5%); sales and office occupations (11.1%); transportation occupations (8.2%); construction, extraction, and maintenance occupations (6.6%); computer and mathematical occupations (2.9%)
Most popular occupations of females: sales and office occupations (50.6%); management occupations (except farmers) (39.8%); service occupations (15.7%); production occupations (11.3%); business and financial operations occupations (9.6%); life, physical, and social science occupations (8.4%); healthcare practitioners and technical occupations (8.4%)
Carlson Place neighborhood detailed profile
Carmina Estates neighborhood in Vancouver statistics: (Find on map)
Area: 0.004 square miles
Population: 15
Population density:
Median household income in 2021:
Median rent in in 2021:
Male vs Females
Median age
Most popular occupations of males: service occupations (19.0%); production occupations (11.3%); architecture and engineering occupations (10.6%); business and financial operations occupations (9.8%); computer and mathematical occupations (9.2%); management occupations (except farmers) (7.1%); construction, extraction, and maintenance occupations (7.0%)
Most popular occupations of females: service occupations (23.8%); sales and office occupations (20.1%); education, training, and library occupations (13.3%); management occupations (except farmers) (11.2%); arts, design, entertainment, sports, and media occupations (8.3%); transportation occupations (4.8%); healthcare practitioners and technical occupations (4.6%)
Carmina Estates neighborhood detailed profile
Area: 0.004 square miles
Population: 15
Population density:
| Carmina Estates: | 3,423 people per square mile |
| Vancouver: | 4,491 people per square mile |
Median household income in 2021:
| Carmina Estates: | $145,489 |
| Vancouver: | $69,993 |
Median rent in in 2021:
| Carmina Estates: | $1,669 |
| Vancouver: | $1,311 |
Male vs Females
| Males: | 7 |
| Females: | 7 |
Median age
| Males: | 42.5 years |
| Females: | 37.4 years |
Most popular occupations of males: service occupations (19.0%); production occupations (11.3%); architecture and engineering occupations (10.6%); business and financial operations occupations (9.8%); computer and mathematical occupations (9.2%); management occupations (except farmers) (7.1%); construction, extraction, and maintenance occupations (7.0%)
Most popular occupations of females: service occupations (23.8%); sales and office occupations (20.1%); education, training, and library occupations (13.3%); management occupations (except farmers) (11.2%); arts, design, entertainment, sports, and media occupations (8.3%); transportation occupations (4.8%); healthcare practitioners and technical occupations (4.6%)
Carmina Estates neighborhood detailed profile
Carrell Estates neighborhood in Vancouver statistics: (Find on map)
Area: 0.002 square miles
Carrell Estates neighborhood detailed profile
Area: 0.002 square miles
Carrell Estates neighborhood detailed profile
Carriage House Estates neighborhood in Vancouver statistics: (Find on map)
Area: 0.021 square miles
Roads and streets: NE 66th St; NE 20th Ave; NE 19th Ave; NE 67th St; NE 66th Cir.
Carriage House Estates neighborhood detailed profile
Area: 0.021 square miles
Roads and streets: NE 66th St; NE 20th Ave; NE 19th Ave; NE 67th St; NE 66th Cir.
Carriage House Estates neighborhood detailed profile
Carson Heights neighborhood in Vancouver statistics: (Find on map)
Area: 0.045 square miles
Population: 123
Population density:
Median household income in 2021:
Median rent in in 2021:
Male vs Females
Median age
Average estimated value of detached houses in 2021 (87.2% of all units):
Most popular occupations of males: transportation occupations (38.7%); management occupations (except farmers) (22.7%); production occupations (14.5%); material moving occupations (12.0%); service occupations (7.6%); education, training, and library occupations (4.3%); healthcare practitioners and technical occupations (1.9%)
Most popular occupations of females: management occupations (except farmers) (39.8%); service occupations (27.6%); education, training, and library occupations (15.1%); computer and mathematical occupations (10.6%); sales and office occupations (6.7%); legal occupations (4.9%)
Roads and streets: NE 42nd St; NE 42nd Ave.
Carson Heights neighborhood detailed profile
Area: 0.045 square miles
Population: 123
Population density:
| Carson Heights: | 2,732 people per square mile |
| Vancouver: | 4,491 people per square mile |
Median household income in 2021:
| Carson Heights: | $121,373 |
| Vancouver: | $69,993 |
Median rent in in 2021:
| Carson Heights: | $1,776 |
| Vancouver: | $1,311 |
Male vs Females
| Males: | 53 |
| Females: | 69 |
Median age
| Males: | 40.9 years |
| Females: | 36.3 years |
Average estimated value of detached houses in 2021 (87.2% of all units):
| Carson Heights: | $330,882 |
| Vancouver: | $457,784 |
Most popular occupations of males: transportation occupations (38.7%); management occupations (except farmers) (22.7%); production occupations (14.5%); material moving occupations (12.0%); service occupations (7.6%); education, training, and library occupations (4.3%); healthcare practitioners and technical occupations (1.9%)
Most popular occupations of females: management occupations (except farmers) (39.8%); service occupations (27.6%); education, training, and library occupations (15.1%); computer and mathematical occupations (10.6%); sales and office occupations (6.7%); legal occupations (4.9%)
Roads and streets: NE 42nd St; NE 42nd Ave.
Carson Heights neighborhood detailed profile
Carter Park neighborhood in Vancouver statistics: (Find on map)
Area: 0.331 square miles
Population: 1,829
Population density:
Median household income in 2021:
Median rent in in 2021:
Male vs Females
Median age
Housing prices:
Average estimated value of detached houses in 2021 (58.7% of all units):
Most popular occupations of males: service occupations (17.8%); sales and office occupations (13.2%); transportation occupations (11.3%); management occupations (except farmers) (8.5%); construction, extraction, and maintenance occupations (8.3%); production occupations (7.3%); computer and mathematical occupations (6.3%)
Most popular occupations of females: sales and office occupations (23.2%); management occupations (except farmers) (21.6%); service occupations (16.0%); education, training, and library occupations (9.6%); healthcare practitioners and technical occupations (8.8%); business and financial operations occupations (6.3%); arts, design, entertainment, sports, and media occupations (5.5%)
Highways in this neighborhood: W Fourth Plain Blvd (State Rte 501).
Roads and streets: W 29th St; W 30th St; W 31st St; W 33rd St; W 32nd St; W 27th St; W 28th St; Corbett Ave; NW Daniels St (Daniels St); Harney St; NW Kauffman Ave (Kauffman Ave); NW Grant St (Grant St); Franklin St; Main St; Washington St; Columbia St; W Lincoln Ave; Division Ave; E 33rd St; E 32nd St; Esther St; Carter Park (Columbia St); E 31st St; Lincoln Ave; W 32nd Cir; W Cherry St; Scott St; W 32nd Pl; E 30th St; Olive St; Cherry St; 31st St.
Railroad features: Union Pacific RR (Burlington Northern Santa Fe Rlwy).
Carter Park neighborhood detailed profile
Area: 0.331 square miles
Population: 1,829
Population density:
| Carter Park: | 5,521 people per square mile |
| Vancouver: | 4,491 people per square mile |
Median household income in 2021:
| Carter Park: | $93,830 |
| Vancouver: | $69,993 |
Median rent in in 2021:
| Carter Park: | $1,504 |
| Vancouver: | $1,311 |
Male vs Females
| Males: | 896 |
| Females: | 932 |
Median age
| Males: | 49.4 years |
| Females: | 49.9 years |
Housing prices:
Average estimated value of detached houses in 2021 (58.7% of all units):
| Carter Park: | $295,337 |
| Vancouver: | $457,784 |
Most popular occupations of males: service occupations (17.8%); sales and office occupations (13.2%); transportation occupations (11.3%); management occupations (except farmers) (8.5%); construction, extraction, and maintenance occupations (8.3%); production occupations (7.3%); computer and mathematical occupations (6.3%)
Most popular occupations of females: sales and office occupations (23.2%); management occupations (except farmers) (21.6%); service occupations (16.0%); education, training, and library occupations (9.6%); healthcare practitioners and technical occupations (8.8%); business and financial operations occupations (6.3%); arts, design, entertainment, sports, and media occupations (5.5%)
Highways in this neighborhood: W Fourth Plain Blvd (State Rte 501).
Roads and streets: W 29th St; W 30th St; W 31st St; W 33rd St; W 32nd St; W 27th St; W 28th St; Corbett Ave; NW Daniels St (Daniels St); Harney St; NW Kauffman Ave (Kauffman Ave); NW Grant St (Grant St); Franklin St; Main St; Washington St; Columbia St; W Lincoln Ave; Division Ave; E 33rd St; E 32nd St; Esther St; Carter Park (Columbia St); E 31st St; Lincoln Ave; W 32nd Cir; W Cherry St; Scott St; W 32nd Pl; E 30th St; Olive St; Cherry St; 31st St.
Railroad features: Union Pacific RR (Burlington Northern Santa Fe Rlwy).
Carter Park neighborhood detailed profile
Casa Mia neighborhood in Vancouver statistics: (Find on map)
Area: 0.014 square miles
Population: 52
Population density:
Median household income in 2021:
Median rent in in 2021:
Male vs Females
Median age
Most popular occupations of males: sales and office occupations (23.0%); construction, extraction, and maintenance occupations (17.1%); service occupations (13.6%); healthcare practitioners and technical occupations (8.0%); transportation occupations (7.8%); business and financial operations occupations (7.2%); management occupations (except farmers) (6.6%)
Most popular occupations of females: service occupations (35.2%); sales and office occupations (28.2%); healthcare practitioners and technical occupations (8.7%); education, training, and library occupations (8.3%); production occupations (6.0%); management occupations (except farmers) (5.8%); business and financial operations occupations (3.7%)
Roads and streets: NE 11th Cir; NE 154th Ave.
Casa Mia neighborhood detailed profile
Area: 0.014 square miles
Population: 52
Population density:
| Casa Mia: | 3,847 people per square mile |
| Vancouver: | 4,491 people per square mile |
Median household income in 2021:
| Casa Mia: | $92,813 |
| Vancouver: | $69,993 |
Median rent in in 2021:
| Casa Mia: | $1,067 |
| Vancouver: | $1,311 |
Male vs Females
| Males: | 25 |
| Females: | 27 |
Median age
| Males: | 52.6 years |
| Females: | 50.6 years |
Most popular occupations of males: sales and office occupations (23.0%); construction, extraction, and maintenance occupations (17.1%); service occupations (13.6%); healthcare practitioners and technical occupations (8.0%); transportation occupations (7.8%); business and financial operations occupations (7.2%); management occupations (except farmers) (6.6%)
Most popular occupations of females: service occupations (35.2%); sales and office occupations (28.2%); healthcare practitioners and technical occupations (8.7%); education, training, and library occupations (8.3%); production occupations (6.0%); management occupations (except farmers) (5.8%); business and financial operations occupations (3.7%)
Roads and streets: NE 11th Cir; NE 154th Ave.
Casa Mia neighborhood detailed profile
Casandra Meadows neighborhood in Vancouver statistics: (Find on map)
Area: 0.004 square miles
Roads and streets: NE 100th Cir; NE Banton Dr.
Casandra Meadows neighborhood detailed profile
Area: 0.004 square miles
Roads and streets: NE 100th Cir; NE Banton Dr.
Casandra Meadows neighborhood detailed profile
Cascade Business Center neighborhood in Vancouver statistics: (Find on map)
Area: 0.019 square miles
Population: 69
Population density:
Median household income in 2021:
Median rent in in 2021:
Male vs Females
Median age
Housing prices:
Average estimated value of detached houses in 2021 (40.6% of all units):
Average estimated value of townhouses or other attached units in 2021 (6.3% of all units):
Average estimated '21 value of housing units in 5-or-more-unit structures (21.9% of all units):
Most popular occupations of males: sales and office occupations (23.2%); material moving occupations (11.6%); education, training, and library occupations (11.4%); service occupations (9.3%); healthcare practitioners and technical occupations (8.8%); management occupations (except farmers) (7.4%); construction, extraction, and maintenance occupations (7.2%)
Most popular occupations of females: sales and office occupations (29.2%); service occupations (21.1%); management occupations (except farmers) (20.7%); production occupations (12.8%); computer and mathematical occupations (6.7%); business and financial operations occupations (6.6%); material moving occupations (6.1%)
Cascade Business Center neighborhood detailed profile
Area: 0.019 square miles
Population: 69
Population density:
| Cascade Business Center: | 3,713 people per square mile |
| Vancouver: | 4,491 people per square mile |
Median household income in 2021:
| Cascade Business Center: | $57,315 |
| Vancouver: | $69,993 |
Median rent in in 2021:
| Cascade Business Center: | $1,452 |
| Vancouver: | $1,311 |
Male vs Females
| Males: | 33 |
| Females: | 36 |
Median age
| Males: | 41.5 years |
| Females: | 40.8 years |
Housing prices:
Average estimated value of detached houses in 2021 (40.6% of all units):
| Cascade Business Center: | $358,905 |
| Vancouver: | $457,784 |
Average estimated value of townhouses or other attached units in 2021 (6.3% of all units):
| This neighborhood: | $255,918 |
| city: | $310,311 |
Average estimated '21 value of housing units in 5-or-more-unit structures (21.9% of all units):
| Cascade Business Center: | $290,545 |
| Vancouver: | $351,621 |
Most popular occupations of males: sales and office occupations (23.2%); material moving occupations (11.6%); education, training, and library occupations (11.4%); service occupations (9.3%); healthcare practitioners and technical occupations (8.8%); management occupations (except farmers) (7.4%); construction, extraction, and maintenance occupations (7.2%)
Most popular occupations of females: sales and office occupations (29.2%); service occupations (21.1%); management occupations (except farmers) (20.7%); production occupations (12.8%); computer and mathematical occupations (6.7%); business and financial operations occupations (6.6%); material moving occupations (6.1%)
Cascade Business Center neighborhood detailed profile
Cascade East neighborhood in Vancouver statistics: (Find on map)
Area: 0.011 square miles
Population: 12
Population density:
Median household income in 2021:
Median rent in in 2021:
Male vs Females
Median age
Housing prices:
Average estimated value of detached houses in 2021 (75.0% of all units):
Average estimated value of townhouses or other attached units in 2021 (12.5% of all units):
Most popular occupations of males: management occupations (except farmers) (54.6%); service occupations (53.0%); production occupations (32.6%); computer and mathematical occupations (20.6%); sales and office occupations (20.0%); business and financial operations occupations (16.0%); material moving occupations (16.0%)
Most popular occupations of females: sales and office occupations (27.6%); transportation occupations (25.8%); legal occupations (22.1%); business and financial operations occupations (20.1%); service occupations (14.1%); healthcare practitioners and technical occupations (12.8%); management occupations (except farmers) (10.4%)
Roads and streets: SE 4th St; SE 5th St; SE 158th Ave; SE 160th Ave.
Cascade East neighborhood detailed profile
Area: 0.011 square miles
Population: 12
Population density:
| Cascade East: | 1,077 people per square mile |
| Vancouver: | 4,491 people per square mile |
Median household income in 2021:
| Cascade East: | $71,354 |
| Vancouver: | $69,993 |
Median rent in in 2021:
| Cascade East: | $1,514 |
| Vancouver: | $1,311 |
Male vs Females
| Males: | 6 |
| Females: | 6 |
Median age
| Males: | 37.5 years |
| Females: | 34.6 years |
Housing prices:
Average estimated value of detached houses in 2021 (75.0% of all units):
| Cascade East: | $332,538 |
| Vancouver: | $457,784 |
Average estimated value of townhouses or other attached units in 2021 (12.5% of all units):
| This neighborhood: | $73,757 |
| city: | $310,311 |
Most popular occupations of males: management occupations (except farmers) (54.6%); service occupations (53.0%); production occupations (32.6%); computer and mathematical occupations (20.6%); sales and office occupations (20.0%); business and financial operations occupations (16.0%); material moving occupations (16.0%)
Most popular occupations of females: sales and office occupations (27.6%); transportation occupations (25.8%); legal occupations (22.1%); business and financial operations occupations (20.1%); service occupations (14.1%); healthcare practitioners and technical occupations (12.8%); management occupations (except farmers) (10.4%)
Roads and streets: SE 4th St; SE 5th St; SE 158th Ave; SE 160th Ave.
Cascade East neighborhood detailed profile
Cascade Highlands neighborhood in Vancouver statistics: (Find on map)
Area: 0.575 square miles
Population: 1,877
Population density:
Median household income in 2021:
Median rent in in 2021:
Male vs Females
Median age
Housing prices:
Average estimated value of detached houses in 2021 (92.6% of all units):
Average estimated value of townhouses or other attached units in 2021 (52.5% of all units):
Average estimated '21 value of housing units in 3-to-4-unit structures (4.5% of all units):
Average estimated '21 value of housing units in 5-or-more-unit structures (7.7% of all units):
Most popular occupations of males: production occupations (28.5%); management occupations (except farmers) (15.9%); sales and office occupations (11.5%); construction, extraction, and maintenance occupations (11.4%); life, physical, and social science occupations (6.3%); service occupations (5.8%); material moving occupations (5.3%)
Most popular occupations of females: service occupations (31.5%); sales and office occupations (23.7%); healthcare practitioners and technical occupations (18.1%); business and financial operations occupations (16.5%); management occupations (except farmers) (4.0%); education, training, and library occupations (3.5%); arts, design, entertainment, sports, and media occupations (1.8%)
Roads and streets: SE 15th St; SE Park Crest Ave; SE 160th Ave; SE Stevenson Dr; SE Briarwood Dr; SE 12th St; SE Meadow Park Dr; SE 164th Ave; SE Sunpark Dr; SE Greenpark St; SE 163rd Pl; SE 14th St; SE 158th Loop; SE Meadow Park Cir; SE Village Loop; SE Solomon Loop; SE 158th Ave; SE 16th St; SE 163rd Ave; SE 161st Pl; SE 159th Pl; SE 154th Ave; SE 19th St; SE 159th Ave; SE 17th St; SE 153rd Ave; SE 160th Pl; SE 13th Cir; SE 18th St; SE 155th Ave; SE 162nd Ave; SE 152nd Ave; SE 12th Cir; SE Greenpark Cir; SE Sun Park Ct; SE 18th Way; SE 18th Cir; SE 13th St; SE Blairmont Dr; SE 22nd St; SE 156th Ave; SE 17th Way; SE 8th St; SE 156th Ct; SE 19th Cir; SE 152nd Ct; SE 158th Ct; SE 20th Cir; SE 11th Cir; SE 159th Ct.
Cascade Highlands neighborhood detailed profile
Area: 0.575 square miles
Population: 1,877
Population density:
| Cascade Highlands: | 3,263 people per square mile |
| Vancouver: | 4,491 people per square mile |
Median household income in 2021:
| Cascade Highlands: | $85,442 |
| Vancouver: | $69,993 |
Median rent in in 2021:
| Cascade Highlands: | $1,175 |
| Vancouver: | $1,311 |
Male vs Females
| Males: | 935 |
| Females: | 942 |
Median age
| Males: | 47.9 years |
| Females: | 59.0 years |
Housing prices:
Average estimated value of detached houses in 2021 (92.6% of all units):
| Cascade Highlands: | $342,839 |
| Vancouver: | $457,784 |
Average estimated value of townhouses or other attached units in 2021 (52.5% of all units):
| This neighborhood: | $326,562 |
| city: | $310,311 |
Average estimated '21 value of housing units in 3-to-4-unit structures (4.5% of all units):
| Cascade Highlands: | $263,718 |
| city: | $1,050,955 |
Average estimated '21 value of housing units in 5-or-more-unit structures (7.7% of all units):
| Cascade Highlands: | $319,000 |
| Vancouver: | $351,621 |
Most popular occupations of males: production occupations (28.5%); management occupations (except farmers) (15.9%); sales and office occupations (11.5%); construction, extraction, and maintenance occupations (11.4%); life, physical, and social science occupations (6.3%); service occupations (5.8%); material moving occupations (5.3%)
Most popular occupations of females: service occupations (31.5%); sales and office occupations (23.7%); healthcare practitioners and technical occupations (18.1%); business and financial operations occupations (16.5%); management occupations (except farmers) (4.0%); education, training, and library occupations (3.5%); arts, design, entertainment, sports, and media occupations (1.8%)
Roads and streets: SE 15th St; SE Park Crest Ave; SE 160th Ave; SE Stevenson Dr; SE Briarwood Dr; SE 12th St; SE Meadow Park Dr; SE 164th Ave; SE Sunpark Dr; SE Greenpark St; SE 163rd Pl; SE 14th St; SE 158th Loop; SE Meadow Park Cir; SE Village Loop; SE Solomon Loop; SE 158th Ave; SE 16th St; SE 163rd Ave; SE 161st Pl; SE 159th Pl; SE 154th Ave; SE 19th St; SE 159th Ave; SE 17th St; SE 153rd Ave; SE 160th Pl; SE 13th Cir; SE 18th St; SE 155th Ave; SE 162nd Ave; SE 152nd Ave; SE 12th Cir; SE Greenpark Cir; SE Sun Park Ct; SE 18th Way; SE 18th Cir; SE 13th St; SE Blairmont Dr; SE 22nd St; SE 156th Ave; SE 17th Way; SE 8th St; SE 156th Ct; SE 19th Cir; SE 152nd Ct; SE 158th Ct; SE 20th Cir; SE 11th Cir; SE 159th Ct.
Cascade Highlands neighborhood detailed profile
Cascade Landing Business Park neighborhood in Vancouver statistics: (Find on map)
Area: 0.019 square miles
Population: 45
Population density:
Median household income in 2021:
Median rent in in 2021:
Male vs Females
Median age
Average estimated value of detached houses in 2021 (100.0% of all units):
Most popular occupations of males: production occupations (36.1%); management occupations (except farmers) (20.8%); construction, extraction, and maintenance occupations (18.4%); computer and mathematical occupations (10.1%); healthcare practitioners and technical occupations (6.0%); sales and office occupations (5.9%); life, physical, and social science occupations (5.1%)
Most popular occupations of females: service occupations (34.9%); healthcare practitioners and technical occupations (30.2%); sales and office occupations (27.3%); arts, design, entertainment, sports, and media occupations (8.8%); production occupations (4.8%); business and financial operations occupations (4.4%); management occupations (except farmers) (4.3%)
Roads and streets: SE 163rd Ave; SE 162nd Ave; SE 14th St.
Cascade Landing Business Park neighborhood detailed profile
Area: 0.019 square miles
Population: 45
Population density:
| Cascade Landing Business Park: | 2,377 people per square mile |
| Vancouver: | 4,491 people per square mile |
Median household income in 2021:
| Cascade Landing Business Park: | $94,185 |
| Vancouver: | $69,993 |
Median rent in in 2021:
| Cascade Landing Business Park: | $1,290 |
| Vancouver: | $1,311 |
Male vs Females
| Males: | 24 |
| Females: | 21 |
Median age
| Males: | 26.8 years |
| Females: | 42.5 years |
Average estimated value of detached houses in 2021 (100.0% of all units):
| Cascade Landing Business Park: | $328,350 |
| Vancouver: | $457,784 |
Most popular occupations of males: production occupations (36.1%); management occupations (except farmers) (20.8%); construction, extraction, and maintenance occupations (18.4%); computer and mathematical occupations (10.1%); healthcare practitioners and technical occupations (6.0%); sales and office occupations (5.9%); life, physical, and social science occupations (5.1%)
Most popular occupations of females: service occupations (34.9%); healthcare practitioners and technical occupations (30.2%); sales and office occupations (27.3%); arts, design, entertainment, sports, and media occupations (8.8%); production occupations (4.8%); business and financial operations occupations (4.4%); management occupations (except farmers) (4.3%)
Roads and streets: SE 163rd Ave; SE 162nd Ave; SE 14th St.
Cascade Landing Business Park neighborhood detailed profile
Cascade Lane neighborhood in Vancouver statistics: (Find on map)
Area: 0.005 square miles
Population: 2
Population density:
Median household income in 2021:
Median rent in in 2021:
Male vs Females
Median age
Most popular occupations of males: sales and office occupations (17.3%); service occupations (12.7%); management occupations (except farmers) (12.1%); education, training, and library occupations (9.5%); production occupations (9.0%); material moving occupations (8.0%); healthcare practitioners and technical occupations (7.5%)
Most popular occupations of females: sales and office occupations (38.6%); service occupations (17.7%); management occupations (except farmers) (12.0%); healthcare practitioners and technical occupations (7.3%); transportation occupations (7.0%); education, training, and library occupations (6.0%); legal occupations (4.3%)
Roads and streets: NE 79th Way.
Cascade Lane neighborhood detailed profile
Area: 0.005 square miles
Population: 2
Population density:
| Cascade Lane: | 442 people per square mile |
| Vancouver: | 4,491 people per square mile |
Median household income in 2021:
| Cascade Lane: | $95,230 |
| Vancouver: | $69,993 |
Median rent in in 2021:
| Cascade Lane: | $1,750 |
| Vancouver: | $1,311 |
Male vs Females
| Males: | 1 |
| Females: | 1 |
Median age
| Males: | 29.1 years |
| Females: | 32.9 years |
Most popular occupations of males: sales and office occupations (17.3%); service occupations (12.7%); management occupations (except farmers) (12.1%); education, training, and library occupations (9.5%); production occupations (9.0%); material moving occupations (8.0%); healthcare practitioners and technical occupations (7.5%)
Most popular occupations of females: sales and office occupations (38.6%); service occupations (17.7%); management occupations (except farmers) (12.0%); healthcare practitioners and technical occupations (7.3%); transportation occupations (7.0%); education, training, and library occupations (6.0%); legal occupations (4.3%)
Roads and streets: NE 79th Way.
Cascade Lane neighborhood detailed profile
Cascade Manor neighborhood in Vancouver statistics: (Find on map)
Area: 0.006 square miles
Population: 23
Population density:
Median household income in 2021:
Median rent in in 2021:
Male vs Females
Median age
Housing prices:
Average estimated value of detached houses in 2021 (36.4% of all units):
Average estimated '21 value of housing units in 5-or-more-unit structures (18.2% of all units):
Most popular occupations of males: sales and office occupations (23.2%); material moving occupations (11.6%); education, training, and library occupations (11.4%); service occupations (9.3%); healthcare practitioners and technical occupations (8.8%); management occupations (except farmers) (7.4%); construction, extraction, and maintenance occupations (7.2%)
Most popular occupations of females: sales and office occupations (29.2%); service occupations (21.1%); management occupations (except farmers) (20.7%); production occupations (12.8%); computer and mathematical occupations (6.7%); business and financial operations occupations (6.6%); material moving occupations (6.1%)
Cascade Manor neighborhood detailed profile
Area: 0.006 square miles
Population: 23
Population density:
| Cascade Manor: | 3,688 people per square mile |
| Vancouver: | 4,491 people per square mile |
Median household income in 2021:
| Cascade Manor: | $57,315 |
| Vancouver: | $69,993 |
Median rent in in 2021:
| Cascade Manor: | $1,452 |
| Vancouver: | $1,311 |
Male vs Females
| Males: | 11 |
| Females: | 12 |
Median age
| Males: | 41.5 years |
| Females: | 40.8 years |
Housing prices:
Average estimated value of detached houses in 2021 (36.4% of all units):
| Cascade Manor: | $358,905 |
| Vancouver: | $457,784 |
Average estimated '21 value of housing units in 5-or-more-unit structures (18.2% of all units):
| Cascade Manor: | $290,545 |
| Vancouver: | $351,621 |
Most popular occupations of males: sales and office occupations (23.2%); material moving occupations (11.6%); education, training, and library occupations (11.4%); service occupations (9.3%); healthcare practitioners and technical occupations (8.8%); management occupations (except farmers) (7.4%); construction, extraction, and maintenance occupations (7.2%)
Most popular occupations of females: sales and office occupations (29.2%); service occupations (21.1%); management occupations (except farmers) (20.7%); production occupations (12.8%); computer and mathematical occupations (6.7%); business and financial operations occupations (6.6%); material moving occupations (6.1%)
Cascade Manor neighborhood detailed profile
Cascade Meadows neighborhood in Vancouver statistics: (Find on map)
Area: 0.032 square miles
Population: 204
Population density:
Median household income in 2021:
Median rent in in 2021:
Male vs Females
Median age
Most popular occupations of males: management occupations (except farmers) (20.1%); service occupations (19.6%); sales and office occupations (12.1%); computer and mathematical occupations (11.8%); healthcare practitioners and technical occupations (8.9%); construction, extraction, and maintenance occupations (8.3%); production occupations (6.5%)
Most popular occupations of females: sales and office occupations (34.5%); service occupations (24.2%); arts, design, entertainment, sports, and media occupations (12.5%); education, training, and library occupations (11.5%); production occupations (6.7%); healthcare practitioners and technical occupations (5.0%); business and financial operations occupations (3.0%)
Roads and streets: SE 8th St; SE 9th St; SE 7th Way; SE 7th St; SE 143rd Ave; SE 146th Ave; SE 147th Ave.
Cascade Meadows neighborhood detailed profile
Area: 0.032 square miles
Population: 204
Population density:
| Cascade Meadows: | 6,375 people per square mile |
| Vancouver: | 4,491 people per square mile |
Median household income in 2021:
| Cascade Meadows: | $48,777 |
| Vancouver: | $69,993 |
Median rent in in 2021:
| Cascade Meadows: | $1,175 |
| Vancouver: | $1,311 |
Male vs Females
| Males: | 101 |
| Females: | 103 |
Median age
| Males: | 32.6 years |
| Females: | 51.2 years |
Most popular occupations of males: management occupations (except farmers) (20.1%); service occupations (19.6%); sales and office occupations (12.1%); computer and mathematical occupations (11.8%); healthcare practitioners and technical occupations (8.9%); construction, extraction, and maintenance occupations (8.3%); production occupations (6.5%)
Most popular occupations of females: sales and office occupations (34.5%); service occupations (24.2%); arts, design, entertainment, sports, and media occupations (12.5%); education, training, and library occupations (11.5%); production occupations (6.7%); healthcare practitioners and technical occupations (5.0%); business and financial operations occupations (3.0%)
Roads and streets: SE 8th St; SE 9th St; SE 7th Way; SE 7th St; SE 143rd Ave; SE 146th Ave; SE 147th Ave.
Cascade Meadows neighborhood detailed profile
Cascade Park Manor neighborhood in Vancouver statistics: (Find on map)
Area: 0.061 square miles
Population: 658
Population density:
Median household income in 2021:
Median rent in in 2021:
Male vs Females
Median age
Average estimated value of detached houses in 2021 (35.9% of all units):
Most popular occupations of males: construction, extraction, and maintenance occupations (20.6%); service occupations (18.2%); sales and office occupations (9.4%); transportation occupations (9.4%); management occupations (except farmers) (8.8%); architecture and engineering occupations (5.6%); computer and mathematical occupations (5.3%)
Most popular occupations of females: service occupations (26.9%); sales and office occupations (23.9%); management occupations (except farmers) (23.3%); life, physical, and social science occupations (8.5%); education, training, and library occupations (3.7%); arts, design, entertainment, sports, and media occupations (3.0%); business and financial operations occupations (2.8%)
Roads and streets: SE Park St; SE 15th St; SE Cascade Ave (SE 131st Ave); SE Manor Ave; SE 19th St; SE 125th Ave; SE 126th Ave.
Cascade Park Manor neighborhood detailed profile
Area: 0.061 square miles
Population: 658
Population density:
| Cascade Park Manor: | 10,788 people per square mile |
| Vancouver: | 4,491 people per square mile |
Median household income in 2021:
| Cascade Park Manor: | $104,730 |
| Vancouver: | $69,993 |
Median rent in in 2021:
| Cascade Park Manor: | $1,375 |
| Vancouver: | $1,311 |
Male vs Females
| Males: | 309 |
| Females: | 349 |
Median age
| Males: | 46.0 years |
| Females: | 47.4 years |
Average estimated value of detached houses in 2021 (35.9% of all units):
| Cascade Park Manor: | $377,888 |
| Vancouver: | $457,784 |
Most popular occupations of males: construction, extraction, and maintenance occupations (20.6%); service occupations (18.2%); sales and office occupations (9.4%); transportation occupations (9.4%); management occupations (except farmers) (8.8%); architecture and engineering occupations (5.6%); computer and mathematical occupations (5.3%)
Most popular occupations of females: service occupations (26.9%); sales and office occupations (23.9%); management occupations (except farmers) (23.3%); life, physical, and social science occupations (8.5%); education, training, and library occupations (3.7%); arts, design, entertainment, sports, and media occupations (3.0%); business and financial operations occupations (2.8%)
Roads and streets: SE Park St; SE 15th St; SE Cascade Ave (SE 131st Ave); SE Manor Ave; SE 19th St; SE 125th Ave; SE 126th Ave.
Cascade Park Manor neighborhood detailed profile
Cascade Park Place neighborhood in Vancouver statistics: (Find on map)
Area: 0.014 square miles
Population: 28
Population density:
Median household income in 2021:
Median rent in in 2021:
Male vs Females
Median age
Housing prices:
Average estimated value of detached houses in 2021 (91.7% of all units):
Average estimated '21 value of housing units in 5-or-more-unit structures (41.7% of all units):
Most popular occupations of males: computer and mathematical occupations (15.6%); business and financial operations occupations (13.5%); sales and office occupations (13.5%); management occupations (except farmers) (11.7%); production occupations (10.0%); transportation occupations (7.0%); service occupations (4.3%)
Most popular occupations of females: healthcare practitioners and technical occupations (42.0%); sales and office occupations (16.3%); service occupations (14.5%); management occupations (except farmers) (7.7%); business and financial operations occupations (3.9%); education, training, and library occupations (3.8%); production occupations (3.8%)
Cascade Park Place neighborhood detailed profile
Area: 0.014 square miles
Population: 28
Population density:
| Cascade Park Place: | 2,011 people per square mile |
| Vancouver: | 4,491 people per square mile |
Median household income in 2021:
| Cascade Park Place: | $88,638 |
| Vancouver: | $69,993 |
Median rent in in 2021:
| Cascade Park Place: | $2,109 |
| Vancouver: | $1,311 |
Male vs Females
| Males: | 14 |
| Females: | 14 |
Median age
| Males: | 48.7 years |
| Females: | 48.5 years |
Housing prices:
Average estimated value of detached houses in 2021 (91.7% of all units):
| Cascade Park Place: | $235,060 |
| Vancouver: | $457,784 |
Average estimated '21 value of housing units in 5-or-more-unit structures (41.7% of all units):
| Cascade Park Place: | $290,545 |
| Vancouver: | $351,621 |
Most popular occupations of males: computer and mathematical occupations (15.6%); business and financial operations occupations (13.5%); sales and office occupations (13.5%); management occupations (except farmers) (11.7%); production occupations (10.0%); transportation occupations (7.0%); service occupations (4.3%)
Most popular occupations of females: healthcare practitioners and technical occupations (42.0%); sales and office occupations (16.3%); service occupations (14.5%); management occupations (except farmers) (7.7%); business and financial operations occupations (3.9%); education, training, and library occupations (3.8%); production occupations (3.8%)
Cascade Park Place neighborhood detailed profile
Cascade Park Terrace neighborhood in Vancouver statistics: (Find on map)
Area: 0.004 square miles
Population: 19
Population density:
Median household income in 2021:
Median rent in in 2021:
Male vs Females
Median age
Average estimated value of detached houses in 2021 (83.3% of all units):
Most popular occupations of males: sales and office occupations (17.7%); transportation occupations (17.5%); material moving occupations (17.0%); architecture and engineering occupations (8.9%); service occupations (7.7%); production occupations (7.2%); construction, extraction, and maintenance occupations (5.8%)
Most popular occupations of females: sales and office occupations (30.1%); service occupations (27.0%); healthcare practitioners and technical occupations (12.5%); education, training, and library occupations (10.1%); material moving occupations (5.7%); life, physical, and social science occupations (4.9%); transportation occupations (4.4%)
Cascade Park Terrace neighborhood detailed profile
Area: 0.004 square miles
Population: 19
Population density:
| Cascade Park Terrace: | 4,668 people per square mile |
| Vancouver: | 4,491 people per square mile |
Median household income in 2021:
| Cascade Park Terrace: | $98,393 |
| Vancouver: | $69,993 |
Median rent in in 2021:
| Cascade Park Terrace: | $1,363 |
| Vancouver: | $1,311 |
Male vs Females
| Males: | 10 |
| Females: | 9 |
Median age
| Males: | 35.5 years |
| Females: | 41.7 years |
Average estimated value of detached houses in 2021 (83.3% of all units):
| Cascade Park Terrace: | $449,235 |
| Vancouver: | $457,784 |
Most popular occupations of males: sales and office occupations (17.7%); transportation occupations (17.5%); material moving occupations (17.0%); architecture and engineering occupations (8.9%); service occupations (7.7%); production occupations (7.2%); construction, extraction, and maintenance occupations (5.8%)
Most popular occupations of females: sales and office occupations (30.1%); service occupations (27.0%); healthcare practitioners and technical occupations (12.5%); education, training, and library occupations (10.1%); material moving occupations (5.7%); life, physical, and social science occupations (4.9%); transportation occupations (4.4%)
Cascade Park Terrace neighborhood detailed profile
Cascade Place neighborhood in Vancouver statistics: (Find on map)
Area: 0.004 square miles
Population: 13
Population density:
Median household income in 2021:
Median rent in in 2021:
Male vs Females
Median age
Housing prices:
Average estimated value of detached houses in 2021 (33.3% of all units):
Average estimated '21 value of housing units in 5-or-more-unit structures (16.7% of all units):
Most popular occupations of males: sales and office occupations (23.2%); material moving occupations (11.6%); education, training, and library occupations (11.4%); service occupations (9.3%); healthcare practitioners and technical occupations (8.8%); management occupations (except farmers) (7.4%); construction, extraction, and maintenance occupations (7.2%)
Most popular occupations of females: sales and office occupations (29.2%); service occupations (21.1%); management occupations (except farmers) (20.7%); production occupations (12.8%); computer and mathematical occupations (6.7%); business and financial operations occupations (6.6%); material moving occupations (6.1%)
Cascade Place neighborhood detailed profile
Area: 0.004 square miles
Population: 13
Population density:
| Cascade Place: | 3,698 people per square mile |
| Vancouver: | 4,491 people per square mile |
Median household income in 2021:
| Cascade Place: | $57,315 |
| Vancouver: | $69,993 |
Median rent in in 2021:
| Cascade Place: | $1,452 |
| Vancouver: | $1,311 |
Male vs Females
| Males: | 6 |
| Females: | 7 |
Median age
| Males: | 41.5 years |
| Females: | 40.8 years |
Housing prices:
Average estimated value of detached houses in 2021 (33.3% of all units):
| Cascade Place: | $358,905 |
| Vancouver: | $457,784 |
Average estimated '21 value of housing units in 5-or-more-unit structures (16.7% of all units):
| Cascade Place: | $290,545 |
| Vancouver: | $351,621 |
Most popular occupations of males: sales and office occupations (23.2%); material moving occupations (11.6%); education, training, and library occupations (11.4%); service occupations (9.3%); healthcare practitioners and technical occupations (8.8%); management occupations (except farmers) (7.4%); construction, extraction, and maintenance occupations (7.2%)
Most popular occupations of females: sales and office occupations (29.2%); service occupations (21.1%); management occupations (except farmers) (20.7%); production occupations (12.8%); computer and mathematical occupations (6.7%); business and financial operations occupations (6.6%); material moving occupations (6.1%)
Cascade Place neighborhood detailed profile
Cascade Rest neighborhood in Vancouver statistics: (Find on map)
Area: 0.005 square miles
Population: 13
Population density:
Median household income in 2021:
Median rent in in 2021:
Male vs Females
Median age
Housing prices:
Average estimated value of detached houses in 2021 (16.7% of all units):
Most popular occupations of males: sales and office occupations (30.5%); service occupations (13.4%); construction, extraction, and maintenance occupations (8.9%); business and financial operations occupations (6.9%); education, training, and library occupations (6.9%); arts, design, entertainment, sports, and media occupations (5.7%); production occupations (4.3%)
Most popular occupations of females: service occupations (45.5%); sales and office occupations (42.7%); management occupations (except farmers) (12.7%); production occupations (12.0%); healthcare practitioners and technical occupations (11.8%); business and financial operations occupations (7.6%); education, training, and library occupations (5.4%)
Cascade Rest neighborhood detailed profile
Area: 0.005 square miles
Population: 13
Population density:
| Cascade Rest: | 2,405 people per square mile |
| Vancouver: | 4,491 people per square mile |
Median household income in 2021:
| Cascade Rest: | $55,588 |
| Vancouver: | $69,993 |
Median rent in in 2021:
| Cascade Rest: | $1,278 |
| Vancouver: | $1,311 |
Male vs Females
| Males: | 6 |
| Females: | 7 |
Median age
| Males: | 38.1 years |
| Females: | 46.2 years |
Housing prices:
Average estimated value of detached houses in 2021 (16.7% of all units):
| Cascade Rest: | $747,720 |
| Vancouver: | $457,784 |
Most popular occupations of males: sales and office occupations (30.5%); service occupations (13.4%); construction, extraction, and maintenance occupations (8.9%); business and financial operations occupations (6.9%); education, training, and library occupations (6.9%); arts, design, entertainment, sports, and media occupations (5.7%); production occupations (4.3%)
Most popular occupations of females: service occupations (45.5%); sales and office occupations (42.7%); management occupations (except farmers) (12.7%); production occupations (12.0%); healthcare practitioners and technical occupations (11.8%); business and financial operations occupations (7.6%); education, training, and library occupations (5.4%)
Cascade Rest neighborhood detailed profile
Cascade South East neighborhood in Vancouver statistics: (Find on map)
Area: 0.271 square miles
Population: 939
Population density:
Median household income in 2021:
Median rent in in 2021:
Male vs Females
Median age
Housing prices:
Average estimated value of detached houses in 2021 (81.9% of all units):
Average estimated value of townhouses or other attached units in 2021 (20.6% of all units):
Average estimated '21 value of housing units in 3-to-4-unit structures (7.0% of all units):
Average estimated '21 value of housing units in 5-or-more-unit structures (30.6% of all units):
Most popular occupations of males: business and financial operations occupations (49.4%); architecture and engineering occupations (10.4%); service occupations (8.3%); management occupations (except farmers) (8.1%); sales and office occupations (7.4%); healthcare practitioners and technical occupations (7.3%); arts, design, entertainment, sports, and media occupations (6.5%)
Most popular occupations of females: sales and office occupations (26.5%); community and social services occupations (19.4%); business and financial operations occupations (14.6%); education, training, and library occupations (11.1%); service occupations (10.8%); management occupations (except farmers) (8.4%); arts, design, entertainment, sports, and media occupations (4.6%)
Roads and streets: SE Briarwood Dr; SE Blairmont Dr; SE Graham Rd; SE Norelius Dr; SE 146th Ave; SE McGillivray Blvd; SE Park Crest Ave; SE Valencia Dr; SE 152nd Ave; SE 28th St; SE 150th Ave; SE 151st Ave; SE 24th St; SE Menlo Dr; SE 145th Ave; SE 149th Ave; SE 26th St; SE 147th Pl; SE 20th St; SE 27th Cir; SE 31st Way; SE 148th Ave; SE 149th Ct; SE 33rd Way; SE 29th St; SE 30th St; SE 22nd Cir; SE 25th St; SE 25th Cir; SE 147th Ct; SE 146th Pl; SE 24th Cir.
Cascade South East neighborhood detailed profile
Area: 0.271 square miles
Population: 939
Population density:
| Cascade South East: | 3,466 people per square mile |
| Vancouver: | 4,491 people per square mile |
Median household income in 2021:
| Cascade South East: | $82,961 |
| Vancouver: | $69,993 |
Median rent in in 2021:
| Cascade South East: | $1,126 |
| Vancouver: | $1,311 |
Male vs Females
| Males: | 474 |
| Females: | 464 |
Median age
| Males: | 53.9 years |
| Females: | 63.7 years |
Housing prices:
Average estimated value of detached houses in 2021 (81.9% of all units):
| Cascade South East: | $362,976 |
| Vancouver: | $457,784 |
Average estimated value of townhouses or other attached units in 2021 (20.6% of all units):
| This neighborhood: | $326,563 |
| city: | $310,311 |
Average estimated '21 value of housing units in 3-to-4-unit structures (7.0% of all units):
| Cascade South East: | $263,718 |
| city: | $1,050,955 |
Average estimated '21 value of housing units in 5-or-more-unit structures (30.6% of all units):
| Cascade South East: | $319,000 |
| Vancouver: | $351,621 |
Most popular occupations of males: business and financial operations occupations (49.4%); architecture and engineering occupations (10.4%); service occupations (8.3%); management occupations (except farmers) (8.1%); sales and office occupations (7.4%); healthcare practitioners and technical occupations (7.3%); arts, design, entertainment, sports, and media occupations (6.5%)
Most popular occupations of females: sales and office occupations (26.5%); community and social services occupations (19.4%); business and financial operations occupations (14.6%); education, training, and library occupations (11.1%); service occupations (10.8%); management occupations (except farmers) (8.4%); arts, design, entertainment, sports, and media occupations (4.6%)
Roads and streets: SE Briarwood Dr; SE Blairmont Dr; SE Graham Rd; SE Norelius Dr; SE 146th Ave; SE McGillivray Blvd; SE Park Crest Ave; SE Valencia Dr; SE 152nd Ave; SE 28th St; SE 150th Ave; SE 151st Ave; SE 24th St; SE Menlo Dr; SE 145th Ave; SE 149th Ave; SE 26th St; SE 147th Pl; SE 20th St; SE 27th Cir; SE 31st Way; SE 148th Ave; SE 149th Ct; SE 33rd Way; SE 29th St; SE 30th St; SE 22nd Cir; SE 25th St; SE 25th Cir; SE 147th Ct; SE 146th Pl; SE 24th Cir.
Cascade South East neighborhood detailed profile
Cascade Terrace neighborhood in Vancouver statistics: (Find on map)
Area: 0.014 square miles
Population: 55
Population density:
Median household income in 2021:
Median rent in in 2021:
Male vs Females
Median age
Average estimated value of detached houses in 2021 (75.0% of all units):
Most popular occupations of males: service occupations (27.9%); management occupations (except farmers) (15.6%); sales and office occupations (15.0%); production occupations (12.3%); material moving occupations (7.3%); healthcare practitioners and technical occupations (6.9%); construction, extraction, and maintenance occupations (6.5%)
Most popular occupations of females: service occupations (44.1%); sales and office occupations (14.6%); transportation occupations (14.6%); legal occupations (11.6%); business and financial operations occupations (6.5%); production occupations (5.8%); healthcare practitioners and technical occupations (5.0%)
Roads and streets: NE 154th Ct; NE 154th Ave.
Cascade Terrace neighborhood detailed profile
Area: 0.014 square miles
Population: 55
Population density:
| Cascade Terrace: | 3,807 people per square mile |
| Vancouver: | 4,491 people per square mile |
Median household income in 2021:
| Cascade Terrace: | $83,750 |
| Vancouver: | $69,993 |
Median rent in in 2021:
| Cascade Terrace: | $1,408 |
| Vancouver: | $1,311 |
Male vs Females
| Males: | 31 |
| Females: | 24 |
Median age
| Males: | 25.4 years |
| Females: | 30.3 years |
Average estimated value of detached houses in 2021 (75.0% of all units):
| Cascade Terrace: | $362,336 |
| Vancouver: | $457,784 |
Most popular occupations of males: service occupations (27.9%); management occupations (except farmers) (15.6%); sales and office occupations (15.0%); production occupations (12.3%); material moving occupations (7.3%); healthcare practitioners and technical occupations (6.9%); construction, extraction, and maintenance occupations (6.5%)
Most popular occupations of females: service occupations (44.1%); sales and office occupations (14.6%); transportation occupations (14.6%); legal occupations (11.6%); business and financial operations occupations (6.5%); production occupations (5.8%); healthcare practitioners and technical occupations (5.0%)
Roads and streets: NE 154th Ct; NE 154th Ave.
Cascade Terrace neighborhood detailed profile
Cascade View Estates neighborhood in Vancouver statistics: (Find on map)
Area: 0.032 square miles
Roads and streets: NE 36th St; NE 34th St; NE 35th St; NE 158th Ave; NE 157th Ave; NE 159th Ave; NE 158th Pl; NE 155th Ave.
Cascade View Estates neighborhood detailed profile
Area: 0.032 square miles
Roads and streets: NE 36th St; NE 34th St; NE 35th St; NE 158th Ave; NE 157th Ave; NE 159th Ave; NE 158th Pl; NE 155th Ave.
Cascade View Estates neighborhood detailed profile