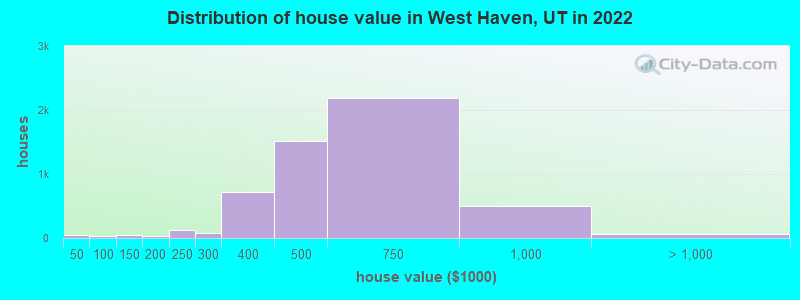
Estimated median house or condo value in 2022: $581,630 (it was $171,700 in 2000)
West Haven:
$581,630
UT:
$499,500
Mean prices in 2022:all housing units: $489,906; detached houses: $518,555; townhouses or other attached units: $367,378; in 2-unit structures: $372,281; in 3-to-4-unit structures: $252,139; in 5-or-more-unit structures: $197,854; mobile homes: $72,035
Median gross rent in 2022: $1,569.
March 2022 cost of living index in West Haven: 90.1 (less than average, U.S. average is 100)
Percentage of residents living in poverty in 2022: 4.5%
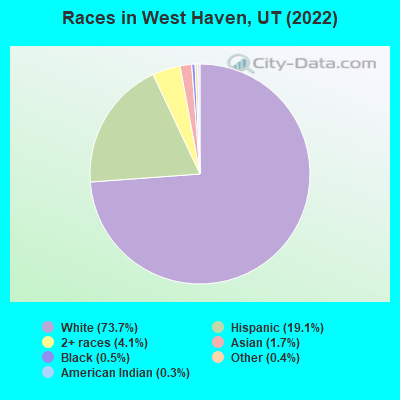
(5.2% for White Non-Hispanic residents, 3.3% for Hispanic or Latino residents, 15.0% for other race residents, 1.4% for two or more races residents)
According to our research of Utah and other state lists, there were 26 registered sex offenders living in West Haven, Utah as of June 08, 2024. The ratio of all residents to sex offenders in West Haven is 459 to 1. The ratio of registered sex offenders to all residents in this city is lower than the state average.
Recent articles from our blog. Our writers, many of them Ph.D. graduates or candidates, create easy-to-read articles on a wide variety of topics.
Latest news from West Haven, UT collected exclusively by city-data.com from local newspapers, TV, and radio stations
Ancestries: English (22.4%), German (10.0%), American (6.2%), European (5.7%), Italian (4.6%), Scottish (3.9%).
Current Local Time: MST time zone
Elevation: 4270 feet
Land area: 10.2 square miles.
Population density: 2,203 people per square mile (low).
764 residents are foreign born (2.1% Latin America, 1.0% Asia, 0.7% Europe).
This city:
4.1%
Utah:
8.4%
Median real estate property taxes paid for housing units with mortgages in 2022: $2,808 (0.5%) Median real estate property taxes paid for housing units with no mortgage in 2022: $3,078 (0.5%)
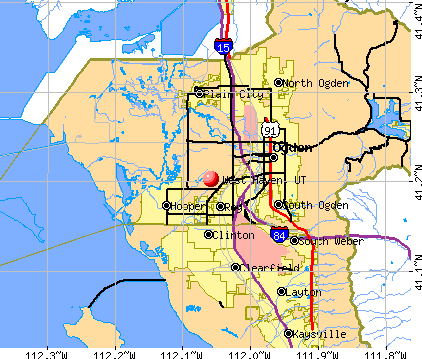
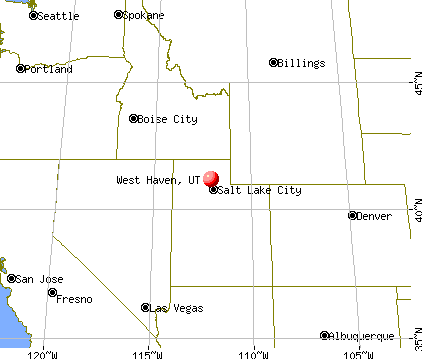
Nearest city with pop. 50,000+: Ogden, UT (5.4 miles , pop. 77,226).
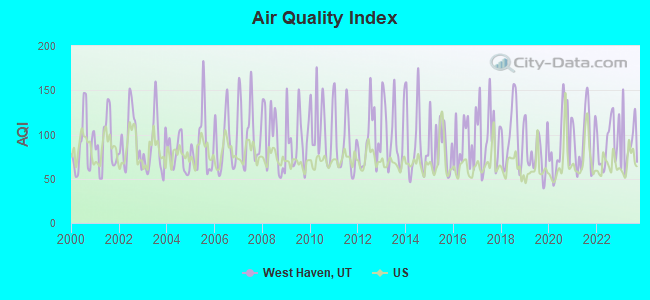
Air Quality Index (AQI) level in 2023 was 89.8. This is worse than average.
City:
89.8
U.S.:
72.6
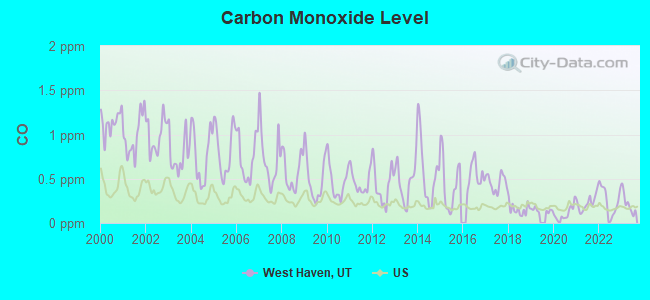
Carbon Monoxide (CO) [ppm] level in 2023 was 0.219. This is about average.Closest monitor was 2.5 miles away from the city center.
City:
0.219
U.S.:
0.251
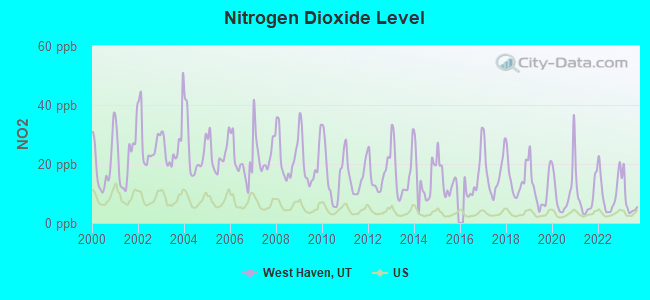
Nitrogen Dioxide (NO2) [ppb] level in 2023 was 7.70. This is significantly worse than average.Closest monitor was 4.3 miles away from the city center.
City:
7.70
U.S.:
5.11
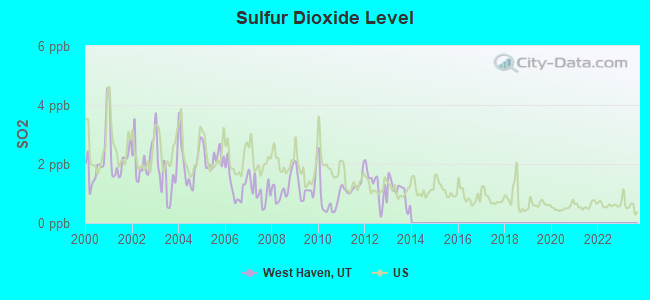
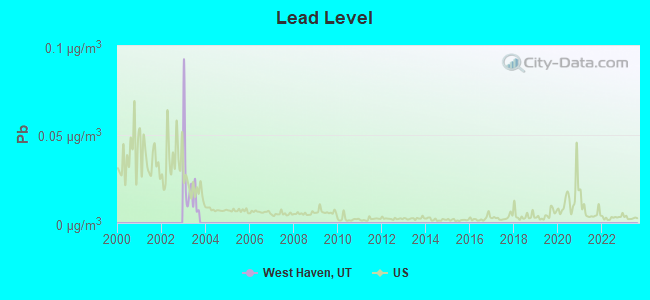
Sulfur Dioxide (SO2) [ppb] level in 2013 was 1.07. This is significantly better than average.Closest monitor was 4.6 miles away from the city center.
City:
1.07
U.S.:
1.51
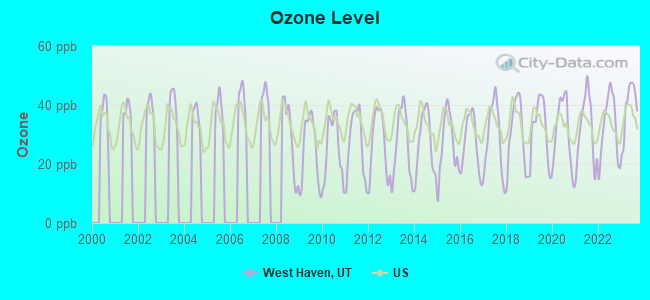
Ozone [ppb] level in 2023 was 39.3. This is about average.Closest monitor was 2.5 miles away from the city center.
City:
39.3
U.S.:
33.3
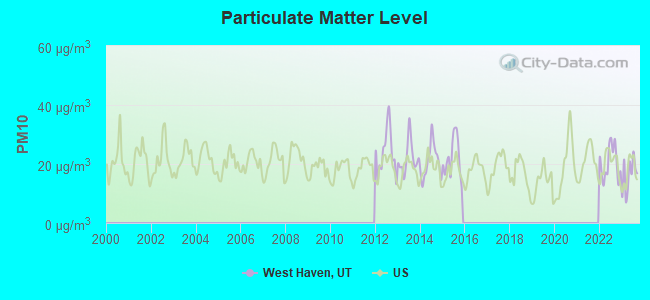
Particulate Matter (PM10) [µg/m3] level in 2023 was 16.2. This is about average.Closest monitor was 2.5 miles away from the city center.
City:
16.2
U.S.:
19.2
Particulate Matter (PM2.5) [µg/m3] level in 2023 was 5.92. This is better than average.Closest monitor was 4.2 miles away from the city center.
City:
5.92
U.S.:
8.11
Earthquake activity:
West Haven-area historical earthquake activity is significantly above Utah state average. It is 2126% greater than the overall U.S. average.
On 8/18/1959 at 06:37:13, a magnitude 7.7 (7.7 UK, Class: Major, Intensity: VIII - XII) earthquake occurred 243.2 miles away from the city center, causing $26,000,000 total damage On 10/28/1983 at 14:06:06, a magnitude 7.3 (6.2 MB, 7.3 MS, 7.0 MW) earthquake occurred 217.7 miles away from the city center, causing 2 deaths (2 shaking deaths) and 3 injuries, causing $15,000,000 total damage On 10/3/1915 at 06:52:48, a magnitude 7.6 (7.6 UK) earthquake occurred 288.8 miles away from the city center On 3/28/1975 at 02:31:05, a magnitude 6.2 (6.1 MB, 6.0 MS, 6.2 ML, Class: Strong, Intensity: VII - IX) earthquake occurred 60.0 miles away from West Haven center On 3/18/2020 at 13:09:31, a magnitude 5.7 (5.7 MW, Depth: 7.4 mi, Class: Moderate, Intensity: VI - VII) earthquake occurred 31.3 miles away from West Haven center On 12/21/1932 at 06:10:09, a magnitude 7.2 (7.2 UK) earthquake occurred 370.1 miles away from West Haven center Magnitude types: body-wave magnitude (MB), local magnitude (ML), surface-wave magnitude (MS), moment magnitude (MW)
Natural disasters:
The number of natural disasters in Weber County (8) is smaller than the US average (15). Major Disasters (Presidential) Declared: 4 Emergencies Declared: 2
Causes of natural disasters: Floods: 4, Landslides: 2, Storms: 2, Drought: 1, Fire: 1, Heavy Rain: 1, Hurricane: 1, Mudslide: 1, Snow: 1, Other: 1 (Note: some incidents may be assigned to more than one category).
Hospitals and medical centers near West Haven:
IVY LANE PEDIATRICS, INC (Home Health Center, about 3 miles away; ROY, UT)
HERITAGE PARK CARE CENTER (Nursing Home, about 3 miles away; ROY, UT)
INTERMOUNTAIN HOMECARE OGDEN (Home Health Center, about 5 miles away; OGDEN, UT)
WEBER VALLEY DIALYSIS (DVA) (Dialysis Facility, about 5 miles away; OGDEN, UT)
MT OGDEN HEALTH AND REHABILITATION CENTER (Nursing Home, about 6 miles away; WASHINGTON TERRACE, UT)
WASHINGTON TERRACE CARE AND REHABILITATION CENTER (Nursing Home, about 6 miles away; OGDEN, UT)
VISTA HOSPICE CARE, INC DBA VISTACARE (Hospital, about 6 miles away; OGDEN, UT)
Notable locations in West Haven: Century Campground (A), Circle R Industrial Park (B), Weber Fire District Station 63 (C). Display/hide their locations on the map
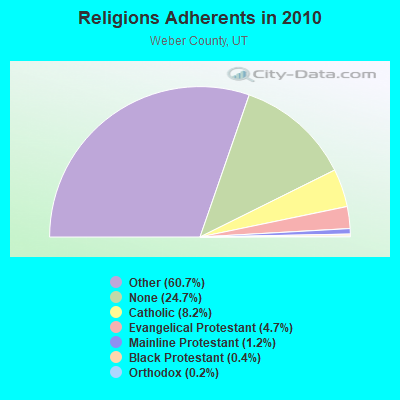
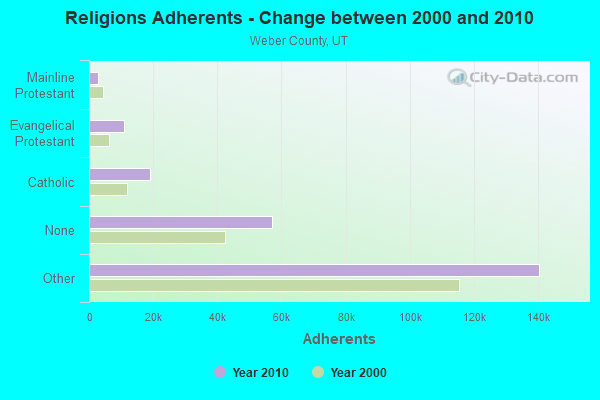
Religion statistics for West Haven, UT (based on Weber County data)
Religion
Adherents
Congregations
Other
140,427
324
Catholic
18,933
6
Evangelical Protestant
10,761
52
Mainline Protestant
2,761
11
Black Protestant
887
4
Orthodox
350
1
None
57,117
-
Source: Clifford Grammich, Kirk Hadaway, Richard Houseal, Dale E.Jones, Alexei Krindatch, Richie Stanley and Richard H.Taylor. 2012. 2010 U.S.Religion Census: Religious Congregations & Membership Study. Association of Statisticians of American Religious Bodies. Jones, Dale E., et al. 2002. Congregations and Membership in the United States 2000. Nashville, TN: Glenmary Research Center. Graphs represent county-level data
3652 West 4000 South (Lat: 41.190194 Lon: -112.066333), Type: Mtower, Structure height: 24.4 m, Overall height: 24.7 m, Call Sign: KNKA259 Assigned Frequencies: 880.020 MHz, 835.020 MHz, 891.510 MHz, 846.510 MHzGrant Date: 04/14/2015, Expiration Date: 05/15/2025, Certifier: Gregory M RomanoRegistrant: Verizon, 1300 I St Nw - Suite 500 East, Washington, DC 20005, Phone: (202) 515-2453, Email:
FCC Registered Antenna Towers:
3
Laurie Gebhardt, 1451 West 2100 South, Type: 15.2, Structure height: 49057 m, Overall height: 15.2 m, Registrant: Verizon Wireless (Vaw) LLC, Networkregulatory@verizonwireless.Com, Np2ne Network Engineering, Alpha-retta, Phone: (770) 797-1070
Laurie Gebhardt, 1451 West 2100 South (Lat: 41.228472 Lon: -112.014861), Type: 15.2, Structure height: 49057 m, Overall height: 15.2 m, Registrant: Verizon Wireless (Vaw) LLC, Networkregulatory@verizonwireless.Com, Np2ne Network Engineering, Alpha-retta, Phone: (770) 797-1070
432 Ft E & 967 Ft S Of 4000 S & 4300 W (Lat: 41.188056 Lon: -112.081944), Type: 87.8, Overall height: 86.7 m, Registrant: Collantes, Rolando Dba , Dsilverpe@usa.Net, , 2040 Tular-e, Phone: (801) 292-1799
Aircraft: CESSNA 182 (Category: Land, Seats: 4, Weight: Up to 12,499 Pounds, Speed: 119 mph), Engine: CONT MOTOR O-470 SERIES (230 HP) (Reciprocating) N-Number: 1918X, N1918X, N-1918X, Serial Number: 18256018, Year manufactured: 1965, Airworthiness Date: 01/08/1965, Certificate Issue Date: 11/04/2016 Registrant (Co-Owned): Patrick Carlson, 4312 S 3700 W, West Haven, UT 84401, Other Owners: Sandy Carlson
Aircraft: PIPER PA-28-181 (Category: Land, Seats: 4, Weight: Up to 12,499 Pounds, Speed: 105 mph), Engine: LYCOMING O&VO-360 SER (180 HP) (Reciprocating) N-Number: 35689, N35689, N-35689, Serial Number: 28-8090193, Year manufactured: 1979, Airworthiness Date: 12/13/1979, Certificate Issue Date: 08/06/2019 Registrant (Co-Owned): Philip K Naluai, 1885 S 3335 W, West Haven, UT 84401, Other Owners: Rachel A Porter
Aircraft: COOPER MARLIN CHALLENGER II (Category: Land, Seats: 2, Weight: Up to 12,499 Pounds), Engine: ROTAX 582DCDI-99 (65 HP) (2 Cycle) N-Number: 367RT, N367RT, N-367RT, Serial Number: CH2-0506-2738, Year manufactured: 2007, Airworthiness Date: 07/03/2007, Certificate Issue Date: 06/22/2009 Registrant (Individual): Rick S Hayman, 4383 W 4450 S, West Haven, UT 84401
Aircraft: MCLAUGHLIN GEORGE G RANS S6ES (Category: Land, Seats: 2, Weight: Up to 12,499 Pounds), Engine: ROTAX SEE BOMBADIER (Reciprocating) N-Number: 503FB, N503FB, N-503FB, Serial Number: 03021440ES, Year manufactured: 2003, Airworthiness Date: 12/08/2003, Certificate Issue Date: 03/28/2018 Registrant (Individual): Michael D Rosiere, 4359 S 3800 W, West Haven, UT 84401
Aircraft: CESSNA 150J (Category: Land, Seats: 2, Weight: Up to 12,499 Pounds, Speed: 90 mph), Engine: CONT MOTOR 0-200 SERIES (100 HP) (Reciprocating) N-Number: 61345, N61345, N-61345, Serial Number: 15070980, Airworthiness Date: 07/08/1969, Certificate Issue Date: 10/24/2018 Registrant (Co-Owned): Patrick A Carlson, 4312 S 3700 W, West Haven, UT 84401, Other Owners: Sandra L Carlson
Aircraft: CESSNA 172 (Category: Land, Seats: 4, Weight: Up to 12,499 Pounds, Speed: 105 mph), Engine: CONT MOTOR 0-300 SER (145 HP) (Reciprocating) N-Number: 6260E, N6260E, N-6260E, Serial Number: 46360, Year manufactured: 1958, Airworthiness Date: 12/24/1958, Certificate Issue Date: 08/31/2017 Registrant (Co-Owned): Patrick A Carlson, 4312 S 3700 W, West Haven, UT 84401, Other Owners: Sandra L Carlson Deregistered:Cancel Date: 12/08/2020
Aircraft: NORTHWING APACHE SPORT (Category: Land, Seats: 2, Weight: Up to 12,499 Pounds), Engine: ROTAX 582E (65 HP) (2 Cycle) N-Number: 58AS, N58AS, N-58AS, Serial Number: 581, Year manufactured: 2007, Airworthiness Date: 01/04/2008, Certificate Issue Date: 04/22/2014 Registrant (Individual): Allen D Speer, 5028 W 4250 S, West Haven, UT 84401
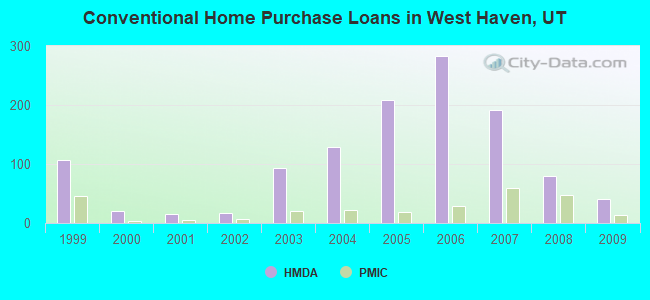
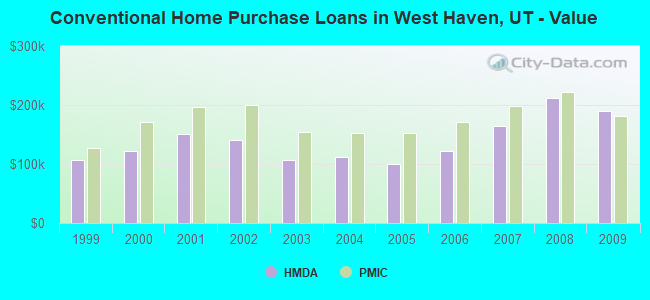
Home Mortgage Disclosure Act Aggregated Statistics For Year 2009 (Based on 2 partial tracts)
A) FHA, FSA/RHS & VA Home Purchase Loans
B) Conventional Home Purchase Loans
C) Refinancings
D) Home Improvement Loans
F) Non-occupant Loans on < 5 Family Dwellings (A B C & D)
G) Loans On Manufactured Home Dwelling (A B C & D)
Number
Average Value
Number
Average Value
Number
Average Value
Number
Average Value
Number
Average Value
Number
Average Value
LOANS ORIGINATED
107
$180,812
41
$189,350
465
$189,270
17
$79,306
8
$126,444
1
$42,920
APPLICATIONS APPROVED, NOT ACCEPTED
4
$200,205
4
$171,198
43
$194,863
1
$6,130
2
$129,010
1
$47,210
APPLICATIONS DENIED
5
$194,828
6
$125,855
103
$199,458
5
$18,452
4
$115,890
3
$65,887
APPLICATIONS WITHDRAWN
11
$179,090
5
$219,778
79
$192,390
0
$0
2
$163,380
0
$0
FILES CLOSED FOR INCOMPLETENESS
1
$289,410
1
$216,420
16
$184,844
1
$6,130
1
$88,290
0
$0
Aggregated Statistics For Year 2008 (Based on 2 partial tracts)
A) FHA, FSA/RHS & VA Home Purchase Loans
B) Conventional Home Purchase Loans
C) Refinancings
D) Home Improvement Loans
F) Non-occupant Loans on < 5 Family Dwellings (A B C & D)
G) Loans On Manufactured Home Dwelling (A B C & D)
Number
Average Value
Number
Average Value
Number
Average Value
Number
Average Value
Number
Average Value
Number
Average Value
LOANS ORIGINATED
96
$188,685
79
$211,455
266
$186,654
20
$67,474
12
$152,813
1
$15,330
APPLICATIONS APPROVED, NOT ACCEPTED
2
$242,070
5
$223,048
38
$175,772
4
$148,368
1
$110,360
0
$0
APPLICATIONS DENIED
7
$185,173
11
$212,935
95
$207,807
18
$83,877
10
$150,559
1
$52,110
APPLICATIONS WITHDRAWN
10
$202,425
8
$160,979
48
$201,674
2
$73,625
3
$150,323
0
$0
FILES CLOSED FOR INCOMPLETENESS
0
$0
1
$85,830
5
$227,650
2
$81,485
0
$0
1
$48,430
Aggregated Statistics For Year 2007 (Based on 2 partial tracts)
A) FHA, FSA/RHS & VA Home Purchase Loans
B) Conventional Home Purchase Loans
C) Refinancings
D) Home Improvement Loans
F) Non-occupant Loans on < 5 Family Dwellings (A B C & D)
G) Loans On Manufactured Home Dwelling (A B C & D)
Number
Average Value
Number
Average Value
Number
Average Value
Number
Average Value
Number
Average Value
Number
Average Value
LOANS ORIGINATED
48
$177,894
191
$164,645
219
$154,280
38
$51,036
32
$166,553
1
$39,850
APPLICATIONS APPROVED, NOT ACCEPTED
2
$232,215
25
$133,230
33
$154,417
7
$50,574
6
$109,882
0
$0
APPLICATIONS DENIED
4
$214,205
35
$162,883
98
$165,535
20
$79,564
12
$160,722
3
$41,617
APPLICATIONS WITHDRAWN
3
$175,597
17
$195,221
45
$174,007
7
$122,241
3
$187,800
1
$73,570
FILES CLOSED FOR INCOMPLETENESS
0
$0
2
$192,155
6
$195,252
1
$108,550
1
$122,620
0
$0
Aggregated Statistics For Year 2006 (Based on 2 partial tracts)
A) FHA, FSA/RHS & VA Home Purchase Loans
B) Conventional Home Purchase Loans
C) Refinancings
D) Home Improvement Loans
F) Non-occupant Loans on < 5 Family Dwellings (A B C & D)
G) Loans On Manufactured Home Dwelling (A B C & D)
Number
Average Value
Number
Average Value
Number
Average Value
Number
Average Value
Number
Average Value
Number
Average Value
LOANS ORIGINATED
46
$160,625
283
$121,244
207
$132,400
29
$49,822
44
$101,812
2
$121,020
APPLICATIONS APPROVED, NOT ACCEPTED
1
$201,710
29
$132,972
42
$115,116
8
$57,871
5
$121,510
1
$45,100
APPLICATIONS DENIED
6
$114,347
58
$116,998
102
$129,444
16
$63,381
7
$111,729
4
$53,070
APPLICATIONS WITHDRAWN
5
$139,744
47
$136,099
66
$130,988
5
$56,800
4
$110,498
0
$0
FILES CLOSED FOR INCOMPLETENESS
0
$0
7
$152,301
14
$149,451
1
$95,640
2
$126,920
1
$28,820
Aggregated Statistics For Year 2005 (Based on 2 partial tracts)
A) FHA, FSA/RHS & VA Home Purchase Loans
B) Conventional Home Purchase Loans
C) Refinancings
D) Home Improvement Loans
F) Non-occupant Loans on < 5 Family Dwellings (A B C & D)
G) Loans On Manufactured Home Dwelling (A B C & D)
Number
Average Value
Number
Average Value
Number
Average Value
Number
Average Value
Number
Average Value
Number
Average Value
LOANS ORIGINATED
47
$136,837
209
$100,789
216
$121,077
22
$67,487
21
$101,110
3
$88,773
APPLICATIONS APPROVED, NOT ACCEPTED
0
$0
31
$106,430
33
$114,641
2
$27,520
3
$120,893
1
$55,790
APPLICATIONS DENIED
3
$145,163
38
$103,057
111
$127,545
12
$54,809
5
$95,334
4
$64,452
APPLICATIONS WITHDRAWN
2
$103,000
35
$102,076
64
$124,247
6
$139,472
2
$118,810
1
$9,200
FILES CLOSED FOR INCOMPLETENESS
1
$76,640
10
$89,089
29
$152,724
0
$0
1
$68,050
1
$90,130
Aggregated Statistics For Year 2004 (Based on 2 partial tracts)
A) FHA, FSA/RHS & VA Home Purchase Loans
B) Conventional Home Purchase Loans
C) Refinancings
D) Home Improvement Loans
F) Non-occupant Loans on < 5 Family Dwellings (A B C & D)
G) Loans On Manufactured Home Dwelling (A B C & D)
Number
Average Value
Number
Average Value
Number
Average Value
Number
Average Value
Number
Average Value
Number
Average Value
LOANS ORIGINATED
59
$132,499
128
$111,610
220
$129,996
10
$45,211
11
$82,613
3
$66,893
APPLICATIONS APPROVED, NOT ACCEPTED
1
$139,170
29
$105,320
46
$134,377
4
$51,595
3
$169,883
3
$47,427
APPLICATIONS DENIED
2
$162,470
30
$99,779
106
$128,734
17
$32,786
5
$83,782
7
$44,150
APPLICATIONS WITHDRAWN
3
$160,827
15
$91,489
66
$130,015
1
$76,020
2
$158,800
0
$0
FILES CLOSED FOR INCOMPLETENESS
1
$87,060
3
$101,223
29
$154,661
2
$37,280
0
$0
0
$0
Aggregated Statistics For Year 2003 (Based on 2 partial tracts)
A) FHA, FSA/RHS & VA Home Purchase Loans
B) Conventional Home Purchase Loans
C) Refinancings
D) Home Improvement Loans
F) Non-occupant Loans on < 5 Family Dwellings (A B C & D)
Number
Average Value
Number
Average Value
Number
Average Value
Number
Average Value
Number
Average Value
LOANS ORIGINATED
86
$128,930
94
$107,053
542
$124,522
11
$20,722
22
$106,879
APPLICATIONS APPROVED, NOT ACCEPTED
2
$115,570
8
$119,730
39
$123,378
2
$13,645
2
$97,790
APPLICATIONS DENIED
4
$108,060
24
$95,500
110
$117,289
11
$19,665
3
$87,197
APPLICATIONS WITHDRAWN
5
$141,800
18
$107,443
93
$141,423
2
$23,605
3
$136,720
FILES CLOSED FOR INCOMPLETENESS
1
$103,610
6
$131,395
18
$133,342
1
$29,640
2
$135,740
Aggregated Statistics For Year 2002 (Based on 1 partial tract)
A) FHA, FSA/RHS & VA Home Purchase Loans
B) Conventional Home Purchase Loans
C) Refinancings
D) Home Improvement Loans
F) Non-occupant Loans on < 5 Family Dwellings (A B C & D)
Number
Average Value
Number
Average Value
Number
Average Value
Number
Average Value
Number
Average Value
LOANS ORIGINATED
5
$161,572
17
$140,329
101
$132,562
4
$30,478
3
$104,237
APPLICATIONS APPROVED, NOT ACCEPTED
0
$0
2
$105,210
12
$139,932
0
$0
0
$0
APPLICATIONS DENIED
0
$0
2
$86,630
23
$133,872
3
$14,613
0
$0
APPLICATIONS WITHDRAWN
1
$108,970
5
$147,294
22
$152,274
0
$0
0
$0
FILES CLOSED FOR INCOMPLETENESS
0
$0
1
$203,740
6
$121,145
0
$0
0
$0
Aggregated Statistics For Year 2001 (Based on 1 partial tract)
A) FHA, FSA/RHS & VA Home Purchase Loans
B) Conventional Home Purchase Loans
C) Refinancings
D) Home Improvement Loans
F) Non-occupant Loans on < 5 Family Dwellings (A B C & D)
Number
Average Value
Number
Average Value
Number
Average Value
Number
Average Value
Number
Average Value
LOANS ORIGINATED
5
$132,014
16
$150,509
99
$130,074
5
$41,082
3
$132,763
APPLICATIONS APPROVED, NOT ACCEPTED
0
$0
1
$137,780
8
$104,636
1
$18,790
2
$52,395
APPLICATIONS DENIED
1
$158,230
8
$59,285
20
$127,713
3
$45,507
0
$0
APPLICATIONS WITHDRAWN
0
$0
3
$94,633
16
$151,788
0
$0
1
$90,600
FILES CLOSED FOR INCOMPLETENESS
0
$0
1
$154,060
4
$113,455
0
$0
0
$0
Aggregated Statistics For Year 2000 (Based on 1 partial tract)
A) FHA, FSA/RHS & VA Home Purchase Loans
B) Conventional Home Purchase Loans
C) Refinancings
D) Home Improvement Loans
F) Non-occupant Loans on < 5 Family Dwellings (A B C & D)
Number
Average Value
Number
Average Value
Number
Average Value
Number
Average Value
Number
Average Value
LOANS ORIGINATED
3
$138,053
20
$121,242
28
$111,965
8
$22,389
0
$0
APPLICATIONS APPROVED, NOT ACCEPTED
0
$0
4
$117,525
9
$99,364
3
$21,710
0
$0
APPLICATIONS DENIED
1
$192,470
13
$67,025
19
$166,824
2
$27,975
2
$53,230
APPLICATIONS WITHDRAWN
3
$106,603
4
$107,402
9
$154,011
0
$0
0
$0
FILES CLOSED FOR INCOMPLETENESS
0
$0
1
$89,760
4
$236,305
0
$0
0
$0
Aggregated Statistics For Year 1999 (Based on 2 partial tracts)
A) FHA, FSA/RHS & VA Home Purchase Loans
B) Conventional Home Purchase Loans
C) Refinancings
D) Home Improvement Loans
F) Non-occupant Loans on < 5 Family Dwellings (A B C & D)
Detailed PMIC statistics for the following Tracts:2105.05
, 2105.06
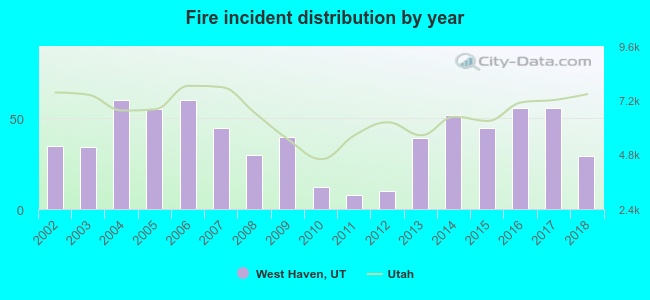
2002 - 2018 National Fire Incident Reporting System (NFIRS) incidents
Based on the data from the years 2002 - 2018 the average number of fires per year is 39. The highest number of reported fire incidents - 60 took place in 2004, and the least - 8 in 2011. The data has a dropping trend.
When looking into fire subcategories, the most incidents belonged to: Outside Fires (50.6%), and Structure Fires (28.5%).
Fire incident types reported to NFIRS in West Haven, UT


 Recent articles from our blog. Our writers, many of them Ph.D. graduates or candidates, create easy-to-read articles on a wide variety of topics.

 (5.4 miles
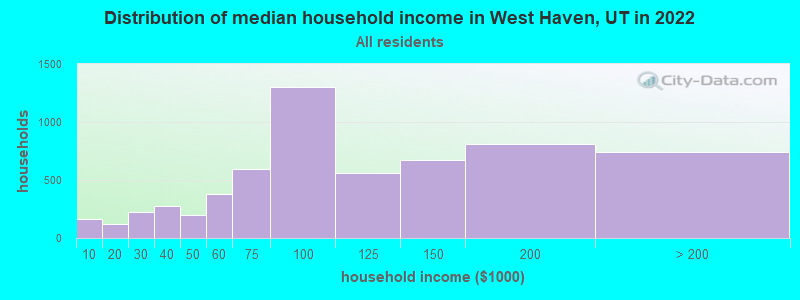


 Based on the data from the years 2002 - 2018 the average number of fires per year is 39. The highest number of reported fire incidents - 60 took place in 2004, and the least - 8 in 2011. The data has a dropping trend.
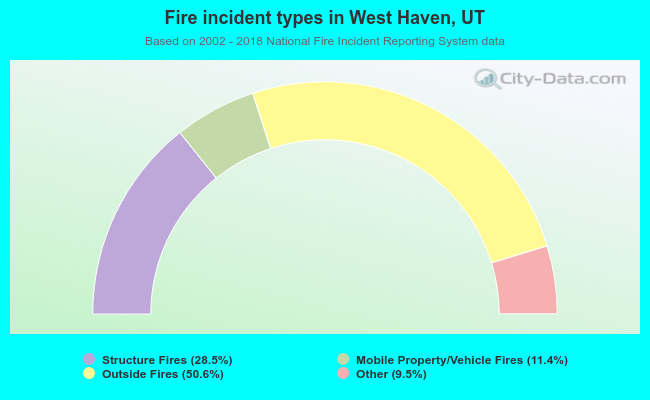 When looking into fire subcategories, the most incidents belonged to: Outside Fires (50.6%), and Structure Fires (28.5%).