Bethel Park, Pennsylvania Submit your own pictures of this borough and show them to the world
OSM Map
General Map
Google Map
MSN Map
OSM Map
General Map
Google Map
MSN Map
OSM Map
General Map
Google Map
MSN Map
OSM Map
General Map
Google Map
MSN Map
Please wait while loading the map...
Population in 2022: 32,782 (100% urban, 0% rural). Population change since 2000: -2.3%Males: 16,153 Females: 16,629
March 2022 cost of living index in Bethel Park: 94.4 (less than average, U.S. average is 100) Percentage of residents living in poverty in 2022: 4.7%for White Non-Hispanic residents , 7.0% for Black residents , 10.5% for Hispanic or Latino residents , 6.0% for other race residents , 9.5% for two or more races residents )
Profiles of local businesses
Business Search - 14 Million verified businesses
Data:
Median household income ($)
Median household income (% change since 2000)
Household income diversity
Ratio of average income to average house value (%)
Ratio of average income to average rent
Median household income ($) - White
Median household income ($) - Black or African American
Median household income ($) - Asian
Median household income ($) - Hispanic or Latino
Median household income ($) - American Indian and Alaska Native
Median household income ($) - Multirace
Median household income ($) - Other Race
Median household income for houses/condos with a mortgage ($)
Median household income for apartments without a mortgage ($)
Races - White alone (%)
Races - White alone (% change since 2000)
Races - Black alone (%)
Races - Black alone (% change since 2000)
Races - American Indian alone (%)
Races - American Indian alone (% change since 2000)
Races - Asian alone (%)
Races - Asian alone (% change since 2000)
Races - Hispanic (%)
Races - Hispanic (% change since 2000)
Races - Native Hawaiian and Other Pacific Islander alone (%)
Races - Native Hawaiian and Other Pacific Islander alone (% change since 2000)
Races - Two or more races (%)
Races - Two or more races (% change since 2000)
Races - Other race alone (%)
Races - Other race alone (% change since 2000)
Racial diversity
Unemployment (%)
Unemployment (% change since 2000)
Unemployment (%) - White
Unemployment (%) - Black or African American
Unemployment (%) - Asian
Unemployment (%) - Hispanic or Latino
Unemployment (%) - American Indian and Alaska Native
Unemployment (%) - Multirace
Unemployment (%) - Other Race
Population density (people per square mile)
Population - Males (%)
Population - Females (%)
Population - Males (%) - White
Population - Males (%) - Black or African American
Population - Males (%) - Asian
Population - Males (%) - Hispanic or Latino
Population - Males (%) - American Indian and Alaska Native
Population - Males (%) - Multirace
Population - Males (%) - Other Race
Population - Females (%) - White
Population - Females (%) - Black or African American
Population - Females (%) - Asian
Population - Females (%) - Hispanic or Latino
Population - Females (%) - American Indian and Alaska Native
Population - Females (%) - Multirace
Population - Females (%) - Other Race
Coronavirus confirmed cases (Jun 08, 2024)
Deaths caused by coronavirus (Jun 08, 2024)
Coronavirus confirmed cases (per 100k population) (Jun 08, 2024)
Deaths caused by coronavirus (per 100k population) (Jun 08, 2024)
Daily increase in number of cases (Jun 08, 2024)
Weekly increase in number of cases (Jun 08, 2024)
Cases doubled (in days) (Jun 08, 2024)
Hospitalized patients (Apr 18, 2022)
Negative test results (Apr 18, 2022)
Total test results (Apr 18, 2022)
COVID Vaccine doses distributed (per 100k population) (Sep 19, 2023)
COVID Vaccine doses administered (per 100k population) (Sep 19, 2023)
COVID Vaccine doses distributed (Sep 19, 2023)
COVID Vaccine doses administered (Sep 19, 2023)
Likely homosexual households (%)
Likely homosexual households (% change since 2000)
Likely homosexual households - Lesbian couples (%)
Likely homosexual households - Lesbian couples (% change since 2000)
Likely homosexual households - Gay men (%)
Likely homosexual households - Gay men (% change since 2000)
Cost of living index
Median gross rent ($)
Median contract rent ($)
Median monthly housing costs ($)
Median house or condo value ($)
Median house or condo value ($ change since 2000)
Mean house or condo value by units in structure - 1, detached ($)
Mean house or condo value by units in structure - 1, attached ($)
Mean house or condo value by units in structure - 2 ($)
Mean house or condo value by units in structure by units in structure - 3 or 4 ($)
Mean house or condo value by units in structure - 5 or more ($)
Mean house or condo value by units in structure - Boat, RV, van, etc. ($)
Mean house or condo value by units in structure - Mobile home ($)
Median house or condo value ($) - White
Median house or condo value ($) - Black or African American
Median house or condo value ($) - Asian
Median house or condo value ($) - Hispanic or Latino
Median house or condo value ($) - American Indian and Alaska Native
Median house or condo value ($) - Multirace
Median house or condo value ($) - Other Race
Median resident age
Resident age diversity
Median resident age - Males
Median resident age - Females
Median resident age - White
Median resident age - Black or African American
Median resident age - Asian
Median resident age - Hispanic or Latino
Median resident age - American Indian and Alaska Native
Median resident age - Multirace
Median resident age - Other Race
Median resident age - Males - White
Median resident age - Males - Black or African American
Median resident age - Males - Asian
Median resident age - Males - Hispanic or Latino
Median resident age - Males - American Indian and Alaska Native
Median resident age - Males - Multirace
Median resident age - Males - Other Race
Median resident age - Females - White
Median resident age - Females - Black or African American
Median resident age - Females - Asian
Median resident age - Females - Hispanic or Latino
Median resident age - Females - American Indian and Alaska Native
Median resident age - Females - Multirace
Median resident age - Females - Other Race
Commute - mean travel time to work (minutes)
Travel time to work - Less than 5 minutes (%)
Travel time to work - Less than 5 minutes (% change since 2000)
Travel time to work - 5 to 9 minutes (%)
Travel time to work - 5 to 9 minutes (% change since 2000)
Travel time to work - 10 to 19 minutes (%)
Travel time to work - 10 to 19 minutes (% change since 2000)
Travel time to work - 20 to 29 minutes (%)
Travel time to work - 20 to 29 minutes (% change since 2000)
Travel time to work - 30 to 39 minutes (%)
Travel time to work - 30 to 39 minutes (% change since 2000)
Travel time to work - 40 to 59 minutes (%)
Travel time to work - 40 to 59 minutes (% change since 2000)
Travel time to work - 60 to 89 minutes (%)
Travel time to work - 60 to 89 minutes (% change since 2000)
Travel time to work - 90 or more minutes (%)
Travel time to work - 90 or more minutes (% change since 2000)
Marital status - Never married (%)
Marital status - Now married (%)
Marital status - Separated (%)
Marital status - Widowed (%)
Marital status - Divorced (%)
Median family income ($)
Median family income (% change since 2000)
Median non-family income ($)
Median non-family income (% change since 2000)
Median per capita income ($)
Median per capita income (% change since 2000)
Median family income ($) - White
Median family income ($) - Black or African American
Median family income ($) - Asian
Median family income ($) - Hispanic or Latino
Median family income ($) - American Indian and Alaska Native
Median family income ($) - Multirace
Median family income ($) - Other Race
Median year house/condo built
Median year apartment built
Year house built - Built 2005 or later (%)
Year house built - Built 2000 to 2004 (%)
Year house built - Built 1990 to 1999 (%)
Year house built - Built 1980 to 1989 (%)
Year house built - Built 1970 to 1979 (%)
Year house built - Built 1960 to 1969 (%)
Year house built - Built 1950 to 1959 (%)
Year house built - Built 1940 to 1949 (%)
Year house built - Built 1939 or earlier (%)
Average household size
Household density (households per square mile)
Average household size - White
Average household size - Black or African American
Average household size - Asian
Average household size - Hispanic or Latino
Average household size - American Indian and Alaska Native
Average household size - Multirace
Average household size - Other Race
Occupied housing units (%)
Vacant housing units (%)
Owner occupied housing units (%)
Renter occupied housing units (%)
Vacancy status - For rent (%)
Vacancy status - For sale only (%)
Vacancy status - Rented or sold, not occupied (%)
Vacancy status - For seasonal, recreational, or occasional use (%)
Vacancy status - For migrant workers (%)
Vacancy status - Other vacant (%)
Residents with income below the poverty level (%)
Residents with income below 50% of the poverty level (%)
Children below poverty level (%)
Poor families by family type - Married-couple family (%)
Poor families by family type - Male, no wife present (%)
Poor families by family type - Female, no husband present (%)
Poverty status for native-born residents (%)
Poverty status for foreign-born residents (%)
Poverty among high school graduates not in families (%)
Poverty among people who did not graduate high school not in families (%)
Residents with income below the poverty level (%) - White
Residents with income below the poverty level (%) - Black or African American
Residents with income below the poverty level (%) - Asian
Residents with income below the poverty level (%) - Hispanic or Latino
Residents with income below the poverty level (%) - American Indian and Alaska Native
Residents with income below the poverty level (%) - Multirace
Residents with income below the poverty level (%) - Other Race
Air pollution - Air Quality Index (AQI)
Air pollution - CO
Air pollution - NO2
Air pollution - SO2
Air pollution - Ozone
Air pollution - PM10
Air pollution - PM25
Air pollution - Pb
Crime - Murders per 100,000 population
Crime - Rapes per 100,000 population
Crime - Robberies per 100,000 population
Crime - Assaults per 100,000 population
Crime - Burglaries per 100,000 population
Crime - Thefts per 100,000 population
Crime - Auto thefts per 100,000 population
Crime - Arson per 100,000 population
Crime - City-data.com crime index
Crime - Violent crime index
Crime - Property crime index
Crime - Murders per 100,000 population (5 year average)
Crime - Rapes per 100,000 population (5 year average)
Crime - Robberies per 100,000 population (5 year average)
Crime - Assaults per 100,000 population (5 year average)
Crime - Burglaries per 100,000 population (5 year average)
Crime - Thefts per 100,000 population (5 year average)
Crime - Auto thefts per 100,000 population (5 year average)
Crime - Arson per 100,000 population (5 year average)
Crime - City-data.com crime index (5 year average)
Crime - Violent crime index (5 year average)
Crime - Property crime index (5 year average)
1996 Presidential Elections Results (%) - Democratic Party (Clinton)
1996 Presidential Elections Results (%) - Republican Party (Dole)
1996 Presidential Elections Results (%) - Other
2000 Presidential Elections Results (%) - Democratic Party (Gore)
2000 Presidential Elections Results (%) - Republican Party (Bush)
2000 Presidential Elections Results (%) - Other
2004 Presidential Elections Results (%) - Democratic Party (Kerry)
2004 Presidential Elections Results (%) - Republican Party (Bush)
2004 Presidential Elections Results (%) - Other
2008 Presidential Elections Results (%) - Democratic Party (Obama)
2008 Presidential Elections Results (%) - Republican Party (McCain)
2008 Presidential Elections Results (%) - Other
2012 Presidential Elections Results (%) - Democratic Party (Obama)
2012 Presidential Elections Results (%) - Republican Party (Romney)
2012 Presidential Elections Results (%) - Other
2016 Presidential Elections Results (%) - Democratic Party (Clinton)
2016 Presidential Elections Results (%) - Republican Party (Trump)
2016 Presidential Elections Results (%) - Other
2020 Presidential Elections Results (%) - Democratic Party (Biden)
2020 Presidential Elections Results (%) - Republican Party (Trump)
2020 Presidential Elections Results (%) - Other
Ancestries Reported - Arab (%)
Ancestries Reported - Czech (%)
Ancestries Reported - Danish (%)
Ancestries Reported - Dutch (%)
Ancestries Reported - English (%)
Ancestries Reported - French (%)
Ancestries Reported - French Canadian (%)
Ancestries Reported - German (%)
Ancestries Reported - Greek (%)
Ancestries Reported - Hungarian (%)
Ancestries Reported - Irish (%)
Ancestries Reported - Italian (%)
Ancestries Reported - Lithuanian (%)
Ancestries Reported - Norwegian (%)
Ancestries Reported - Polish (%)
Ancestries Reported - Portuguese (%)
Ancestries Reported - Russian (%)
Ancestries Reported - Scotch-Irish (%)
Ancestries Reported - Scottish (%)
Ancestries Reported - Slovak (%)
Ancestries Reported - Subsaharan African (%)
Ancestries Reported - Swedish (%)
Ancestries Reported - Swiss (%)
Ancestries Reported - Ukrainian (%)
Ancestries Reported - United States (%)
Ancestries Reported - Welsh (%)
Ancestries Reported - West Indian (%)
Ancestries Reported - Other (%)
Educational Attainment - No schooling completed (%)
Educational Attainment - Less than high school (%)
Educational Attainment - High school or equivalent (%)
Educational Attainment - Less than 1 year of college (%)
Educational Attainment - 1 or more years of college (%)
Educational Attainment - Associate degree (%)
Educational Attainment - Bachelor's degree (%)
Educational Attainment - Master's degree (%)
Educational Attainment - Professional school degree (%)
Educational Attainment - Doctorate degree (%)
School Enrollment - Nursery, preschool (%)
School Enrollment - Kindergarten (%)
School Enrollment - Grade 1 to 4 (%)
School Enrollment - Grade 5 to 8 (%)
School Enrollment - Grade 9 to 12 (%)
School Enrollment - College undergrad (%)
School Enrollment - Graduate or professional (%)
School Enrollment - Not enrolled in school (%)
School enrollment - Public schools (%)
School enrollment - Private schools (%)
School enrollment - Not enrolled (%)
Median number of rooms in houses and condos
Median number of rooms in apartments
Housing units lacking complete plumbing facilities (%)
Housing units lacking complete kitchen facilities (%)
Density of houses
Urban houses (%)
Rural houses (%)
Households with people 60 years and over (%)
Households with people 65 years and over (%)
Households with people 75 years and over (%)
Households with one or more nonrelatives (%)
Households with no nonrelatives (%)
Population in households (%)
Family households (%)
Nonfamily households (%)
Population in families (%)
Family households with own children (%)
Median number of bedrooms in owner occupied houses
Mean number of bedrooms in owner occupied houses
Median number of bedrooms in renter occupied houses
Mean number of bedrooms in renter occupied houses
Median number of vehichles in owner occupied houses
Mean number of vehichles in owner occupied houses
Median number of vehichles in renter occupied houses
Mean number of vehichles in renter occupied houses
Mortgage status - with mortgage (%)
Mortgage status - with second mortgage (%)
Mortgage status - with home equity loan (%)
Mortgage status - with both second mortgage and home equity loan (%)
Mortgage status - without a mortgage (%)
Average family size
Average family size - White
Average family size - Black or African American
Average family size - Asian
Average family size - Hispanic or Latino
Average family size - American Indian and Alaska Native
Average family size - Multirace
Average family size - Other Race
Geographical mobility - Same house 1 year ago (%)
Geographical mobility - Moved within same county (%)
Geographical mobility - Moved from different county within same state (%)
Geographical mobility - Moved from different state (%)
Geographical mobility - Moved from abroad (%)
Place of birth - Born in state of residence (%)
Place of birth - Born in other state (%)
Place of birth - Native, outside of US (%)
Place of birth - Foreign born (%)
Housing units in structures - 1, detached (%)
Housing units in structures - 1, attached (%)
Housing units in structures - 2 (%)
Housing units in structures - 3 or 4 (%)
Housing units in structures - 5 to 9 (%)
Housing units in structures - 10 to 19 (%)
Housing units in structures - 20 to 49 (%)
Housing units in structures - 50 or more (%)
Housing units in structures - Mobile home (%)
Housing units in structures - Boat, RV, van, etc. (%)
House/condo owner moved in on average (years ago)
Renter moved in on average (years ago)
Year householder moved into unit - Moved in 1999 to March 2000 (%)
Year householder moved into unit - Moved in 1995 to 1998 (%)
Year householder moved into unit - Moved in 1990 to 1994 (%)
Year householder moved into unit - Moved in 1980 to 1989 (%)
Year householder moved into unit - Moved in 1970 to 1979 (%)
Year householder moved into unit - Moved in 1969 or earlier (%)
Means of transportation to work - Drove car alone (%)
Means of transportation to work - Carpooled (%)
Means of transportation to work - Public transportation (%)
Means of transportation to work - Bus or trolley bus (%)
Means of transportation to work - Streetcar or trolley car (%)
Means of transportation to work - Subway or elevated (%)
Means of transportation to work - Railroad (%)
Means of transportation to work - Ferryboat (%)
Means of transportation to work - Taxicab (%)
Means of transportation to work - Motorcycle (%)
Means of transportation to work - Bicycle (%)
Means of transportation to work - Walked (%)
Means of transportation to work - Other means (%)
Working at home (%)
Industry diversity
Most Common Industries - Agriculture, forestry, fishing and hunting, and mining (%)
Most Common Industries - Agriculture, forestry, fishing and hunting (%)
Most Common Industries - Mining, quarrying, and oil and gas extraction (%)
Most Common Industries - Construction (%)
Most Common Industries - Manufacturing (%)
Most Common Industries - Wholesale trade (%)
Most Common Industries - Retail trade (%)
Most Common Industries - Transportation and warehousing, and utilities (%)
Most Common Industries - Transportation and warehousing (%)
Most Common Industries - Utilities (%)
Most Common Industries - Information (%)
Most Common Industries - Finance and insurance, and real estate and rental and leasing (%)
Most Common Industries - Finance and insurance (%)
Most Common Industries - Real estate and rental and leasing (%)
Most Common Industries - Professional, scientific, and management, and administrative and waste management services (%)
Most Common Industries - Professional, scientific, and technical services (%)
Most Common Industries - Management of companies and enterprises (%)
Most Common Industries - Administrative and support and waste management services (%)
Most Common Industries - Educational services, and health care and social assistance (%)
Most Common Industries - Educational services (%)
Most Common Industries - Health care and social assistance (%)
Most Common Industries - Arts, entertainment, and recreation, and accommodation and food services (%)
Most Common Industries - Arts, entertainment, and recreation (%)
Most Common Industries - Accommodation and food services (%)
Most Common Industries - Other services, except public administration (%)
Most Common Industries - Public administration (%)
Occupation diversity
Most Common Occupations - Management, business, science, and arts occupations (%)
Most Common Occupations - Management, business, and financial occupations (%)
Most Common Occupations - Management occupations (%)
Most Common Occupations - Business and financial operations occupations (%)
Most Common Occupations - Computer, engineering, and science occupations (%)
Most Common Occupations - Computer and mathematical occupations (%)
Most Common Occupations - Architecture and engineering occupations (%)
Most Common Occupations - Life, physical, and social science occupations (%)
Most Common Occupations - Education, legal, community service, arts, and media occupations (%)
Most Common Occupations - Community and social service occupations (%)
Most Common Occupations - Legal occupations (%)
Most Common Occupations - Education, training, and library occupations (%)
Most Common Occupations - Arts, design, entertainment, sports, and media occupations (%)
Most Common Occupations - Healthcare practitioners and technical occupations (%)
Most Common Occupations - Health diagnosing and treating practitioners and other technical occupations (%)
Most Common Occupations - Health technologists and technicians (%)
Most Common Occupations - Service occupations (%)
Most Common Occupations - Healthcare support occupations (%)
Most Common Occupations - Protective service occupations (%)
Most Common Occupations - Fire fighting and prevention, and other protective service workers including supervisors (%)
Most Common Occupations - Law enforcement workers including supervisors (%)
Most Common Occupations - Food preparation and serving related occupations (%)
Most Common Occupations - Building and grounds cleaning and maintenance occupations (%)
Most Common Occupations - Personal care and service occupations (%)
Most Common Occupations - Sales and office occupations (%)
Most Common Occupations - Sales and related occupations (%)
Most Common Occupations - Office and administrative support occupations (%)
Most Common Occupations - Natural resources, construction, and maintenance occupations (%)
Most Common Occupations - Farming, fishing, and forestry occupations (%)
Most Common Occupations - Construction and extraction occupations (%)
Most Common Occupations - Installation, maintenance, and repair occupations (%)
Most Common Occupations - Production, transportation, and material moving occupations (%)
Most Common Occupations - Production occupations (%)
Most Common Occupations - Transportation occupations (%)
Most Common Occupations - Material moving occupations (%)
People in Group quarters - Institutionalized population (%)
People in Group quarters - Correctional institutions (%)
People in Group quarters - Federal prisons and detention centers (%)
People in Group quarters - Halfway houses (%)
People in Group quarters - Local jails and other confinement facilities (including police lockups) (%)
People in Group quarters - Military disciplinary barracks (%)
People in Group quarters - State prisons (%)
People in Group quarters - Other types of correctional institutions (%)
People in Group quarters - Nursing homes (%)
People in Group quarters - Hospitals/wards, hospices, and schools for the handicapped (%)
People in Group quarters - Hospitals/wards and hospices for chronically ill (%)
People in Group quarters - Hospices or homes for chronically ill (%)
People in Group quarters - Military hospitals or wards for chronically ill (%)
People in Group quarters - Other hospitals or wards for chronically ill (%)
People in Group quarters - Hospitals or wards for drug/alcohol abuse (%)
People in Group quarters - Mental (Psychiatric) hospitals or wards (%)
People in Group quarters - Schools, hospitals, or wards for the mentally retarded (%)
People in Group quarters - Schools, hospitals, or wards for the physically handicapped (%)
People in Group quarters - Institutions for the deaf (%)
People in Group quarters - Institutions for the blind (%)
People in Group quarters - Orthopedic wards and institutions for the physically handicapped (%)
People in Group quarters - Wards in general hospitals for patients who have no usual home elsewhere (%)
People in Group quarters - Wards in military hospitals for patients who have no usual home elsewhere (%)
People in Group quarters - Juvenile institutions (%)
People in Group quarters - Long-term care (%)
People in Group quarters - Homes for abused, dependent, and neglected children (%)
People in Group quarters - Residential treatment centers for emotionally disturbed children (%)
People in Group quarters - Training schools for juvenile delinquents (%)
People in Group quarters - Short-term care, detention or diagnostic centers for delinquent children (%)
People in Group quarters - Type of juvenile institution unknown (%)
People in Group quarters - Noninstitutionalized population (%)
People in Group quarters - College dormitories (includes college quarters off campus) (%)
People in Group quarters - Military quarters (%)
People in Group quarters - On base (%)
People in Group quarters - Barracks, unaccompanied personnel housing (UPH), (Enlisted/Officer), ;and similar group living quarters for military personnel (%)
People in Group quarters - Transient quarters for temporary residents (%)
People in Group quarters - Military ships (%)
People in Group quarters - Group homes (%)
People in Group quarters - Homes or halfway houses for drug/alcohol abuse (%)
People in Group quarters - Homes for the mentally ill (%)
People in Group quarters - Homes for the mentally retarded (%)
People in Group quarters - Homes for the physically handicapped (%)
People in Group quarters - Other group homes (%)
People in Group quarters - Religious group quarters (%)
People in Group quarters - Dormitories (%)
People in Group quarters - Agriculture workers' dormitories on farms (%)
People in Group quarters - Job Corps and vocational training facilities (%)
People in Group quarters - Other workers' dormitories (%)
People in Group quarters - Crews of maritime vessels (%)
People in Group quarters - Other nonhousehold living situations (%)
People in Group quarters - Other noninstitutional group quarters (%)
Residents speaking English at home (%)
Residents speaking English at home - Born in the United States (%)
Residents speaking English at home - Native, born elsewhere (%)
Residents speaking English at home - Foreign born (%)
Residents speaking Spanish at home (%)
Residents speaking Spanish at home - Born in the United States (%)
Residents speaking Spanish at home - Native, born elsewhere (%)
Residents speaking Spanish at home - Foreign born (%)
Residents speaking other language at home (%)
Residents speaking other language at home - Born in the United States (%)
Residents speaking other language at home - Native, born elsewhere (%)
Residents speaking other language at home - Foreign born (%)
Class of Workers - Employee of private company (%)
Class of Workers - Self-employed in own incorporated business (%)
Class of Workers - Private not-for-profit wage and salary workers (%)
Class of Workers - Local government workers (%)
Class of Workers - State government workers (%)
Class of Workers - Federal government workers (%)
Class of Workers - Self-employed workers in own not incorporated business and Unpaid family workers (%)
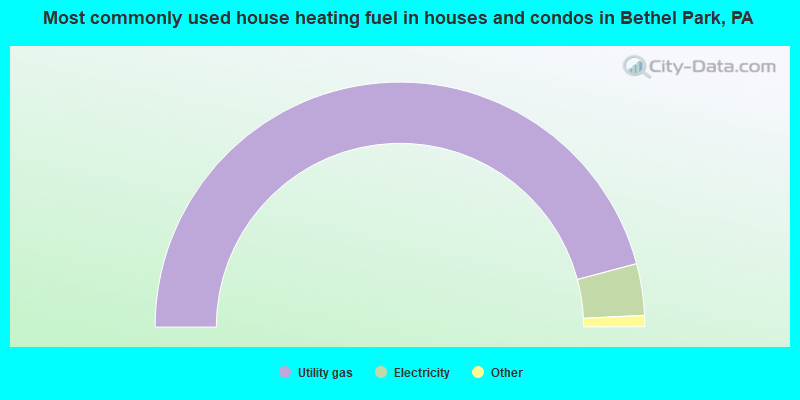
House heating fuel used in houses and condos - Utility gas (%)
House heating fuel used in houses and condos - Bottled, tank, or LP gas (%)
House heating fuel used in houses and condos - Electricity (%)
House heating fuel used in houses and condos - Fuel oil, kerosene, etc. (%)
House heating fuel used in houses and condos - Coal or coke (%)
House heating fuel used in houses and condos - Wood (%)
House heating fuel used in houses and condos - Solar energy (%)
House heating fuel used in houses and condos - Other fuel (%)
House heating fuel used in houses and condos - No fuel used (%)
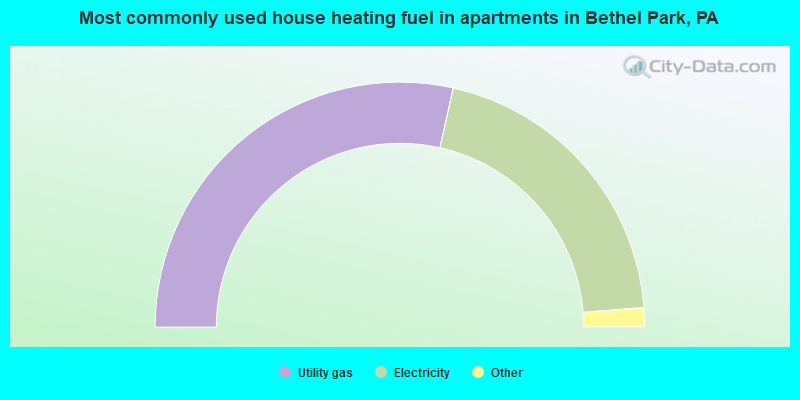
House heating fuel used in apartments - Utility gas (%)
House heating fuel used in apartments - Bottled, tank, or LP gas (%)
House heating fuel used in apartments - Electricity (%)
House heating fuel used in apartments - Fuel oil, kerosene, etc. (%)
House heating fuel used in apartments - Coal or coke (%)
House heating fuel used in apartments - Wood (%)
House heating fuel used in apartments - Solar energy (%)
House heating fuel used in apartments - Other fuel (%)
House heating fuel used in apartments - No fuel used (%)
Armed forces status - In Armed Forces (%)
Armed forces status - Civilian (%)
Armed forces status - Civilian - Veteran (%)
Armed forces status - Civilian - Nonveteran (%)
Fatal accidents locations in years 2005-2021
Fatal accidents locations in 2005
Fatal accidents locations in 2006
Fatal accidents locations in 2007
Fatal accidents locations in 2008
Fatal accidents locations in 2009
Fatal accidents locations in 2010
Fatal accidents locations in 2011
Fatal accidents locations in 2012
Fatal accidents locations in 2013
Fatal accidents locations in 2014
Fatal accidents locations in 2015
Fatal accidents locations in 2016
Fatal accidents locations in 2017
Fatal accidents locations in 2018
Fatal accidents locations in 2019
Fatal accidents locations in 2020
Fatal accidents locations in 2021
Alcohol use - People drinking some alcohol every month (%)
Alcohol use - People not drinking at all (%)
Alcohol use - Average days/month drinking alcohol
Alcohol use - Average drinks/week
Alcohol use - Average days/year people drink much
Audiometry - Average condition of hearing (%)
Audiometry - People that can hear a whisper from across a quiet room (%)
Audiometry - People that can hear normal voice from across a quiet room (%)
Audiometry - Ears ringing, roaring, buzzing (%)
Audiometry - Had a job exposure to loud noise (%)
Audiometry - Had off-work exposure to loud noise (%)
Blood Pressure & Cholesterol - Has high blood pressure (%)
Blood Pressure & Cholesterol - Checking blood pressure at home (%)
Blood Pressure & Cholesterol - Frequently checking blood cholesterol (%)
Blood Pressure & Cholesterol - Has high cholesterol level (%)
Consumer Behavior - Money monthly spent on food at supermarket/grocery store
Consumer Behavior - Money monthly spent on food at other stores
Consumer Behavior - Money monthly spent on eating out
Consumer Behavior - Money monthly spent on carryout/delivered foods
Consumer Behavior - Income spent on food at supermarket/grocery store (%)
Consumer Behavior - Income spent on food at other stores (%)
Consumer Behavior - Income spent on eating out (%)
Consumer Behavior - Income spent on carryout/delivered foods (%)
Current Health Status - General health condition (%)
Current Health Status - Blood donors (%)
Current Health Status - Has blood ever tested for HIV virus (%)
Current Health Status - Left-handed people (%)
Dermatology - People using sunscreen (%)
Diabetes - Diabetics (%)
Diabetes - Had a blood test for high blood sugar (%)
Diabetes - People taking insulin (%)
Diet Behavior & Nutrition - Diet health (%)
Diet Behavior & Nutrition - Milk product consumption (# of products/month)
Diet Behavior & Nutrition - Meals not home prepared (#/week)
Diet Behavior & Nutrition - Meals from fast food or pizza place (#/week)
Diet Behavior & Nutrition - Ready-to-eat foods (#/month)
Diet Behavior & Nutrition - Frozen meals/pizza (#/month)
Drug Use - People that ever used marijuana or hashish (%)
Drug Use - Ever used hard drugs (%)
Drug Use - Ever used any form of cocaine (%)
Drug Use - Ever used heroin (%)
Drug Use - Ever used methamphetamine (%)
Health Insurance - People covered by health insurance (%)
Kidney Conditions-Urology - Avg. # of times urinating at night
Medical Conditions - People with asthma (%)
Medical Conditions - People with anemia (%)
Medical Conditions - People with psoriasis (%)
Medical Conditions - People with overweight (%)
Medical Conditions - Elderly people having difficulties in thinking or remembering (%)
Medical Conditions - People who ever received blood transfusion (%)
Medical Conditions - People having trouble seeing even with glass/contacts (%)
Medical Conditions - People with arthritis (%)
Medical Conditions - People with gout (%)
Medical Conditions - People with congestive heart failure (%)
Medical Conditions - People with coronary heart disease (%)
Medical Conditions - People with angina pectoris (%)
Medical Conditions - People who ever had heart attack (%)
Medical Conditions - People who ever had stroke (%)
Medical Conditions - People with emphysema (%)
Medical Conditions - People with thyroid problem (%)
Medical Conditions - People with chronic bronchitis (%)
Medical Conditions - People with any liver condition (%)
Medical Conditions - People who ever had cancer or malignancy (%)
Mental Health - People who have little interest in doing things (%)
Mental Health - People feeling down, depressed, or hopeless (%)
Mental Health - People who have trouble sleeping or sleeping too much (%)
Mental Health - People feeling tired or having little energy (%)
Mental Health - People with poor appetite or overeating (%)
Mental Health - People feeling bad about themself (%)
Mental Health - People who have trouble concentrating on things (%)
Mental Health - People moving or speaking slowly or too fast (%)
Mental Health - People having thoughts they would be better off dead (%)
Oral Health - Average years since last visit a dentist
Oral Health - People embarrassed because of mouth (%)
Oral Health - People with gum disease (%)
Oral Health - General health of teeth and gums (%)
Oral Health - Average days a week using dental floss/device
Oral Health - Average days a week using mouthwash for dental problem
Oral Health - Average number of teeth
Pesticide Use - Households using pesticides to control insects (%)
Pesticide Use - Households using pesticides to kill weeds (%)
Physical Activity - People doing vigorous-intensity work activities (%)
Physical Activity - People doing moderate-intensity work activities (%)
Physical Activity - People walking or bicycling (%)
Physical Activity - People doing vigorous-intensity recreational activities (%)
Physical Activity - People doing moderate-intensity recreational activities (%)
Physical Activity - Average hours a day doing sedentary activities
Physical Activity - Average hours a day watching TV or videos
Physical Activity - Average hours a day using computer
Physical Functioning - People having limitations keeping them from working (%)
Physical Functioning - People limited in amount of work they can do (%)
Physical Functioning - People that need special equipment to walk (%)
Physical Functioning - People experiencing confusion/memory problems (%)
Physical Functioning - People requiring special healthcare equipment (%)
Prescription Medications - Average number of prescription medicines taking
Preventive Aspirin Use - Adults 40+ taking low-dose aspirin (%)
Reproductive Health - Vaginal deliveries (%)
Reproductive Health - Cesarean deliveries (%)
Reproductive Health - Deliveries resulted in a live birth (%)
Reproductive Health - Pregnancies resulted in a delivery (%)
Reproductive Health - Women breastfeeding newborns (%)
Reproductive Health - Women that had a hysterectomy (%)
Reproductive Health - Women that had both ovaries removed (%)
Reproductive Health - Women that have ever taken birth control pills (%)
Reproductive Health - Women taking birth control pills (%)
Reproductive Health - Women that have ever used Depo-Provera or injectables (%)
Reproductive Health - Women that have ever used female hormones (%)
Sexual Behavior - People 18+ that ever had sex (vaginal, anal, or oral) (%)
Sexual Behavior - Males 18+ that ever had vaginal sex with a woman (%)
Sexual Behavior - Males 18+ that ever performed oral sex on a woman (%)
Sexual Behavior - Males 18+ that ever had anal sex with a woman (%)
Sexual Behavior - Males 18+ that ever had any sex with a man (%)
Sexual Behavior - Females 18+ that ever had vaginal sex with a man (%)
Sexual Behavior - Females 18+ that ever performed oral sex on a man (%)
Sexual Behavior - Females 18+ that ever had anal sex with a man (%)
Sexual Behavior - Females 18+ that ever had any kind of sex with a woman (%)
Sexual Behavior - Average age people first had sex
Sexual Behavior - Average number of female sex partners in lifetime (males 18+)
Sexual Behavior - Average number of female vaginal sex partners in lifetime (males 18+)
Sexual Behavior - Average age people first performed oral sex on a woman (18+)
Sexual Behavior - Average number of woman performed oral sex on in lifetime (18+)
Sexual Behavior - Average number of male sex partners in lifetime (males 18+)
Sexual Behavior - Average number of male anal sex partners in lifetime (males 18+)
Sexual Behavior - Average age people first performed oral sex on a man (18+)
Sexual Behavior - Average number of male oral sex partners in lifetime (18+)
Sexual Behavior - People using protection when performing oral sex (%)
Sexual Behavior - Average number of times people have vaginal or anal sex a year
Sexual Behavior - People having sex without condom (%)
Sexual Behavior - Average number of male sex partners in lifetime (females 18+)
Sexual Behavior - Average number of male vaginal sex partners in lifetime (females 18+)
Sexual Behavior - Average number of female sex partners in lifetime (females 18+)
Sexual Behavior - Circumcised males 18+ (%)
Sleep Disorders - Average hours sleeping at night
Sleep Disorders - People that has trouble sleeping (%)
Smoking-Cigarette Use - People smoking cigarettes (%)
Taste & Smell - People 40+ having problems with smell (%)
Taste & Smell - People 40+ having problems with taste (%)
Taste & Smell - People 40+ that ever had wisdom teeth removed (%)
Taste & Smell - People 40+ that ever had tonsils teeth removed (%)
Taste & Smell - People 40+ that ever had a loss of consciousness because of a head injury (%)
Taste & Smell - People 40+ that ever had a broken nose or other serious injury to face or skull (%)
Taste & Smell - People 40+ that ever had two or more sinus infections (%)
Weight - Average height (inches)
Weight - Average weight (pounds)
Weight - Average BMI
Weight - People that are obese (%)
Weight - People that ever were obese (%)
Weight - People trying to lose weight (%)
According to our research of Pennsylvania and other state lists, there were 16 registered sex offenders living in Bethel Park, Pennsylvania as of June 07, 2024 . The ratio of all residents to sex offenders in Bethel Park is 2,006 to 1.The ratio of registered sex offenders to all residents in this city is much lower than the state average.
Officers per 1,000 residents here:
1.03Pennsylvania average:
2.55
Latest news from Bethel Park, PA collected exclusively by city-data.com from local newspapers, TV, and radio stations
Ancestries: German (18.9%), Italian (17.8%), Irish (9.6%), American (8.1%), Polish (7.7%), Slovak (5.2%).
Current Local Time:
Incorporated on 17/03/1949
Land area: 11.7 square miles.
Population density: 2,804 people per square mile (average).
1,362 residents are foreign born (1.8% Asia , 1.4% Europe ).
This borough:
4.1%Pennsylvania:
7.3%
Median real estate property taxes paid for housing units with mortgages in 2022: $4,445 (1.6%)Median real estate property taxes paid for housing units with no mortgage in 2022: $3,725 (1.5%)
Nearest city with pop. 50,000+: Pittsburgh, PA
Nearest city with pop. 1,000,000+: Philadelphia, PA
Nearest cities:
Latitude: 40.33 N, Longitude: 80.04 W
Daytime population change due to commuting: -2,990 (-9.1%)Workers who live and work in this borough: 6,363 (37.5%)
Area code commonly used in this area: 724
Property values in Bethel Park, PA
Bethel Park tourist attractions:
Unemployment in December 2023: Here:
2.8%Pennsylvania:
2.9%
Most common occupations in Bethel Park, PA (%)
Both Males Females
Sales representatives, services, wholesale and manufacturing (5.0%)
Secretaries and administrative assistants (4.6%)
Retail sales workers, except cashiers (4.2%)
Other sales and related occupations, including supervisors (4.2%)
Computer specialists (4.0%)
Other management occupations, except farmers and farm managers (4.0%)
Registered nurses (3.9%)
Sales representatives, services, wholesale and manufacturing (6.3%)
Computer specialists (5.7%)
Other management occupations, except farmers and farm managers (5.3%)
Engineers (5.1%)
Other sales and related occupations, including supervisors (4.8%)
Top executives (4.3%)
Accountants and auditors (4.1%)
Secretaries and administrative assistants (9.8%)
Registered nurses (8.0%)
Other office and administrative support workers, including supervisors (6.6%)
Preschool, kindergarten, elementary, and middle school teachers (6.5%)
Retail sales workers, except cashiers (5.9%)
Other sales and related occupations, including supervisors (3.4%)
Sales representatives, services, wholesale and manufacturing (3.4%)
Tornado activity:
Bethel Park-area historical tornado activity is near Pennsylvania state average. It is 24% smaller than the overall U.S. average.
On 6/3/1980, a category F4 (max. wind speeds 207-260 mph) tornado 27.6 miles away from the Bethel Park borough center injured 140 people and caused between $50,000,000 and $500,000,000 in damages.
On 8/3/1963, a category F3 (max. wind speeds 158-206 mph) tornado 8.3 miles away from the borough center killed 2 people and injured 70 people and caused between $5,000,000 and $50,000,000 in damages.
Earthquake activity:
Bethel Park-area historical earthquake activity is significantly above Pennsylvania state average. It is 55% smaller than the overall U.S. average. On 8/23/2011 at 17:51:04, a magnitude 5.8 (5.8 MW, Depth: 3.7 mi, Class: Moderate, Intensity: VI - VII) earthquake occurred 201.7 miles away from the city center On 9/25/1998 at 19:52:52, a magnitude 5.2 (4.8 MB, 4.3 MS, 5.2 LG, 4.5 MW, Depth: 3.1 mi) earthquake occurred 82.7 miles away from the city center On 1/31/1986 at 16:46:43, a magnitude 5.0 (5.0 MB) earthquake occurred 105.9 miles away from Bethel Park center On 7/27/1980 at 18:52:21, a magnitude 5.2 (5.1 MB, 4.7 MS, 5.0 UK, 5.2 UK) earthquake occurred 255.5 miles away from the city center On 8/9/2020 at 12:07:37, a magnitude 5.1 (5.1 MW, Depth: 4.7 mi) earthquake occurred 272.5 miles away from Bethel Park center On 12/31/2011 at 20:05:01, a magnitude 4.0 (4.0 ML, Depth: 3.1 mi, Class: Light, Intensity: IV - V) earthquake occurred 64.6 miles away from the city center Magnitude types: regional Lg-wave magnitude (LG), body-wave magnitude (MB), local magnitude (ML), surface-wave magnitude (MS), moment magnitude (MW) Natural disasters: The number of natural disasters in Allegheny County (15) is near the US average (15).Major Disasters (Presidential) Declared: 12Emergencies Declared: 3Floods: 6, Storms: 6, Winter Storms: 3, Hurricanes: 2, Tornadoes: 2, Blizzard: 1, Snowfall: 1, Snowstorm: 1, Tropical Depression: 1, Tropical Storm: 1, Other: 1 (Note: some incidents may be assigned to more than one category). Hospitals and medical centers in Bethel Park: DR GERTRUDE A BARBER CENTER HILLCREST RD (3026 HILLCREST ROAD) DR GERTRUDE A BARBER CENTER ROLLING GREEN (583 ROLLING GREEN DRIVE) MANORCARE HEALTH SERVICES-BETHEL PARK (60 HIGHLAND ROAD)
MEADOWCREST NURSING CENTER (1200 BRAUN ROAD)
FRESENIUS MEDICAL CARE SOUTH HILLS (4651 LIBRARY ROAD)
ADVANCED II (2414 LYTLE ROAD SUITE 201)
Amtrak station near Bethel Park: 9 miles: PITTSBURGH (1100 LIBERTY AVE.) Services: ticket office, fully wheelchair accessible, enclosed waiting area, public restrooms, public payphones, vending machines, ATM, free short-term parking, paid long-term parking, call for car rental service, call for taxi service, intercity bus service, public transit connection.
Colleges/universities with over 2000 students nearest to Bethel Park:
Point Park University (about 8 miles; Pittsburgh, PA ; Full-time enrollment: 3,525)
Duquesne University (about 8 miles; Pittsburgh, PA ; FT enrollment: 8,211)
Community College of Allegheny County (about 9 miles; Pittsburgh, PA ; FT enrollment: 13,486)
The Art Institute of Pittsburgh-Online Division (about 9 miles; Pittsburgh, PA ; FT enrollment: 11,040)
University of Pittsburgh-Pittsburgh Campus (about 10 miles; Pittsburgh, PA ; FT enrollment: 27,137)
Carnegie Mellon University (about 10 miles; Pittsburgh, PA ; FT enrollment: 14,186)
Pittsburgh Technical Institute (about 11 miles; Oakdale, PA ; FT enrollment: 2,805)
Public high school in Bethel Park: BETHEL PARK HS Students: 1,797, Location: 309 CHURCH RD, Grades: 9-12)Private high school in Bethel Park: HILLCREST CHRISTIAN ACADEMY Students: 273, Location: 2500 BETHEL CHURCH RD, Grades: PK-10)
Public elementary/middle schools in Bethel Park: NEIL ARMSTRONG 5-6 MS Students: 782, Location: 5800 MURRAY AVE, Grades: 5-6)INDEPENDENCE MS Students: 776, Location: 2807 BETHEL CHURCH RD, Grades: 7-8)GEORGE WASHINGTON EL SCH Students: 628, Location: 515 CLIFTON RD, Grades: KG-4)BENJAMIN FRANKLIN EL SCH Students: 426, Location: 5400 FLORIDA AVE, Grades: KG-4)BETHEL MEMORIAL EL SCH Students: 335, Location: 3301 S PARK RD, Grades: KG-4)WILLIAM PENN EL SCH Location: 110 WOODLET LN, Grades: KG-4)See full list of schools located in Bethel Park Library in Bethel Park: BETHEL PARK PUBLIC LIBRARY Operating income: $968,618; Location: 5100 WEST LIBRARY AVE; 96,033 books ; 15,627 e-books ; 5,299 audio materials ; 4,261 video materials ; 41 state licensed databases ; 16 other licensed databases ; 387 print serial subscriptions ; 1 electronic serial subscriptions )
Notable locations in Bethel Park: (A) , Bethel Village Station (B) , Casswell Station (C) , Center Station (D) , Dorchester Station (E) , Highland Station (F) , Hillcrest Station (G) , Kings School Station (H) , Latimer Station (I) , Leonard Station (J) , Logan Station (K) , Lytie Station (L) , Mesta Station (M) , Mine 3 Station (N) , Monroe Station (O) , Sandy Creek Station (P) , Santa Barbara Station (Q) , South Park Road Station (R) , Washington Junction Station (S) , West Library Station (T) . Display/hide their locations on the map
Shopping Centers: (1) , Village Square Shopping Center (2) . Display/hide their locations on the map
Churches in Bethel Park include: (A) , South Hills Assembly Church (B) , Saint Valentines Church (C) , Saint Thomas More Church (D) , Saint Germaine Catholic Church (E) , Hamilton Presbyterian Church (F) , First Bethel United Methodist Church (G) , Bethel Presbyterian Church Preschool (H) , Bethel Presbyterian Church (I) . Display/hide their locations on the map
Cemeteries: (1) , Saint Vladimer Cemetery (2) . Display/hide their locations on the map
Courts:
Birthplace of: Armen Gilliam - Basketball player, Barbara Feldon - Actress, Matthew H. Smith - Politician, Mike Westhoff - Football coach, Chris Peters - Baseball player, Tom Skladany - Football player.
Allegheny County has a predicted average indoor radon screening level greater than 4 pCi/L (pico curies per liter) - Highest Potential Average household size: This borough:
2.4 peoplePennsylvania:
2.5 people
Percentage of family households: This borough:
67.2%Whole state:
65.0%
Percentage of households with unmarried partners: This borough:
3.8%Whole state:
6.6%
Likely homosexual households (counted as self-reported same-sex unmarried-partner households)
Lesbian couples: 0.3% of all households Gay men: 0.1% of all households
People in group quarters in Bethel Park in 2010:
184 people in nursing facilities/skilled-nursing facilities
23 people in group homes intended for adults
5 people in other noninstitutional facilities
3 people in residential treatment centers for adults
2 people in workers' group living quarters and job corps centers
People in group quarters in Bethel Park in 2000:
263 people in nursing homes
87 people in other noninstitutional group quarters
14 people in homes for the mentally retarded
8 people in training schools for juvenile delinquents
7 people in religious group quarters
3 people in other group homes
Banks with branches in Bethel Park (2011 data):
PNC Bank, National Association: South Park Branch, St. Clair Banking Center Branch, Library Branch, Bethel Park Branch. Info updated 2012/03/20: Bank assets: $263,309.6 mil, Deposits: $197,343.0 mil, headquarters in Wilmington, DE, positive income , Commercial Lending Specialization, 3085 total offices , Holding Company: Pnc Financial Services Group, Inc., The
Brentwood Bank: at 411 Mcmurray Road, Suite 200, South Park Shops Office Branch, Bethel Park Retirement Home Branch, Bethel Park Branch. Info updated 2007/10/10: Bank assets: $465.8 mil, Deposits: $387.3 mil, local headquarters , positive income , Commercial Lending Specialization, 8 total offices
Citizens Bank of Pennsylvania: Village Square Giant Eagle Branch, Bethel Park Giant Eagle Branch, Bethel-St. Clair Branch. Info updated 2010/09/24: Bank assets: $32,316.9 mil, Deposits: $25,297.1 mil, headquarters in Philadelphia, PA, positive income , 396 total offices , Holding Company: Uk Financial Investments Limited
First National Bank of Pennsylvania: Bethel Park Office Branch at 3400 S Park Rd, branch established on 1925/01/01; Village Square Branch at 1500 Oxford Drive, branch established on 1989/02/07. Info updated 2012/01/10: Bank assets: $9,581.0 mil, Deposits: $7,462.2 mil, headquarters in Greenville, PA, positive income , Commercial Lending Specialization, 291 total offices , Holding Company: F.N.b. Corporation
First Niagara Bank, National Association: Hillcrest Branch at 4996 Library Road, branch established on 1955/01/29. Info updated 2011/06/09: Bank assets: $32,750.6 mil, Deposits: $19,595.4 mil, headquarters in Buffalo, NY, positive income , Commercial Lending Specialization, 351 total offices , Holding Company: First Niagara Financial Group, Inc.
The Huntington National Bank: Bethel Park Branch at 2739 South Park Rd, branch established on 1890/01/01. Info updated 2012/04/02: Bank assets: $54,183.4 mil, Deposits: $44,300.3 mil, headquarters in Columbus, OH, positive income , Commercial Lending Specialization, 878 total offices , Holding Company: Huntington Bancshares Incorporated
Northwest Savings Bank: Library Road Branch at 6257 Library Road, branch established on 1935/06/06. Info updated 2009/11/23: Bank assets: $7,975.9 mil, Deposits: $5,985.6 mil, headquarters in Warren, PA, positive income , Mortgage Lending Specialization, 172 total offices
For population 15 years and over in Bethel Park:
Never married: 25.9%Now married: 57.8%Separated: 1.4%Widowed: 7.0%Divorced: 7.9% For population 25 years and over in Bethel Park:
High school or higher: 96.9%Bachelor's degree or higher: 51.0%Graduate or professional degree: 17.5%Unemployed: 3.5%Mean travel time to work (commute): 19.9 minutes
Education Gini index (Inequality in education) Here:
9.0Pennsylvania average:
11.4
Religion statistics for Bethel Park, PA (based on Allegheny County data)
Religion Adherents Congregations Catholic 460,672 183 Mainline Protestant 139,551 414 Evangelical Protestant 78,101 349 Other 38,781 98 Black Protestant 14,268 75 Orthodox 9,606 29 None 482,369 -
Source: Clifford Grammich, Kirk Hadaway, Richard Houseal, Dale E.Jones, Alexei Krindatch, Richie Stanley and Richard H.Taylor. 2012. 2010 U.S.Religion Census: Religious Congregations & Membership Study. Association of Statisticians of American Religious Bodies. Jones, Dale E., et al. 2002. Congregations and Membership in the United States 2000. Nashville, TN: Glenmary Research Center. Graphs represent county-level data
Food Environment Statistics: Number of grocery stores : 209This county :
1.72 / 10,000 pop.State :
2.04 / 10,000 pop.
Number of supercenters and club stores : 11Here :
0.09 / 10,000 pop.Pennsylvania :
0.09 / 10,000 pop.
Number of convenience stores (no gas) : 133This county :
1.09 / 10,000 pop.Pennsylvania :
0.88 / 10,000 pop.
Number of convenience stores (with gas) : 297This county :
2.44 / 10,000 pop.Pennsylvania :
2.52 / 10,000 pop.
Number of full-service restaurants : 993Here :
8.15 / 10,000 pop.State :
7.12 / 10,000 pop.
Adult diabetes rate : This county :
8.7%Pennsylvania :
9.1%
Adult obesity rate : Allegheny County :
26.3%Pennsylvania :
27.2%
Low-income preschool obesity rate : This county :
12.9%Pennsylvania :
11.5%
Health and Nutrition: Healthy diet rate : Bethel Park:
53.8%Pennsylvania:
50.2%
Average overall health of teeth and gums : This city:
51.6%Pennsylvania:
47.1%
Average BMI : Bethel Park:
28.4Pennsylvania:
28.7
People feeling badly about themselves : This city:
20.6%Pennsylvania:
20.8%
People not drinking alcohol at all : Bethel Park:
9.2%State:
10.9%
Average hours sleeping at night : Overweight people : Here:
36.1%Pennsylvania:
34.3%
General health condition : Bethel Park:
58.7%Pennsylvania:
56.2%
Average condition of hearing : Here:
78.0%Pennsylvania:
78.3%
More about Health and Nutrition of Bethel Park, PA Residents
Local government employment and payroll (March 2022)
Function
Full-time employees
Monthly full-time payroll
Average yearly full-time wage
Part-time employees
Monthly part-time payroll
Police Protection - Officers
40 $381,352 $114,406 0 $0 Streets and Highways
28 $150,814 $64,635 0 $0 Sewerage
11 $60,429 $65,923 0 $0 Financial Administration
10 $62,265 $74,718 0 $0 Police - Other
4 $19,725 $59,175 29 $39,654 Parks and Recreation
3 $13,912 $55,648 52 $66,304 Other Government Administration
2 $7,442 $44,652 0 $0
Totals for Government
98 $695,939 $85,217 81 $105,958
Bethel Park government finances - Expenditure in 2021 (per resident):
Construction - Regular Highways: $1,804,000 ($55.03)
Local Fire Protection: $140,000 ($4.27)Current Operations - Sewerage: $9,562,000 ($291.68)
Police Protection: $8,264,000 ($252.09)Regular Highways: $7,770,000 ($237.02)Solid Waste Management: $2,102,000 ($64.12)Parks and Recreation: $1,183,000 ($36.09)Judicial and Legal Services: $1,164,000 ($35.51)General Public Buildings: $908,000 ($27.70)Libraries: $809,000 ($24.68)Local Fire Protection: $716,000 ($21.84)General - Other: $715,000 ($21.81)Financial Administration: $542,000 ($16.53)Housing and Community Development: $173,000 ($5.28)General - Interest on Debt: $610,000 ($18.61)
Other Capital Outlay - Central Staff Services: $662,000 ($20.19)
Police Protection: $161,000 ($4.91)Parks and Recreation: $20,000 ($0.61)Total Salaries and Wages: $8,737,000 ($266.52)
Bethel Park government finances - Revenue in 2021 (per resident):
Charges - Sewerage: $9,564,000 ($291.75)
Other: $364,000 ($11.10)Parks and Recreation: $234,000 ($7.14)Local Intergovernmental - Other: $1,203,000 ($36.70)
Miscellaneous - General Revenue - Other: $203,000 ($6.19)
Interest Earnings: $184,000 ($5.61)Rents: $109,000 ($3.32)Sale of Property: $78,000 ($2.38)Fines and Forfeits: $77,000 ($2.35)Donations From Private Sources: $14,000 ($0.43)State Intergovernmental - Highways: $982,000 ($29.96)
Other: $891,000 ($27.18)General Local Government Support: $25,000 ($0.76)Tax - Individual Income: $9,632,000 ($293.82)
Property: $6,803,000 ($207.52)Documentary and Stock Transfer: $1,973,000 ($60.19)Occupation and Business License - Other: $953,000 ($29.07)Public Utility License: $793,000 ($24.19)Other Selective Sales: $9,000 ($0.27)Amusements Sales: $7,000 ($0.21)
Bethel Park government finances - Debt in 2021 (per resident):
Long Term Debt - Outstanding Unspecified Public Purpose: $20,702,000 ($631.51)
Beginning Outstanding - Unspecified Public Purpose: $20,576,000 ($627.66)Issue, Unspecified Public Purpose: $711,000 ($21.69)Retired Unspecified Public Purpose: $585,000 ($17.85)
Bethel Park government finances - Cash and Securities in 2021 (per resident):
Bond Funds - Cash and Securities: $1,189,000 ($36.27)
Other Funds - Cash and Securities: $16,543,000 ($504.64)
4.01% of this county's 2021 resident taxpayers lived in other counties in 2020 ($71,916 average adjusted gross income )
Here:
4.01%Pennsylvania average:
5.27%
0.01% of residents moved from foreign countries ($162 average AGI )Allegheny County:
0.01%Pennsylvania average:
0.01%
Top counties from which taxpayers relocated into this county between 2020 and 2021:
4.90% of this county's 2020 resident taxpayers moved to other counties in 2021 ($87,789 average adjusted gross income )
Here:
4.90%Pennsylvania average:
5.44%
0.01% of residents moved to foreign countries ($61 average AGI )Allegheny County:
0.01%Pennsylvania average:
0.01%
Top counties to which taxpayers relocated from this county between 2020 and 2021:
Businesses in Bethel Park, PA
Name Count Name Count
ALDI 1 Lowe's 1 Ace Hardware 1 McDonald's 1 Advance Auto Parts 1 New Balance 1 American Eagle Outfitters 1 Office Depot 1 Arby's 1 Olive Garden 1 Avenue 1 Panera Bread 1 Bally Total Fitness 1 Papa John's Pizza 1 Bed Bath & Beyond 1 Pizza Hut 1 Burger King 1 Quiznos 1 Burlington Coat Factory 1 RadioShack 1 CVS 1 Red Robin 1 Cricket Wireless 1 Rite Aid 2 Curves 1 Starbucks 1 Dairy Queen 1 Subway 4 Famous Footwear 1 T-Mobile 3 Fashion Bug 1 T.G.I. Driday's 1 FedEx 4 Toys"R"Us 1 Firestone Complete Auto Care 1 True Value 1 GNC 3 U-Haul 2 GameStop 1 UPS 4 Home Depot 1 Walgreens 1 KFC 1 Walmart 1 Kohl's 1 Wendy's 1 LA Fitness 1
Strongest AM radio stations in Bethel Park:
KDKA (1020 AM; 50 kW; PITTSBURGH, PA; Owner: INFINITY BROADCASTING OPERATIONS, INC.)
WWCS (540 AM; 5 kW; CANONSBURG, PA; Owner: BIRACH BROADCASTING CORPORATION)
WEAE (1250 AM; 5 kW; PITTSBURGH, PA; Owner: ABC, INC.)
WPTT (1360 AM; 5 kW; MCKEESPORT, PA; Owner: RENDA BROADCASTING CORPORATION OF NEVADA)
WJAS (1320 AM; 6 kW; PITTSBURGH, PA; Owner: RENDA BROADCASTING CORP. OF NEVADA)
WPIT (730 AM; 5 kW; PITTSBURGH, PA; Owner: PENNSYLVANIA MEDIA ASSOCIATES, INC.)
WZUM (1590 AM; 4 kW; CARNEGIE, PA; Owner: HORVATH BROADCASTING, L.L.C.)
WBGG (970 AM; 5 kW; PITTSBURGH, PA; Owner: AMFM RADIO LICENSES, L.L.C.)
WKHB (620 AM; 6 kW; IRWIN, PA; Owner: BROADCAST COMMUNICATIONS, INC.)
WWVA (1170 AM; 53 kW; WHEELING, WV; Owner: CAPSTAR TX LIMITED PARTNERSHIP)
KQV (1410 AM; 5 kW; PITTSBURGH, PA; Owner: CALVARY, INC.)
WPGR (1510 AM; 5 kW; MONROEVILLE, PA; Owner: MCL/ MCM- INC.)
WASP (1130 AM; daytime; 5 kW; BROWNSVILLE, PA; Owner: KEYMARKET LICENSES, LLC)
Strongest FM radio stations in Bethel Park:
WSHH (99.7 FM; PITTSBURGH, PA; Owner: RENDA B/CING CORP. OF NEVADA)
WKST-FM (96.1 FM; PITTSBURGH, PA; Owner: CAPSTAR TX LIMITED PARTNERSHIP)
WWSW-FM (94.5 FM; PITTSBURGH, PA; Owner: AMFM RADIO LICENSES, L.L.C.)
WDSY-FM (107.9 FM; PITTSBURGH, PA; Owner: INFINITY RADIO SUBSIDIARY OPERATIONS INC.)
WBZZ (93.7 FM; PITTSBURGH, PA; Owner: INFINITY RADIO SUBSIDIARY OPERATIONS INC.)
WQED-FM (89.3 FM; PITTSBURGH, PA; Owner: WQED MULTIMEDIA)
WLTJ (92.9 FM; PITTSBURGH, PA; Owner: WPNT, INC.)
WDUQ (90.5 FM; PITTSBURGH, PA; Owner: DUQUESNE UNIVERSITY)
WRRK (96.9 FM; BRADDOCK, PA; Owner: WPNT INC)
WDVE (102.5 FM; PITTSBURGH, PA; Owner: CAPSTAR TX LIMITED PARTNERSHIP)
WJJJ (104.7 FM; PITTSBURGH, PA; Owner: CAPSTAR TX LIMITED PARTNERSHIP)
WPTS-FM (92.1 FM; PITTSBURGH, PA; Owner: UNIV. OF PITTSBURGH COMMONWEALTH SYS)
WYEP-FM (91.3 FM; PITTSBURGH, PA; Owner: PITTSBURGH COMM. B/CING. CORP.)
WORD-FM (101.5 FM; PITTSBURGH, PA; Owner: PENNSYLVANIA MEDIA ASSOCIATES, INC.)
WOGI (98.3 FM; DUQUESNE, PA; Owner: KEYMARKET LICENSES, LLC)
WZPT (100.7 FM; NEW KENSINGTON, PA; Owner: INFINITY RADIO SUBSIDIARY OPERATIONS INC.)
WXDX-FM (105.9 FM; PITTSBURGH, PA; Owner: CAPSTAR TX LIMITED PARTNERSHIP)
WJPA-FM (95.3 FM; WASHINGTON, PA; Owner: WASHINGTON BROADCASTING COMPANY)
WOGG (94.9 FM; OLIVER, PA; Owner: KEYMARKET LICENSES, LLC)
WOGH (103.5 FM; BURGETTSTOWN, PA; Owner: KEYMARKET LICENSES, LLC)
TV broadcast stations around Bethel Park:
WPXI (Channel 11; PITTSBURGH, PA; Owner: WPXI-TV HOLDINGS, INC.)
W65CG (Channel 65; PITTSBURGH, PA; Owner: TRINITY BROADCASTING NETWORK)
WBGN-LP (Channel 59; PITTSBURGH, PA; Owner: BRUNO GOODWORTH NETWORK, INC.)
WPTG-LP (Channel 69; PITTSBURGH, PA; Owner: ABACUS TELEVISION)
WQEX (Channel 16; PITTSBURGH, PA; Owner: WQED MULTIMEDIA)
WTAE-TV (Channel 4; PITTSBURGH, PA; Owner: WTAE HEARST-ARGYLE TV, INC. (CA CORP.))
KDKA-TV (Channel 2; PITTSBURGH, PA; Owner: CBS BROADCASTING INC.)
WQED (Channel 13; PITTSBURGH, PA; Owner: WQED MULTIMEDIA)
W61CC (Channel 61; PITTSBURGH, PA; Owner: THE VIDEOHOUSE, INC.)
WPGH-TV (Channel 53; PITTSBURGH, PA; Owner: WPGH LICENSEE, LLC)
WIIC-LP (Channel 29; PITTSBURGH, PA; Owner: ABACUS TELEVISION)
WPCB-TV (Channel 40; GREENSBURG, PA; Owner: CORNERSTONE TELEVISION, INC.)
W63AU (Channel 63; PITTSBURGH, PA; Owner: THE BON-TELE NETWORK, INC.)
WTOV-TV (Channel 9; STEUBENVILLE, OH; Owner: WTOV-TV HOLDINGS, INC.)
WBPA-LP (Channel 29; PITTSBURGH, PA; Owner: VENTURE TECHNOLOGIES GROUP, LLC)
WBYD-CA (Channel 35; JOHNSTOWN, PA; Owner: BENJAMIN PEREZ)
WCWB (Channel 22; PITTSBURGH, PA; Owner: WCWB LICENSEE, LLC)
W20AN (Channel 20; WASHINGTON, PA; Owner: TURNPIKE TELEVISION)
W26AV (Channel 26; CHARLEROI, PA; Owner: DEBRA GOODWORTH)
W25CI (Channel 25; STEUBENVILLE, OH; Owner: ABACUS TELEVISION)
W57BH (Channel 57; WEIRTON, WV; Owner: TURNPIKE TELEVISION)
W66BQ (Channel 66; BEAVER, PA; Owner: BRUNO-GOODWORTH NETWORK, INC.)
National Bridge Inventory (NBI) Statistics 12 Number of bridges56ft / 17.2m Total length $470,000 Total costs75,631 Total average daily traffic3,306 Total average daily truck traffic110,881 Total future (year 2025) average daily traffic
New bridges - historical statistics
3 1960-1969 2 1970-1979 2 1980-1989 2 1990-1999 1 2000-2009 2 2020-2022
See full National Bridge Inventory statistics for Bethel Park, PA
Home Mortgage Disclosure Act Aggregated Statistics For Year 2009(Based on 8 full tracts) A) FHA, FSA/RHS & VA B) Conventional C) Refinancings D) Home Improvement Loans E) Loans on Dwellings For 5+ Families F) Non-occupant Loans on G) Loans On Manufactured Number Average Value Number Average Value Number Average Value Number Average Value Number Average Value Number Average Value Number Average Value
LOANS ORIGINATED 175 $146,114 199 $136,492 671 $131,800 83 $51,614 2 $2,127,500 15 $105,333 0 $0 APPLICATIONS APPROVED, NOT ACCEPTED 6 $151,167 15 $153,067 54 $131,722 11 $34,364 0 $0 1 $85,000 0 $0 APPLICATIONS DENIED 9 $135,444 13 $120,000 194 $140,933 36 $39,194 0 $0 5 $84,000 1 $15,000 APPLICATIONS WITHDRAWN 14 $146,571 10 $99,700 125 $145,608 10 $70,100 0 $0 5 $146,800 1 $50,000 FILES CLOSED FOR INCOMPLETENESS 6 $131,167 2 $160,000 37 $127,486 1 $60,000 0 $0 1 $155,000 0 $0
Aggregated Statistics For Year 2008(Based on 8 full tracts) A) FHA, FSA/RHS & VA B) Conventional C) Refinancings D) Home Improvement Loans E) Loans on Dwellings For 5+ Families F) Non-occupant Loans on G) Loans On Manufactured Number Average Value Number Average Value Number Average Value Number Average Value Number Average Value Number Average Value Number Average Value
LOANS ORIGINATED 92 $138,826 226 $130,752 283 $122,777 110 $31,682 1 $1,500,000 26 $134,615 0 $0 APPLICATIONS APPROVED, NOT ACCEPTED 7 $155,571 20 $114,500 44 $138,477 15 $17,467 0 $0 2 $108,000 1 $123,000 APPLICATIONS DENIED 13 $142,308 25 $122,800 208 $132,188 56 $45,964 0 $0 11 $84,818 4 $60,500 APPLICATIONS WITHDRAWN 6 $151,667 21 $110,476 68 $138,338 12 $27,417 0 $0 3 $57,333 0 $0 FILES CLOSED FOR INCOMPLETENESS 2 $133,000 4 $102,250 14 $130,286 4 $60,000 0 $0 0 $0 0 $0
Aggregated Statistics For Year 2007(Based on 8 full tracts) A) FHA, FSA/RHS & VA B) Conventional C) Refinancings D) Home Improvement Loans F) Non-occupant Loans on G) Loans On Manufactured Number Average Value Number Average Value Number Average Value Number Average Value Number Average Value Number Average Value
LOANS ORIGINATED 46 $129,717 436 $109,654 350 $105,949 187 $45,096 38 $96,605 2 $39,500 APPLICATIONS APPROVED, NOT ACCEPTED 1 $148,000 23 $114,870 74 $119,811 33 $62,394 2 $67,500 1 $60,000 APPLICATIONS DENIED 4 $113,750 44 $115,568 323 $127,136 96 $47,979 10 $185,200 2 $98,500 APPLICATIONS WITHDRAWN 9 $116,889 20 $101,300 113 $125,549 15 $74,467 1 $96,000 0 $0 FILES CLOSED FOR INCOMPLETENESS 2 $162,500 5 $114,800 23 $121,739 3 $47,667 0 $0 0 $0
Aggregated Statistics For Year 2006(Based on 8 full tracts) A) FHA, FSA/RHS & VA B) Conventional C) Refinancings D) Home Improvement Loans F) Non-occupant Loans on G) Loans On Manufactured Number Average Value Number Average Value Number Average Value Number Average Value Number Average Value Number Average Value
LOANS ORIGINATED 41 $128,049 520 $101,612 469 $94,507 208 $38,423 29 $76,000 2 $22,000 APPLICATIONS APPROVED, NOT ACCEPTED 0 $0 43 $99,837 89 $101,955 38 $36,553 3 $90,000 0 $0 APPLICATIONS DENIED 3 $79,000 47 $84,574 348 $119,149 90 $39,489 18 $92,389 0 $0 APPLICATIONS WITHDRAWN 4 $143,000 39 $102,333 171 $113,702 18 $81,000 5 $87,600 0 $0 FILES CLOSED FOR INCOMPLETENESS 0 $0 4 $173,750 27 $124,704 3 $42,333 1 $92,000 0 $0
Aggregated Statistics For Year 2005(Based on 8 full tracts) A) FHA, FSA/RHS & VA B) Conventional C) Refinancings D) Home Improvement Loans E) Loans on Dwellings For 5+ Families F) Non-occupant Loans on G) Loans On Manufactured Number Average Value Number Average Value Number Average Value Number Average Value Number Average Value Number Average Value Number Average Value
LOANS ORIGINATED 57 $130,860 487 $107,858 594 $106,904 196 $40,214 0 $0 54 $68,426 1 $16,000 APPLICATIONS APPROVED, NOT ACCEPTED 1 $113,000 35 $103,200 96 $106,760 25 $38,800 0 $0 10 $70,200 4 $35,000 APPLICATIONS DENIED 3 $161,667 42 $97,381 343 $119,061 80 $36,850 0 $0 22 $36,545 1 $7,000 APPLICATIONS WITHDRAWN 4 $114,000 46 $121,978 242 $127,079 29 $86,586 2 $102,000 16 $95,250 0 $0 FILES CLOSED FOR INCOMPLETENESS 0 $0 5 $96,000 45 $156,756 4 $53,750 0 $0 1 $298,000 0 $0
Aggregated Statistics For Year 2004(Based on 8 full tracts) A) FHA, FSA/RHS & VA B) Conventional C) Refinancings D) Home Improvement Loans E) Loans on Dwellings For 5+ Families F) Non-occupant Loans on G) Loans On Manufactured Number Average Value Number Average Value Number Average Value Number Average Value Number Average Value Number Average Value Number Average Value
LOANS ORIGINATED 45 $123,578 418 $117,268 886 $102,948 224 $43,652 3 $740,000 44 $75,773 7 $5,857 APPLICATIONS APPROVED, NOT ACCEPTED 1 $115,000 41 $135,463 161 $97,857 34 $38,971 0 $0 7 $206,857 1 $54,000 APPLICATIONS DENIED 2 $151,000 41 $104,707 330 $110,991 79 $24,532 0 $0 23 $52,087 1 $88,000 APPLICATIONS WITHDRAWN 4 $101,500 42 $126,690 229 $115,843 23 $49,130 0 $0 6 $103,000 0 $0 FILES CLOSED FOR INCOMPLETENESS 1 $189,000 10 $104,800 100 $125,740 10 $64,100 0 $0 6 $64,833 0 $0
Aggregated Statistics For Year 2003(Based on 8 full tracts) A) FHA, FSA/RHS & VA B) Conventional C) Refinancings D) Home Improvement Loans E) Loans on Dwellings For 5+ Families F) Non-occupant Loans on Number Average Value Number Average Value Number Average Value Number Average Value Number Average Value Number Average Value
LOANS ORIGINATED 56 $105,321 493 $116,830 2,042 $102,087 195 $41,723 2 $1,150,000 58 $82,621 APPLICATIONS APPROVED, NOT ACCEPTED 1 $98,000 44 $92,591 349 $100,206 42 $49,476 0 $0 4 $50,500 APPLICATIONS DENIED 1 $139,000 36 $94,722 573 $109,920 72 $32,722 0 $0 21 $50,667 APPLICATIONS WITHDRAWN 4 $123,500 39 $154,487 265 $115,506 21 $29,238 0 $0 10 $66,000 FILES CLOSED FOR INCOMPLETENESS 1 $83,000 15 $139,200 67 $128,418 7 $39,857 0 $0 0 $0
Aggregated Statistics For Year 2002(Based on 8 full tracts) A) FHA, FSA/RHS & VA B) Conventional C) Refinancings D) Home Improvement Loans E) Loans on Dwellings For 5+ Families F) Non-occupant Loans on Number Average Value Number Average Value Number Average Value Number Average Value Number Average Value Number Average Value
LOANS ORIGINATED 53 $102,208 459 $105,261 1,209 $101,219 137 $36,248 2 $499,500 18 $71,111 APPLICATIONS APPROVED, NOT ACCEPTED 6 $100,167 30 $91,033 247 $94,259 39 $42,590 0 $0 5 $77,200 APPLICATIONS DENIED 7 $99,429 32 $94,500 372 $98,384 48 $24,271 0 $0 10 $45,700 APPLICATIONS WITHDRAWN 4 $92,750 33 $92,576 211 $98,664 18 $21,000 0 $0 10 $80,700 FILES CLOSED FOR INCOMPLETENESS 0 $0 12 $103,500 90 $104,300 7 $42,429 0 $0 1 $104,000
Aggregated Statistics For Year 2001(Based on 8 full tracts) A) FHA, FSA/RHS & VA B) Conventional C) Refinancings D) Home Improvement Loans E) Loans on Dwellings For 5+ Families F) Non-occupant Loans on Number Average Value Number Average Value Number Average Value Number Average Value Number Average Value Number Average Value
LOANS ORIGINATED 83 $101,916 397 $98,975 1,049 $87,981 233 $31,253 1 $8,800,000 24 $68,917 APPLICATIONS APPROVED, NOT ACCEPTED 5 $74,800 41 $65,463 199 $73,352 79 $23,481 0 $0 1 $102,000 APPLICATIONS DENIED 5 $98,600 36 $80,500 340 $88,318 98 $26,582 0 $0 8 $56,250 APPLICATIONS WITHDRAWN 5 $116,400 28 $91,464 215 $98,823 32 $26,562 0 $0 5 $122,600 FILES CLOSED FOR INCOMPLETENESS 1 $139,000 2 $119,000 46 $97,130 6 $32,000 0 $0 1 $41,000
Aggregated Statistics For Year 2000(Based on 8 full tracts) A) FHA, FSA/RHS & VA B) Conventional C) Refinancings D) Home Improvement Loans F) Non-occupant Loans on Number Average Value Number Average Value Number Average Value Number Average Value Number Average Value
LOANS ORIGINATED 58 $93,741 401 $98,878 362 $69,221 169 $24,533 11 $73,545 APPLICATIONS APPROVED, NOT ACCEPTED 4 $83,500 35 $78,171 92 $79,641 41 $25,854 2 $183,000 APPLICATIONS DENIED 3 $124,333 37 $70,973 199 $82,231 64 $21,281 10 $36,300 APPLICATIONS WITHDRAWN 3 $106,333 27 $89,407 99 $91,333 25 $37,840 3 $123,667 FILES CLOSED FOR INCOMPLETENESS 0 $0 6 $74,000 55 $91,982 1 $42,000 1 $36,000
Aggregated Statistics For Year 1999(Based on 8 full tracts) A) FHA, FSA/RHS & VA B) Conventional C) Refinancings D) Home Improvement Loans F) Non-occupant Loans on Number Average Value Number Average Value Number Average Value Number Average Value Number Average Value
LOANS ORIGINATED 72 $92,847 360 $102,130 587 $75,888 196 $26,476 21 $88,890 APPLICATIONS APPROVED, NOT ACCEPTED 4 $97,735 19 $81,248 174 $67,334 46 $20,902 0 $0 APPLICATIONS DENIED 1 $57,980 32 $107,383 250 $71,517 49 $24,426 2 $93,850 APPLICATIONS WITHDRAWN 5 $100,382 32 $97,824 139 $81,568 37 $48,893 4 $96,410 FILES CLOSED FOR INCOMPLETENESS 0 $0 9 $82,238 41 $99,346 1 $15,000 1 $19,890
Detailed HMDA statistics for the following Tracts:
4751.01
, 4751.02 , 4752.00 , 4753.01 , 4753.03 , 4753.04 , 4754.01 , 4754.02
Private Mortgage Insurance Companies Aggregated Statistics For Year 2009(Based on 8 full tracts) A) Conventional B) Refinancings Number Average Value Number Average Value
LOANS ORIGINATED 62 $152,758 20 $168,800 APPLICATIONS APPROVED, NOT ACCEPTED 9 $204,222 10 $161,100 APPLICATIONS DENIED 3 $145,333 8 $157,250 APPLICATIONS WITHDRAWN 0 $0 0 $0 FILES CLOSED FOR INCOMPLETENESS 1 $221,000 2 $140,000
Aggregated Statistics For Year 2008(Based on 8 full tracts) A) Conventional B) Refinancings C) Non-occupant Loans on Number Average Value Number Average Value Number Average Value
LOANS ORIGINATED 92 $139,054 30 $157,433 6 $131,333 APPLICATIONS APPROVED, NOT ACCEPTED 15 $126,000 9 $168,111 1 $153,000 APPLICATIONS DENIED 4 $129,250 0 $0 2 $117,500 APPLICATIONS WITHDRAWN 2 $139,500 1 $368,000 0 $0 FILES CLOSED FOR INCOMPLETENESS 1 $190,000 0 $0 0 $0
Aggregated Statistics For Year 2007(Based on 8 full tracts) A) Conventional B) Refinancings C) Non-occupant Loans on Number Average Value Number Average Value Number Average Value
LOANS ORIGINATED 96 $134,312 23 $155,435 5 $128,600 APPLICATIONS APPROVED, NOT ACCEPTED 9 $128,556 4 $228,000 1 $149,000 APPLICATIONS DENIED 0 $0 0 $0 0 $0 APPLICATIONS WITHDRAWN 6 $148,333 2 $142,000 2 $130,000 FILES CLOSED FOR INCOMPLETENESS 0 $0 0 $0 0 $0
Aggregated Statistics For Year 2006(Based on 8 full tracts) A) Conventional B) Refinancings C) Non-occupant Loans on Number Average Value Number Average Value Number Average Value
LOANS ORIGINATED 54 $136,407 26 $145,962 3 $97,333 APPLICATIONS APPROVED, NOT ACCEPTED 5 $180,000 9 $171,556 0 $0 APPLICATIONS DENIED 2 $419,000 0 $0 0 $0 APPLICATIONS WITHDRAWN 0 $0 1 $89,000 0 $0 FILES CLOSED FOR INCOMPLETENESS 0 $0 0 $0 0 $0
Aggregated Statistics For Year 2005(Based on 8 full tracts) A) Conventional B) Refinancings C) Non-occupant Loans on Number Average Value Number Average Value Number Average Value
LOANS ORIGINATED 71 $122,000 35 $147,057 7 $70,143 APPLICATIONS APPROVED, NOT ACCEPTED 14 $143,000 5 $143,800 0 $0 APPLICATIONS DENIED 3 $141,667 1 $109,000 0 $0 APPLICATIONS WITHDRAWN 2 $143,500 4 $123,250 0 $0 FILES CLOSED FOR INCOMPLETENESS 0 $0 1 $148,000 0 $0
Aggregated Statistics For Year 2004(Based on 8 full tracts) A) Conventional B) Refinancings C) Non-occupant Loans on Number Average Value Number Average Value Number Average Value
LOANS ORIGINATED 60 $132,750 61 $135,951 3 $111,667 APPLICATIONS APPROVED, NOT ACCEPTED 15 $138,867 26 $143,077 1 $102,000 APPLICATIONS DENIED 0 $0 1 $171,000 0 $0 APPLICATIONS WITHDRAWN 4 $180,500 5 $115,000 0 $0 FILES CLOSED FOR INCOMPLETENESS 0 $0 0 $0 0 $0
Aggregated Statistics For Year 2003(Based on 8 full tracts) A) Conventional B) Refinancings C) Non-occupant Loans on Number Average Value Number Average Value Number Average Value
LOANS ORIGINATED 123 $134,187 150 $130,420 12 $101,750 APPLICATIONS APPROVED, NOT ACCEPTED 10 $127,100 35 $150,686 1 $100,000 APPLICATIONS DENIED 0 $0 1 $145,000 0 $0 APPLICATIONS WITHDRAWN 7 $124,429 7 $144,000 2 $81,000 FILES CLOSED FOR INCOMPLETENESS 0 $0 1 $90,000 0 $0
Aggregated Statistics For Year 2002(Based on 8 full tracts) A) Conventional B) Refinancings C) Non-occupant Loans on Number Average Value Number Average Value Number Average Value
LOANS ORIGINATED 116 $120,466 91 $130,066 6 $67,833 APPLICATIONS APPROVED, NOT ACCEPTED 8 $125,250 16 $149,625 0 $0 APPLICATIONS DENIED 1 $90,000 1 $81,000 0 $0 APPLICATIONS WITHDRAWN 6 $107,167 5 $139,200 0 $0 FILES CLOSED FOR INCOMPLETENESS 1 $121,000 1 $134,000 0 $0
Aggregated Statistics For Year 2001(Based on 8 full tracts) A) Conventional B) Refinancings C) Non-occupant Loans on Number Average Value Number Average Value Number Average Value
LOANS ORIGINATED 120 $119,600 72 $130,542 3 $118,000 APPLICATIONS APPROVED, NOT ACCEPTED 17 $113,765 12 $138,583 0 $0 APPLICATIONS DENIED 3 $106,000 2 $134,000 2 $103,000 APPLICATIONS WITHDRAWN 1 $190,000 1 $148,000 0 $0 FILES CLOSED FOR INCOMPLETENESS 0 $0 0 $0 0 $0
Aggregated Statistics For Year 2000(Based on 8 full tracts) A) Conventional B) Refinancings C) Non-occupant Loans on Number Average Value Number Average Value Number Average Value
LOANS ORIGINATED 118 $109,517 18 $119,389 3 $38,333 APPLICATIONS APPROVED, NOT ACCEPTED 8 $153,750 7 $105,857 1 $36,000 APPLICATIONS DENIED 0 $0 1 $189,000 0 $0 APPLICATIONS WITHDRAWN 1 $79,000 0 $0 0 $0 FILES CLOSED FOR INCOMPLETENESS 0 $0 1 $119,000 0 $0
Aggregated Statistics For Year 1999(Based on 8 full tracts) A) Conventional B) Refinancings C) Non-occupant Loans on Number Average Value Number Average Value Number Average Value
LOANS ORIGINATED 125 $107,210 58 $107,443 2 $92,725 APPLICATIONS APPROVED, NOT ACCEPTED 10 $106,897 9 $126,474 1 $143,650 APPLICATIONS DENIED 1 $119,000 1 $102,450 0 $0 APPLICATIONS WITHDRAWN 2 $96,500 1 $102,010 0 $0 FILES CLOSED FOR INCOMPLETENESS 2 $129,500 0 $0 0 $0
Detailed PMIC statistics for the following Tracts:
4751.01
, 4751.02 , 4752.00 , 4753.01 , 4753.03 , 4753.04 , 4754.01 , 4754.02
Most common first names in Bethel Park, PA among deceased individuals Name Count Lived (average)
John 308 74.9 years Mary 294 81.2 years William 221 75.1 years Joseph 192 76.1 years Robert 181 71.5 years James 174 71.7 years Margaret 160 80.7 years Charles 146 74.7 years Helen 137 82.1 years Anna 125 82.6 years
Most common last names in Bethel Park, PA among deceased individuals Last name Count Lived (average)
Smith 76 77.1 years Miller 57 78.3 years Brown 38 74.7 years Campbell 34 77.8 years Williams 24 77.1 years Thomas 22 75.2 years Johnson 21 79.6 years Evans 21 83.5 years Wilson 21 74.1 years Moore 19 77.5 years
Bethel Park compared to Pennsylvania state average:
Unemployed percentage significantly below state average. Black race population percentage significantly below state average. Hispanic race population percentage significantly below state average. Median age above state average. Foreign-born population percentage below state average. Length of stay since moving in above state average. Percentage of population with a bachelor's degree or higher above state average. Bethel Park on our top lists :
#18 on the list of "Top 101 cities where residents moved in more then 10 years ago (10,000+ households)"
#3 on the list of "Top 101 counties with the most Mainline Protestant congregations"
#3 on the list of "Top 101 counties with the most Catholic congregations"
#6 on the list of "Top 101 counties with the most Orthodox congregations"
#8 on the list of "Top 101 counties with the most Mainline Protestant adherents"
#15 on the list of "Top 101 counties with the most Catholic adherents (pop. 50,000+)"
Top Patent Applicants
Robert A. Pyles (12)
Harold Price (10)
Steven J. Szymkiewicz (10)
Anthony Thomas Ricciuti (10)
Harold Edward Price (8)
Harold E. Price (7)
Cagatay Yanar (6)
Brad Robert Leccia (6)
David C. Martin (6)
Michael W. Bertosh (6)
Total of 226 patent applications in 2008-2024.
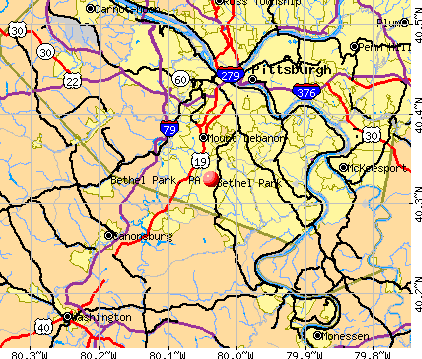


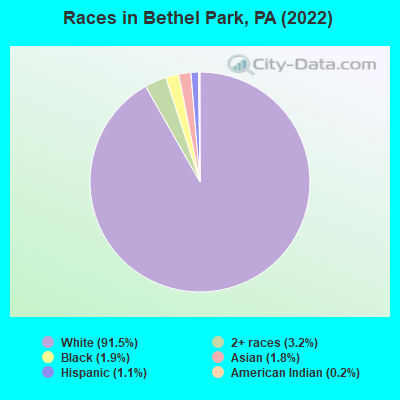
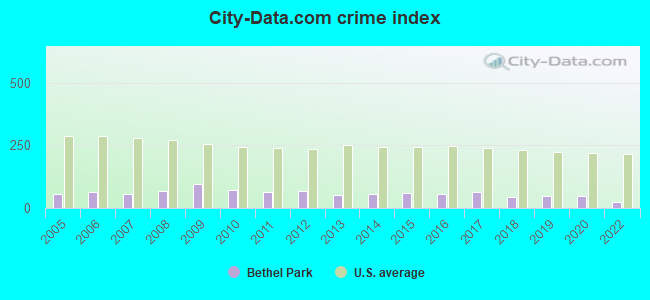
 Recent articles from our blog. Our writers, many of them Ph.D. graduates or candidates, create easy-to-read articles on a wide variety of topics.

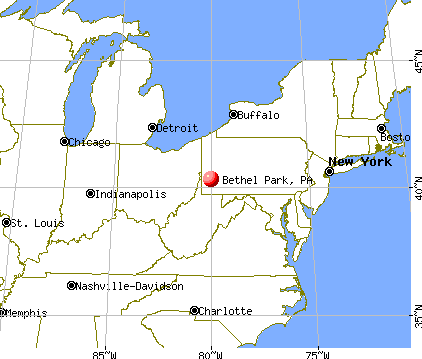
 (8.5 miles
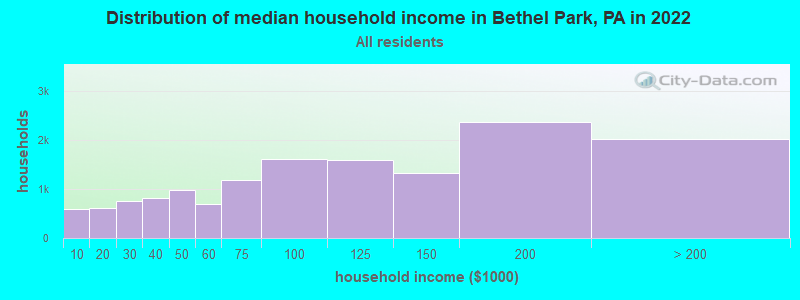
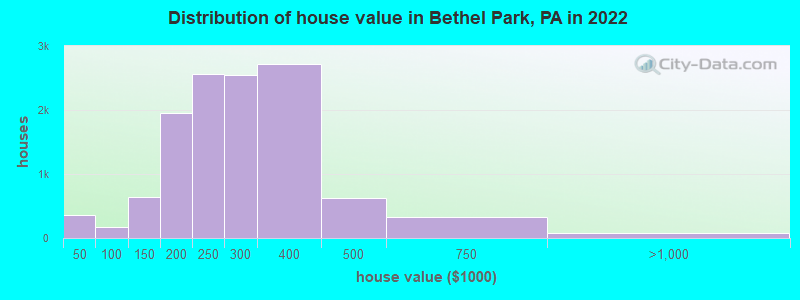

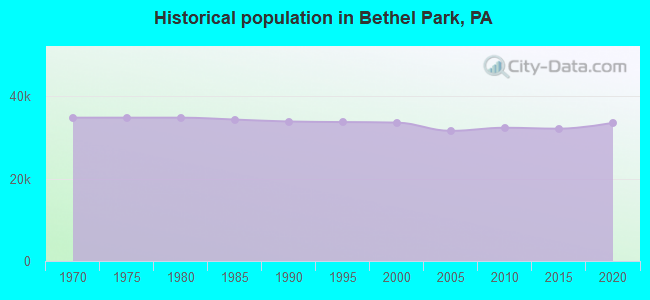
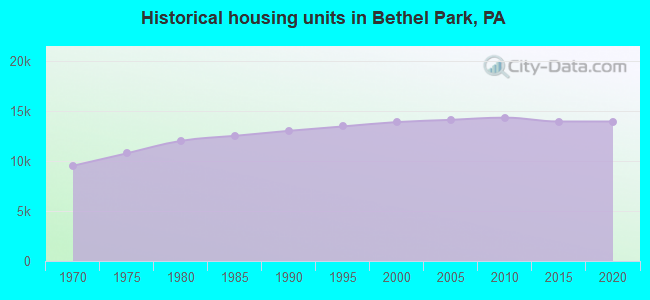
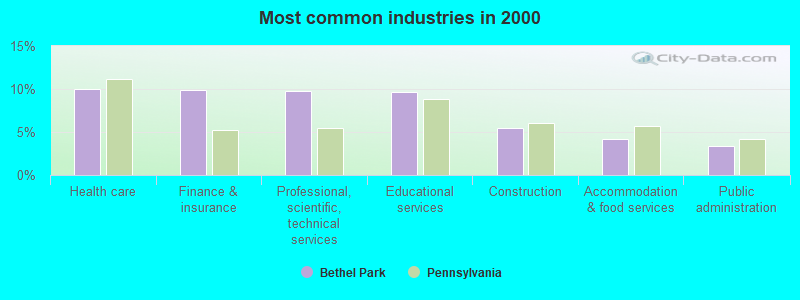
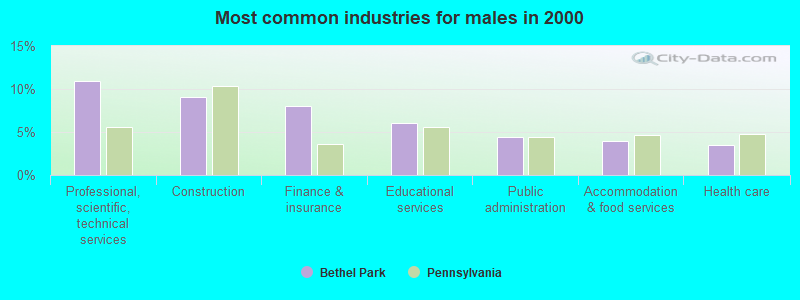
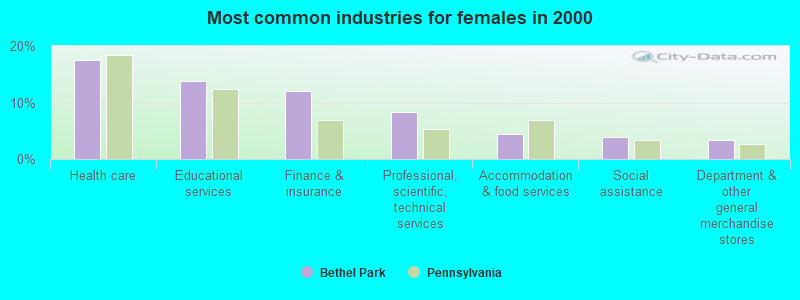
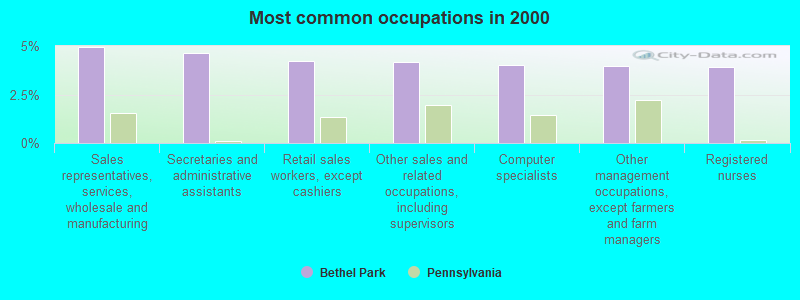
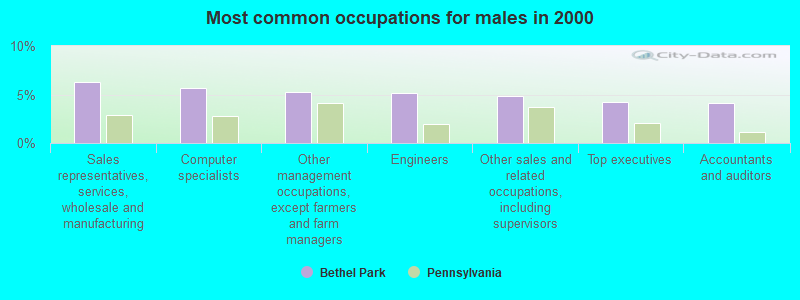
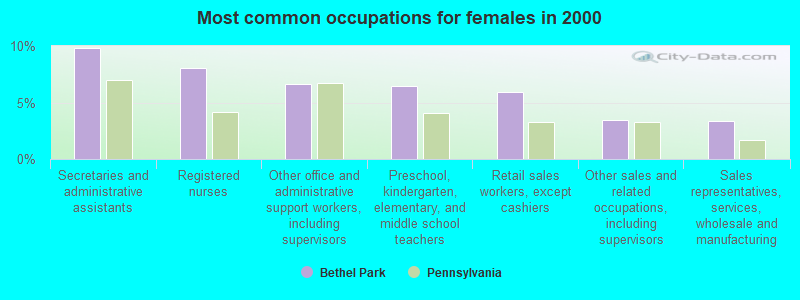


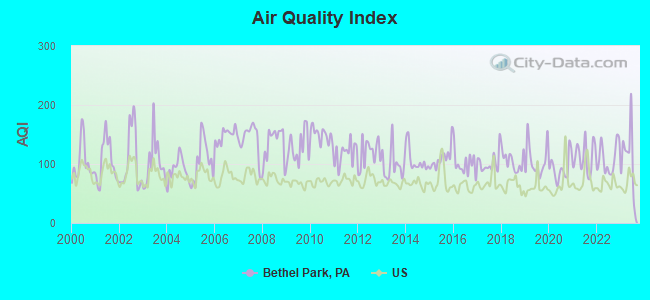
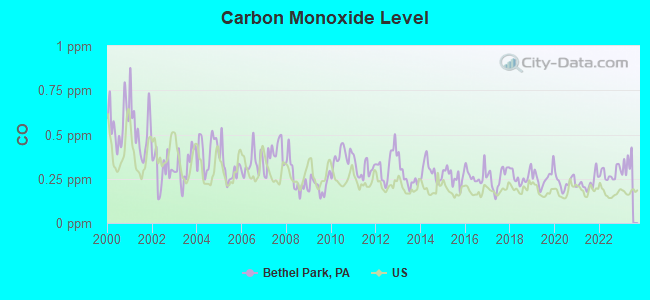
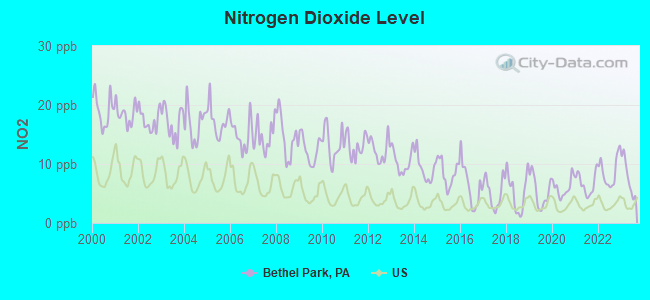
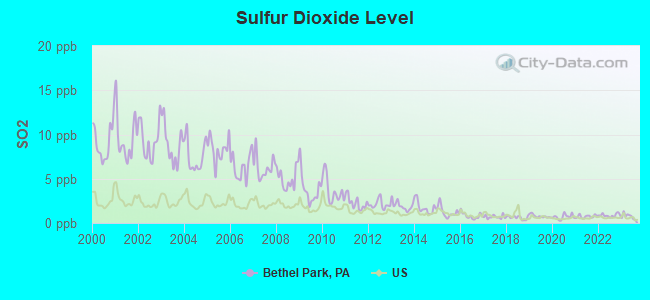
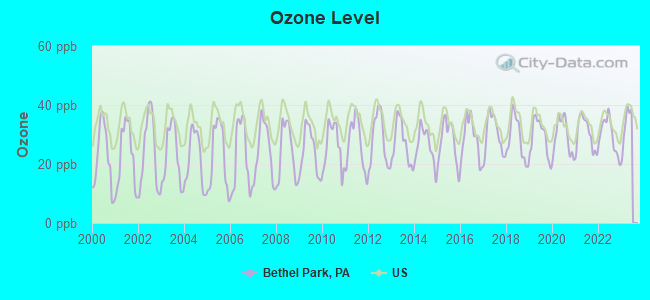
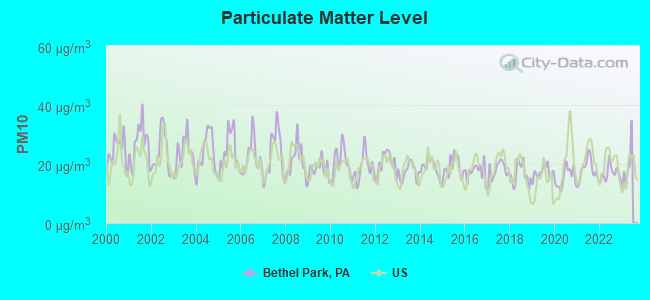
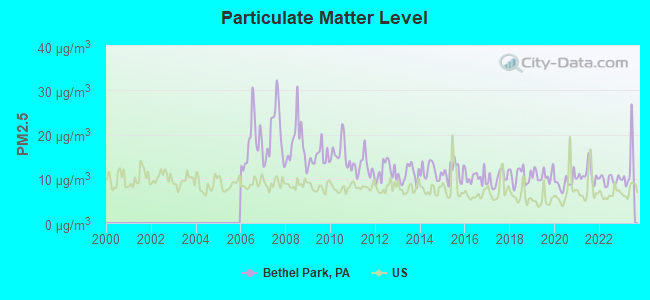
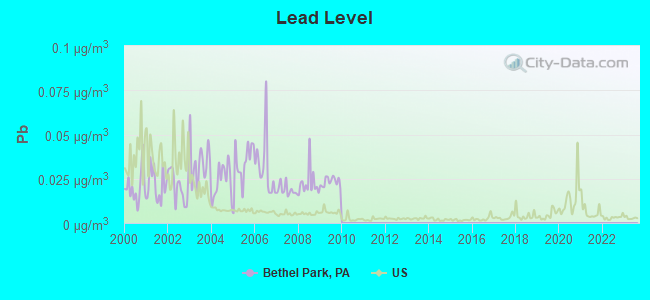

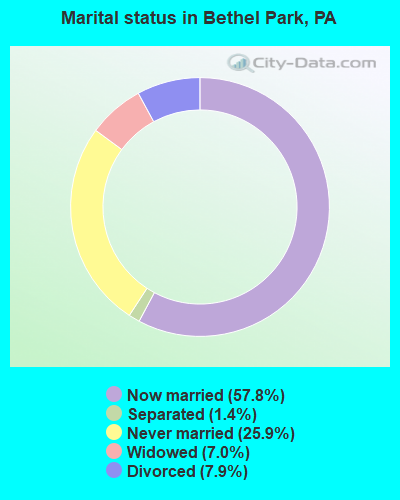
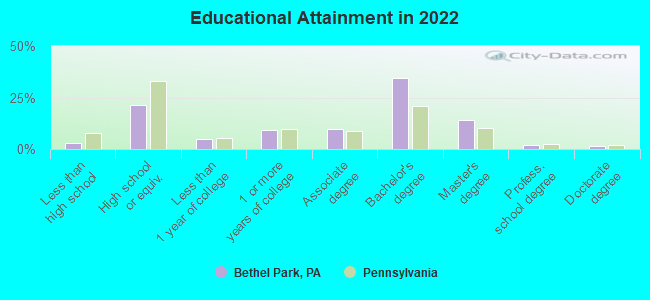
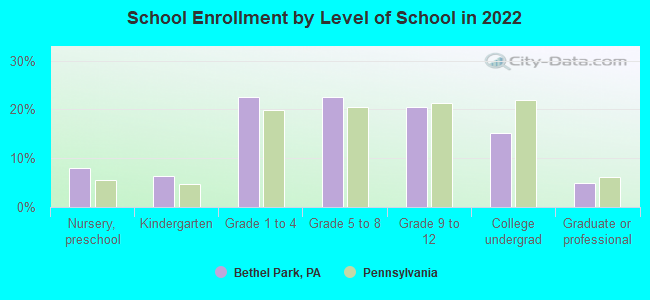
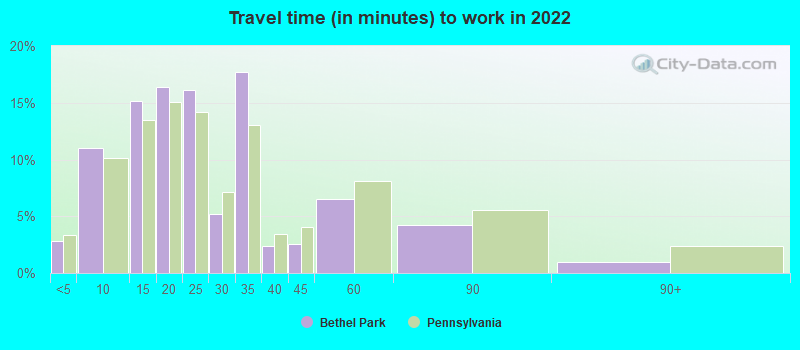
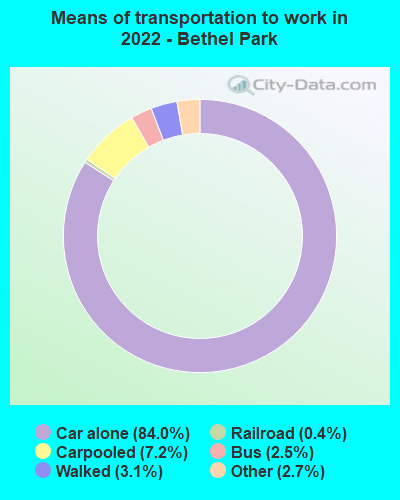
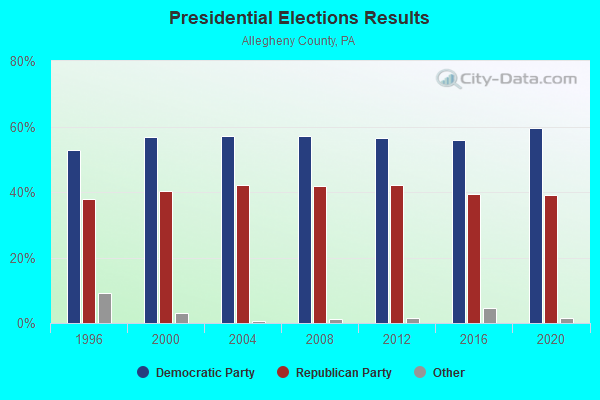
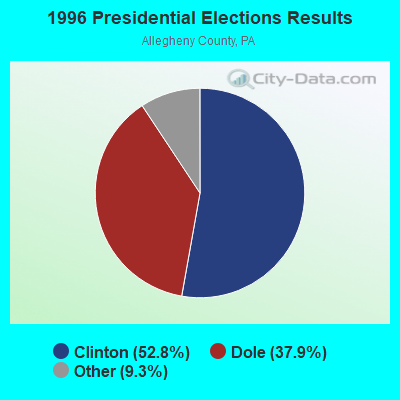
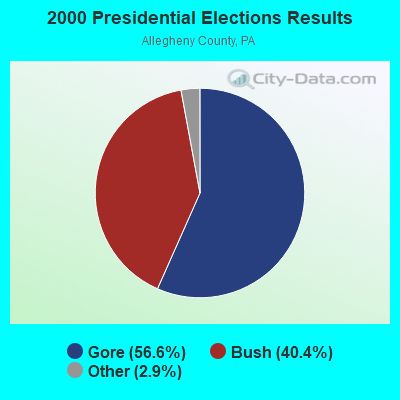
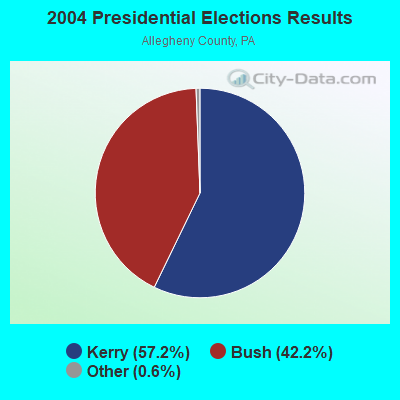

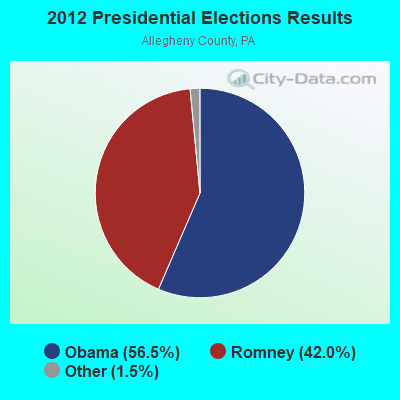
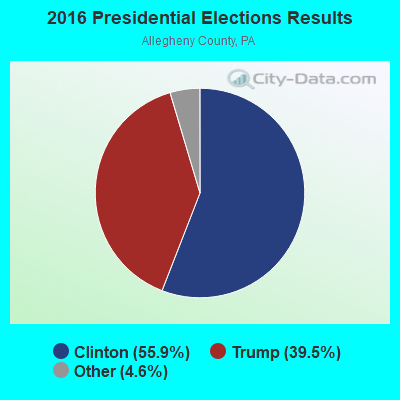
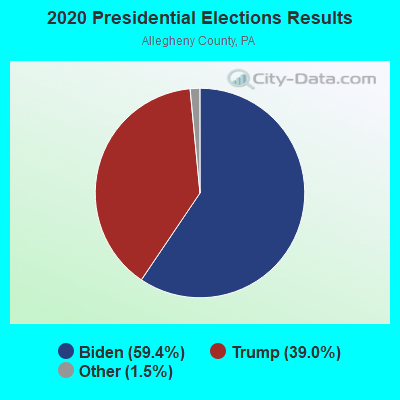
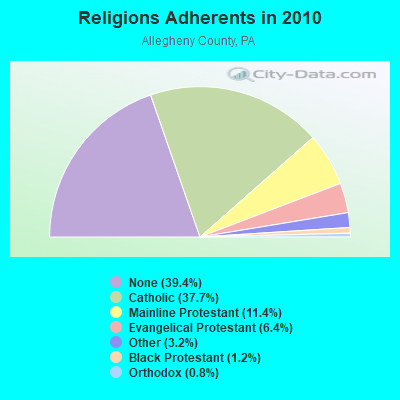
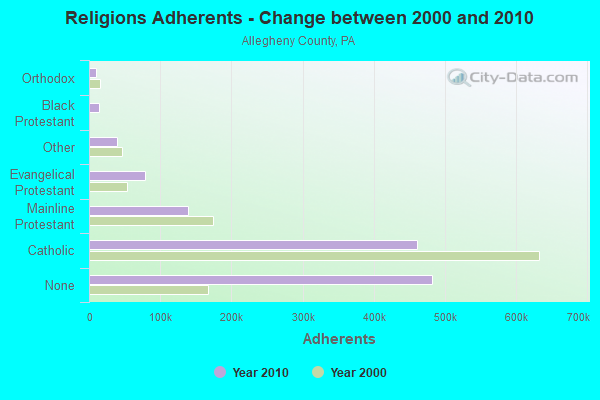
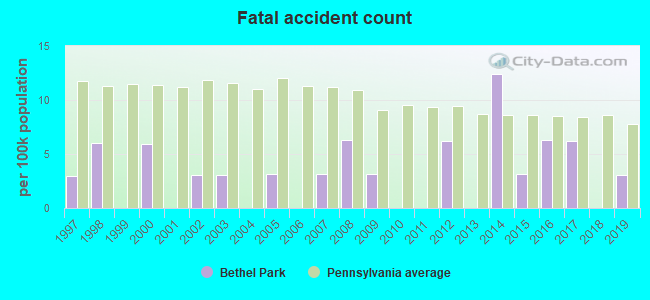
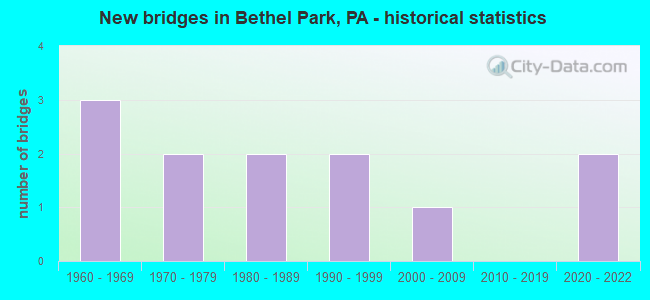
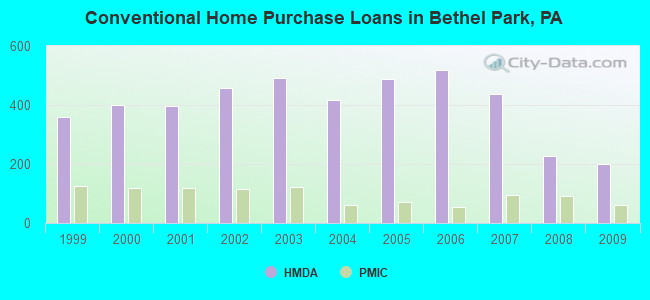
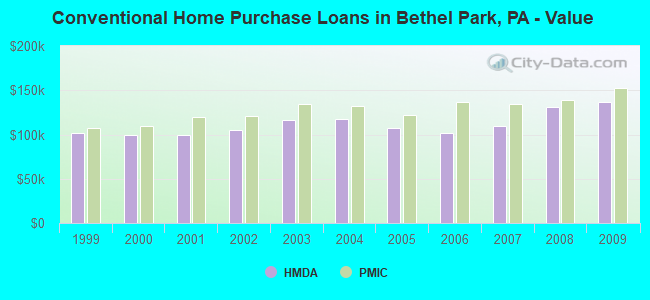
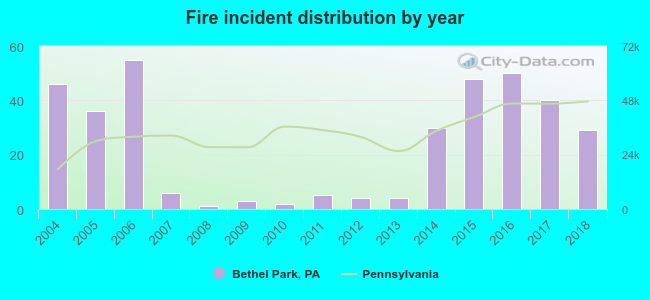 According to the data from the years 2004 - 2018 the average number of fires per year is 24. The highest number of fires - 55 took place in 2006, and the least - 1 in 2008. The data has a declining trend.
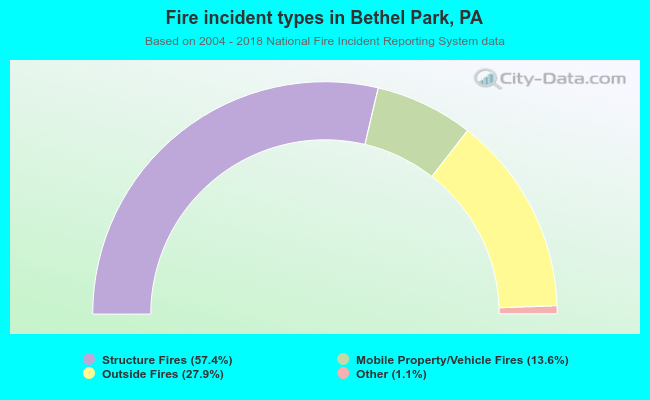 When looking into fire subcategories, the most reports belonged to: Structure Fires (57.4%), and Outside Fires (27.9%).