Silver Spring: Fire Incidents, Maryland (MD)
Where are fire incidents reported in Silver Spring, MD
Something went wrong! Please refresh the page.
| Fire incidents reported | |
|---|---|
| Sreet name | Count |
| NEW HAMPSHIRE AVE | 278 |
| GEORGIA AVE | 254 |
| COLESVILLE RD | 166 |
| UNIVERSITY BLV | 100 |
| OL495 X29 TO X30 HWY | 94 |
| EAST WEST HWY | 82 |
| PINEY BRANCH RD | 72 |
| LOCKWOOD DR | 70 |
| WAYNE AVE | 70 |
| VEIRS MILL RD | 64 |
| CASTLE BLV | 58 |
| OAK LEAF DR | 58 |
| RANDOLPH RD | 52 |
| 16TH ST | 50 |
| BEL PRE RD | 42 |
| OLD COLUMBIA PIK | 42 |
| OL495 X30 TO X31 HWY | 38 |
| COLUMBIA PIK | 36 |
| CONNECTICUT AVE | 36 |
| OL495 X28 TO X29 HWY | 36 |
| BRIGGS CHANEY RD | 32 |
| FOREST GLEN RD | 30 |
| MAPLE AVE | 30 |
| HEWITT AVE | 28 |
| IL495 X33 TO X31 HWY | 28 |
| MT PISGAH RD | 28 |
| SLIGO AVE | 28 |
| IL495 X29 TO X28 HWY | 26 |
| THAYER AVE | 26 |
| FAIRLAND RD | 24 |
| Other | 3,061 |
2004 - 2018 National Fire Incident Reporting System (NFIRS) incidents
- Incident types reported to NFIRS in Silver Spring, MD
- 111,17768.6%Rescue & EMS
- 16,92210.4%Good Intent Call
- 10,6256.6%Hazardous Condition
- 10,4386.4%Service Call
- 7,5374.6%False Alarm
- 5,0393.1%Fire
- 2350.1%Overpressure Rupture
- 1780.1%Special Incident
- Fire incident types reported to NFIRS in Silver Spring, MD
- 2,03840.4%Structure Fires
- 1,74534.6%Outside Fires
- 1,02220.3%Mobile Property/Vehicle Fires
- 2344.6%Other
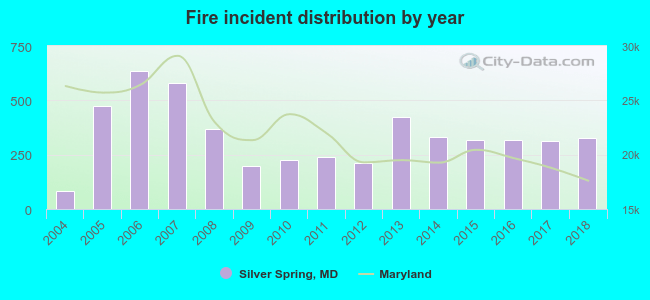 Based on the data from the years 2004 - 2018 the average number of fires per year is 336. The highest number of fires - 636 took place in 2006, and the least - 82 in 2004. The data has a growing trend.
The average number of yearly fire incidents per 10k residents in Silver Spring, MD compared to nearest cities:
(Note: Based on data for the last 3 years, including only cities with population 5,000 and above)
| Silver Spring: | 44.6 |
| Takoma Park: | 14.0 |
| Adelphi: | 1.1 |
| Hyattsville: | 52.8 |
| College Park: | 2.5 |
| Bethesda: | 13.1 |
| Mount Rainier: | 8.9 |
| Colesville: | 14.3 |
| North Bethesda: | 2.2 |
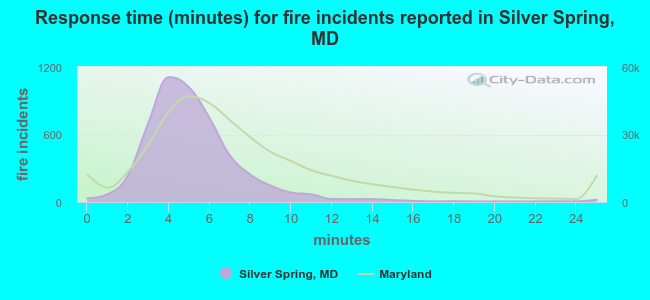 The median response time based on all reported fire incidents is 5 minutes. This is lower compared to the state median value.
The median response time in Silver Spring, MD compared to nearest cities:
(Note: Based on data for all years, including only cities with at least 500 fire incidents)
| Silver Spring: | 5 minutes |
| Takoma Park: | 5 minutes |
| Wheaton: | 5 minutes |
| Chillum: | 6 minutes |
| Hyattsville: | 5 minutes |
| Bethesda: | 5 minutes |
| Beltsville: | 6 minutes |
| Washington: | 4 minutes |
| Bladensburg: | 5 minutes |
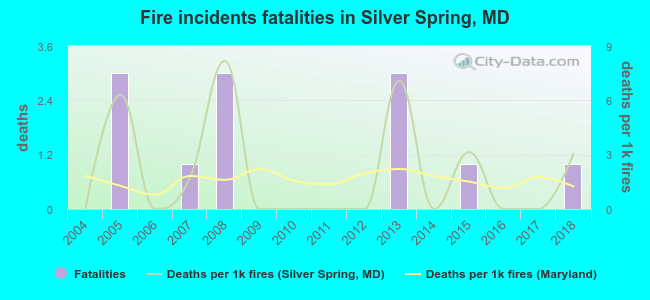 Based on the reports from the years 2004 - 2018 the average number of fire-related fatalities per year is 1. The highest number of reported deaths - 3 took place in 2005, and the lowest - 0 in 2004. The data has an increasing trend.
The average number of deaths per 1,000 fire incidents is 2. This indicator was the highest - 8 in 2008, and the lowest 0 in 2004. The trend for deaths per 1,000 fire incidents is rising. Compared to the Maryland value the number of deaths per 1,000 incidents is higher.
Based on the reports from the years 2004 - 2018 the average number of fire-related fatalities per year is 1. The highest number of reported deaths - 3 took place in 2005, and the lowest - 0 in 2004. The data has an increasing trend.
The average number of deaths per 1,000 fire incidents is 2. This indicator was the highest - 8 in 2008, and the lowest 0 in 2004. The trend for deaths per 1,000 fire incidents is rising. Compared to the Maryland value the number of deaths per 1,000 incidents is higher.Deaths per 1,000 incidents in Silver Spring, MD compared to nearest cities:
(Note: Based on data for all years, including only cities with at least 2,500 fire incidents)
| Silver Spring: | 2.4 |
| Washington: | 1.5 |
| Rockville: | 2.7 |
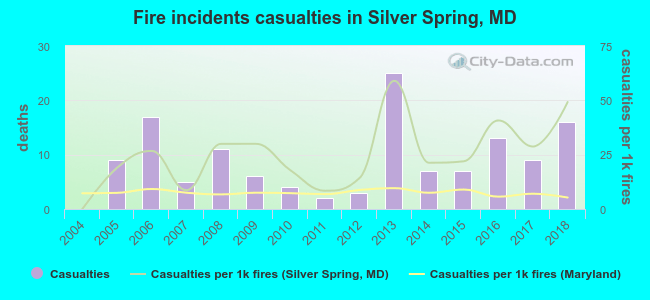 According to the data from the years 2004 - 2018 the average number of fire-related casualties per year is 9. The highest number of reported casualties - 25 took place in 2013, and the lowest - 0 in 2004. The data has an increasing trend.
The average number of casualties per 1,000 fire incidents is 25. This indicator was the highest - 59 in 2013, and the lowest 0 in 2004. The trend for casualties per 1,000 fire incidents is rising. Compared to the state value the number of casualties per 1,000 incidents is much higher.
According to the data from the years 2004 - 2018 the average number of fire-related casualties per year is 9. The highest number of reported casualties - 25 took place in 2013, and the lowest - 0 in 2004. The data has an increasing trend.
The average number of casualties per 1,000 fire incidents is 25. This indicator was the highest - 59 in 2013, and the lowest 0 in 2004. The trend for casualties per 1,000 fire incidents is rising. Compared to the state value the number of casualties per 1,000 incidents is much higher.Casualties per 1,000 incidents in Silver Spring, MD compared to nearest cities:
(Note: Based on data for all years, including only cities with at least 500 fire incidents)
| Silver Spring: | 26.6 |
| Takoma Park: | 18.1 |
| Wheaton: | 22.9 |
| Chillum: | 10.6 |
| Hyattsville: | 2.4 |
| Bethesda: | 15.4 |
| Beltsville: | 10.0 |
| Washington: | 1.1 |
| Bladensburg: | 16.8 |
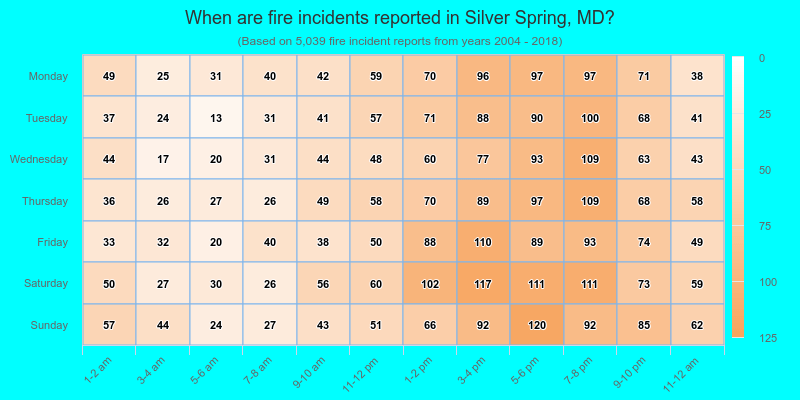
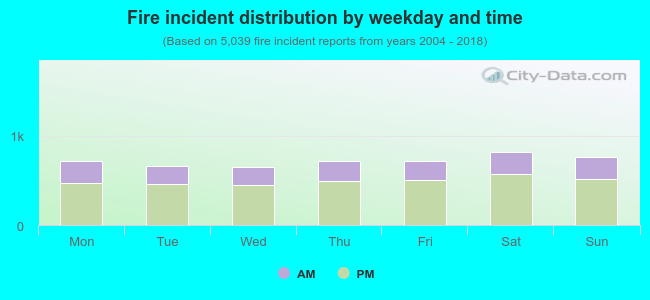 31.4% incidents where reported in the morning and 68.6% in the evening. The most fires (16.3%) took place on Saturday, and the least (12.9%) on Wednesday.
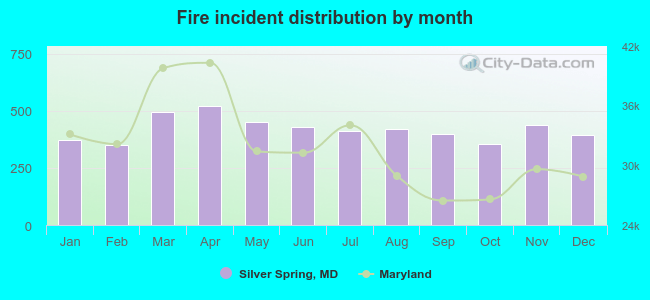 Based on the 5,039 incident reports from years 2004 - 2018 most fires (10.4%) took place during April, and the least (7.0%) in February.
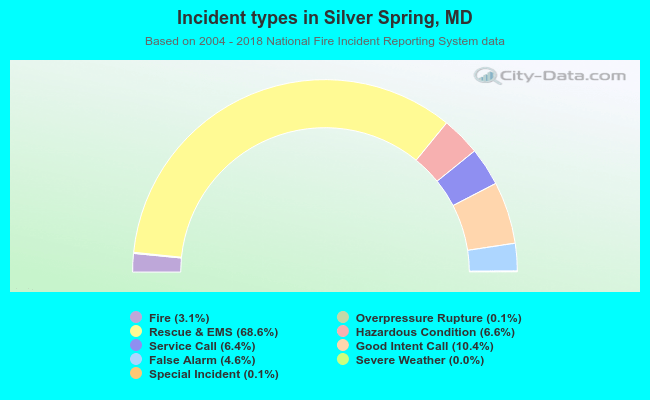 Out of all 162,179 cases reported during the years 2004 - 2018, the most belonged to the categories: Rescue & EMS (68.6%), Good Intent Call (10.4%), and Hazardous Condition (6.6%).
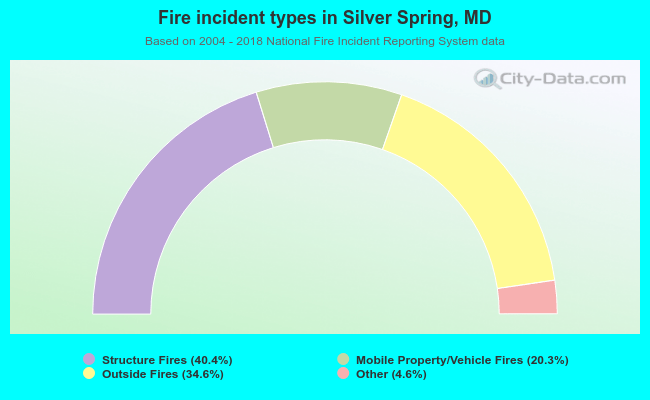 When looking into fire subcategories, the most incidents belonged to: Structure Fires (40.4%), and Outside Fires (34.6%).