Washington: Fire Incidents, District of Columbia (DC)
Where are fire incidents reported in Washington, DC
Something went wrong! Please refresh the page.
| Fire incidents reported | |
|---|---|
| Sreet name | Count |
| 4TH ST | 440 |
| MASSACHUSETTS AVE | 440 |
| CONNECTICUT AVE | 432 |
| 14TH ST | 404 |
| 16TH ST | 356 |
| GEORGIA AVE | 326 |
| BENNING RD | 318 |
| M ST | 318 |
| PENNSYLVANIA AVE | 296 |
| RHODE ISLAND AVE | 286 |
| 7TH ST | 280 |
| K ST | 262 |
| 3RD ST | 260 |
| ALABAMA AVE | 252 |
| MARTIN LUTHER KING JR AVE | 252 |
| 14TH ST NW | 244 |
| 13TH ST | 236 |
| G ST | 230 |
| H ST | 230 |
| NEW JERSEY AVE | 224 |
| 1ST ST | 220 |
| 18TH ST | 216 |
| F ST | 216 |
| 9TH ST | 214 |
| 12TH ST | 212 |
| 6TH ST | 212 |
| MINNESOTA AVE | 206 |
| WISCONSIN AVE | 202 |
| SOUTHERN AVE | 198 |
| I ST | 196 |
| Other | 8,382 |
2004 - 2018 National Fire Incident Reporting System (NFIRS) incidents
- Incident types reported to NFIRS in Washington, DC
- 311,67773.8%Rescue & EMS
- 36,5578.7%False Alarm
- 21,6875.1%Hazardous Condition
- 19,7844.7%Good Intent Call
- 16,5603.9%Fire
- 14,9263.5%Service Call
- 9840.2%Special Incident
- Fire incident types reported to NFIRS in Washington, DC
- 7,77847.0%Structure Fires
- 5,31232.1%Outside Fires
- 2,75216.6%Mobile Property/Vehicle Fires
- 7184.3%Other
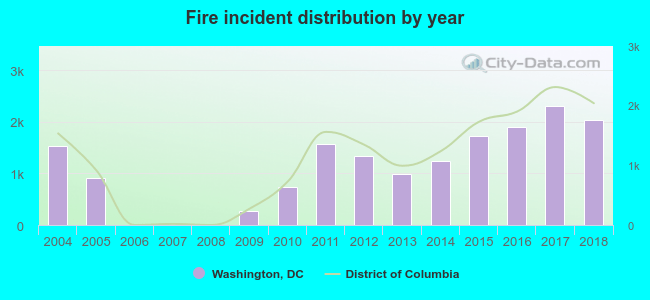 According to the data from the years 2004 - 2018 the average number of fires per year is 1,104. The highest number of reported fire incidents - 2,312 took place in 2017, and the least - 0 in 2006. The data has a rising trend.
The average number of yearly fire incidents per 10k residents in Washington, DC compared to nearest cities:
(Note: Based on data for the last 3 years, including only cities with population 5,000 and above)
| Washington: | 31.6 |
 The median response time based on all reported fire incidents is 4 minutes. This is close to the District of Columbia median value.
The median response time in Washington, DC compared to nearest cities:
(Note: Based on data for all years, including only cities with at least 500 fire incidents)
| Washington: | 4 minutes |
 Based on the reports from the years 2004 - 2018 the average number of fire-related yearly deaths is 2. The highest number of deaths - 6 took place in 2009, and the lowest - 0 in 2006. The data has a dropping trend.
The average number of deaths per 1,000 fire incidents is 2. This indicator was the highest - 22 in 2009, and the lowest 0 in 2006. The trend for fatalities per 1,000 fire incidents is dropping. Compared to the state value the number of fatalities per 1,000 fire incidents is similar.
Based on the reports from the years 2004 - 2018 the average number of fire-related yearly deaths is 2. The highest number of deaths - 6 took place in 2009, and the lowest - 0 in 2006. The data has a dropping trend.
The average number of deaths per 1,000 fire incidents is 2. This indicator was the highest - 22 in 2009, and the lowest 0 in 2006. The trend for fatalities per 1,000 fire incidents is dropping. Compared to the state value the number of fatalities per 1,000 fire incidents is similar.Deaths per 1,000 incidents in Washington, DC compared to nearest cities:
(Note: Based on data for all years, including only cities with at least 2,500 fire incidents)
| Washington: | 1.5 |
 According to the data from the years 2004 - 2018 the average number of fire-related yearly casualties is 1. The highest number of injuries - 5 took place in 2005, and the lowest - 0 in 2006. The data has a declining trend.
The average number of injuries per 1,000 fires is 1. This indicator was the highest - 6 in 2005, and the lowest 0 in 2006. The trend for casualties per 1,000 fires is dropping. Compared to the state value the number of injuries per 1,000 incidents is similar.
According to the data from the years 2004 - 2018 the average number of fire-related yearly casualties is 1. The highest number of injuries - 5 took place in 2005, and the lowest - 0 in 2006. The data has a declining trend.
The average number of injuries per 1,000 fires is 1. This indicator was the highest - 6 in 2005, and the lowest 0 in 2006. The trend for casualties per 1,000 fires is dropping. Compared to the state value the number of injuries per 1,000 incidents is similar.Casualties per 1,000 incidents in Washington, DC compared to nearest cities:
(Note: Based on data for all years, including only cities with at least 500 fire incidents)
| Washington: | 1.1 |
 34.7% incidents where reported in the morning and 65.3% in the evening. The most fires (15.8%) took place on Saturday, and the least (13.4%) on Thursday.
 According to the 16,560 incident reports from years 2004 - 2018 most fires (11.5%) took place during July, and the least (5.3%) in April.
 Out of all 422,467 cases reported during the years 2004 - 2018, the most belonged to the categories: Rescue & EMS (73.8%), False Alarm (8.7%), and Hazardous Condition (5.1%).
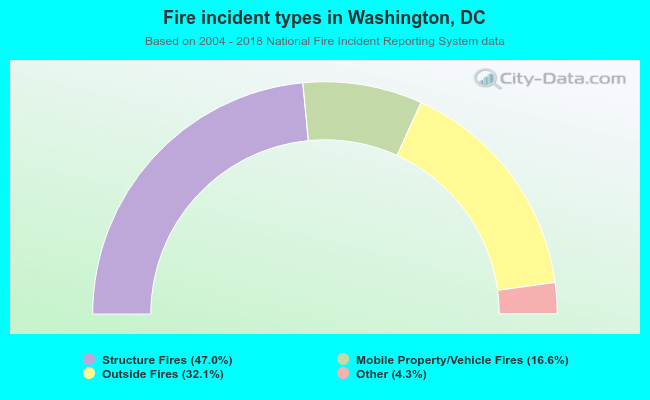 When looking into fire subcategories, the most reports belonged to: Structure Fires (47.0%), and Outside Fires (32.1%).