North Charleston: Fire Incidents, South Carolina (SC)
Where are fire incidents reported in North Charleston, SC
Something went wrong! Please refresh the page.
| Fire incidents reported | |
|---|---|
| Sreet name | Count |
| DORCHESTER RD | 1,022 |
| RIVERS AV | 554 |
| ASHLEY PHOSPHATE RD | 458 |
| RIVERS AVE | 396 |
| RIVERS | 362 |
| INTERSTATE 26 | 270 |
| REMOUNT RD | 238 |
| FAIRWIND DR | 182 |
| NORTHWOODS BLVD | 170 |
| HIGHWAY 78 | 154 |
| STALL RD | 152 |
| MEETING STREET RD | 146 |
| RANGER DR | 138 |
| MONTAGUE AV | 134 |
| MIDLAND PARK RD | 132 |
| PATRIOT BLVD | 126 |
| OTRANTO RD | 122 |
| DORCHESTER MANOR BLVD | 120 |
| INTERNATIONAL BLVD | 108 |
| EVANGELINE DR | 96 |
| GREENRIDGE RD | 94 |
| HUNTERS RIDGE LN | 94 |
| SUMNER AV | 94 |
| SURREY DR | 94 |
| AZALEA DR | 90 |
| SUMNER AVE | 90 |
| GRAYSON ST | 86 |
| DUNLAP ST | 82 |
| MONTAGUE AVE | 82 |
| STRATTON DR | 82 |
| Other | 5,668 |
2002 - 2018 National Fire Incident Reporting System (NFIRS) incidents
- Incident types reported to NFIRS in North Charleston, SC
- 52,52250.5%Rescue & EMS
- 18,94518.2%Good Intent Call
- 11,63611.2%Fire
- 9,7279.3%False Alarm
- 5,4535.2%Hazardous Condition
- 5,2645.1%Service Call
- 2510.2%Overpressure Rupture
- 1770.2%Special Incident
- Fire incident types reported to NFIRS in North Charleston, SC
- 4,66140.1%Structure Fires
- 4,23036.4%Outside Fires
- 2,43620.9%Mobile Property/Vehicle Fires
- 3092.7%Other
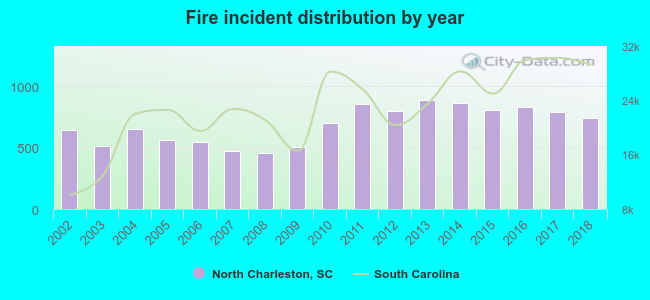 According to the data from the years 2002 - 2018 the average number of fires per year is 684. The highest number of reported fires - 886 took place in 2013, and the least - 460 in 2008. The data has a rising trend.
The average number of yearly fire incidents per 10k residents in North Charleston, SC compared to nearest cities:
(Note: Based on data for the last 3 years, including only cities with population 5,000 and above)
| North Charleston: | 73.9 |
| Hanahan: | 29.4 |
| Charleston: | 56.7 |
| Goose Creek: | 39.1 |
| Ladson: | 102.5 |
| Wando: | 18.9 |
| Mount Pleasant: | 2.8 |
| James Island: | 12.7 |
| Summerville: | 100.5 |
 The median response time based on all reported fire incidents is 5 minutes. This is lower than the South Carolina median value.
The median response time in North Charleston, SC compared to nearest cities:
(Note: Based on data for all years, including only cities with at least 500 fire incidents)
| North Charleston: | 5 minutes |
| Charleston: | 4 minutes |
| Goose Creek: | 5 minutes |
| Ladson: | 5 minutes |
| Mount Pleasant: | 6 minutes |
| Summerville: | 6 minutes |
| Johns Island: | 7 minutes |
| Hollywood: | 5 minutes |
| Moncks Corner: | 5 minutes |
 Based on the reports from the years 2002 - 2018 the average number of fire-related yearly deaths is 2. The highest number of deaths - 4 took place in 2005, and the lowest - 0 in 2002. The data has a rising trend.
The average number of deaths per 1,000 fire incidents is 3. This indicator was the highest - 7 in 2006, and the lowest 0 in 2002. The trend for deaths per 1,000 fire incidents is growing. Compared to the state value the number of fatalities per 1,000 fire incidents is about the same.
Based on the reports from the years 2002 - 2018 the average number of fire-related yearly deaths is 2. The highest number of deaths - 4 took place in 2005, and the lowest - 0 in 2002. The data has a rising trend.
The average number of deaths per 1,000 fire incidents is 3. This indicator was the highest - 7 in 2006, and the lowest 0 in 2002. The trend for deaths per 1,000 fire incidents is growing. Compared to the state value the number of fatalities per 1,000 fire incidents is about the same.Deaths per 1,000 incidents in North Charleston, SC compared to nearest cities:
(Note: Based on data for all years, including only cities with at least 2,500 fire incidents)
| North Charleston: | 2.7 |
| Charleston: | 1.3 |
| Summerville: | 1.1 |
| Moncks Corner: | 2.0 |
| Walterboro: | 2.1 |
| Manning: | 0.0 |
 Based on the reports from the years 2002 - 2018 the average number of fire-related yearly casualties is 17. The highest number of injuries - 39 took place in 2014, and the lowest - 4 in 2002. The data has an increasing trend.
The average number of casualties per 1,000 fires is 24. This indicator was the highest - 49 in 2017, and the lowest 6 in 2002. The trend for injuries per 1,000 incidents is growing. Compared to the state value the number of injuries per 1,000 fire incidents is much higher.
Based on the reports from the years 2002 - 2018 the average number of fire-related yearly casualties is 17. The highest number of injuries - 39 took place in 2014, and the lowest - 4 in 2002. The data has an increasing trend.
The average number of casualties per 1,000 fires is 24. This indicator was the highest - 49 in 2017, and the lowest 6 in 2002. The trend for injuries per 1,000 incidents is growing. Compared to the state value the number of injuries per 1,000 fire incidents is much higher.Casualties per 1,000 incidents in North Charleston, SC compared to nearest cities:
(Note: Based on data for all years, including only cities with at least 500 fire incidents)
| North Charleston: | 25.2 |
| Charleston: | 7.7 |
| Goose Creek: | 13.3 |
| Ladson: | 2.1 |
| Mount Pleasant: | 18.4 |
| Summerville: | 7.6 |
| Johns Island: | 9.4 |
| Hollywood: | 0.0 |
| Moncks Corner: | 3.3 |
 29.8% incidents where reported in the morning and 70.2% in the evening. The most fires (15.6%) took place on Saturday, and the least (13.6%) on Tuesday.
 Based on the 11,636 fire incidents from years 2002 - 2018 most fires (10.6%) took place during January, and the least (6.6%) in September.
 Out of all 104,067 cases reported during the years 2002 - 2018, the most belonged to the categories: Rescue & EMS (50.5%), Good Intent Call (18.2%), and Fire (11.2%).
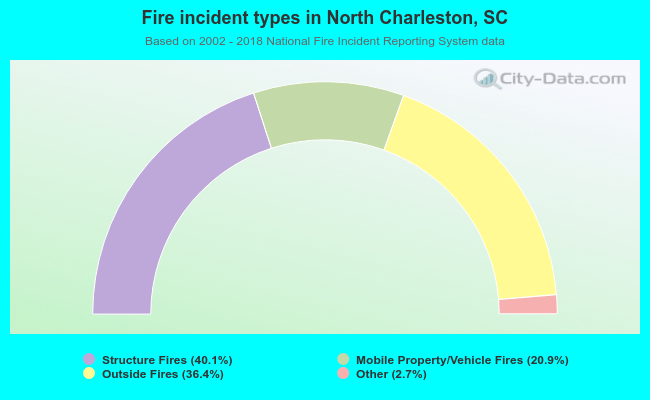 When looking into fire subcategories, the most incidents belonged to: Structure Fires (40.1%), and Outside Fires (36.4%).