Goose Creek: Fire Incidents, South Carolina (SC)
Where are fire incidents reported in Goose Creek, SC
Something went wrong! Please refresh the page.
| Fire incidents reported | |
|---|---|
| Sreet name | Count |
| RED BANK RD | 192 |
| HARBOUR LAKE DR | 124 |
| ST JAMES AVE | 112 |
| GOOSE CREEK BLVD | 92 |
| OLD BACK RIVER RD | 76 |
| ST. JAMES AVE | 76 |
| HOWE HALL RD | 62 |
| STEPHANIE DR | 60 |
| PINE SHADOW DR | 58 |
| CRANFORD RD | 48 |
| GILES DR | 48 |
| HALLMARK DR | 48 |
| CROWFIELD BLVD | 44 |
| AMY DR | 42 |
| WESTVIEW BLVD | 36 |
| GENEVIA RD | 34 |
| MARY SCOTT DR | 34 |
| 52 HWY | 32 |
| BRANCHWOOD DR | 32 |
| CLARINE DR | 32 |
| LIBERTY HALL RD | 32 |
| FARM RD | 30 |
| JEAN WELLS DR | 30 |
| OAKSIDE DR | 30 |
| PINEVIEW DR | 30 |
| JUDY DR | 28 |
| ADDISON DR | 26 |
| PANDORA DR | 26 |
| RUTT LN | 26 |
| WEEKS AVE | 26 |
| Other | 540 |
2003 - 2018 National Fire Incident Reporting System (NFIRS) incidents
- Incident types reported to NFIRS in Goose Creek, SC
- 10,55360.2%Rescue & EMS
- 2,10612.0%Fire
- 1,7069.7%Good Intent Call
- 1,4598.3%Service Call
- 8775.0%False Alarm
- 7574.3%Hazardous Condition
- 360.2%Severe Weather
- 180.1%Overpressure Rupture
- Fire incident types reported to NFIRS in Goose Creek, SC
- 90543.0%Outside Fires
- 81638.7%Structure Fires
- 32215.3%Mobile Property/Vehicle Fires
- 633.0%Other
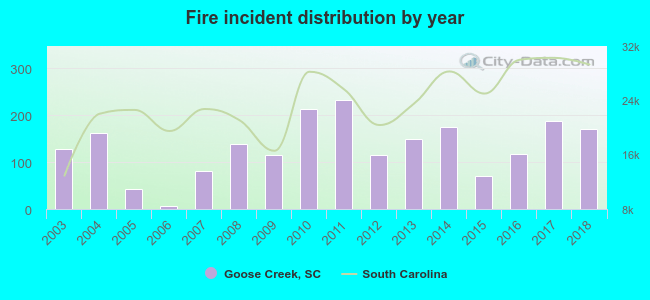 Based on the data from the years 2003 - 2018 the average number of fire incidents per year is 132. The highest number of fires - 232 took place in 2011, and the least - 6 in 2006. The data has a rising trend.
The average number of yearly fire incidents per 10k residents in Goose Creek, SC compared to nearest cities:
(Note: Based on data for the last 3 years, including only cities with population 5,000 and above)
| Goose Creek: | 39.1 |
| Ladson: | 102.5 |
| Hanahan: | 29.4 |
| North Charleston: | 73.9 |
| Summerville: | 100.5 |
| Wando: | 18.9 |
| Moncks Corner: | 313.6 |
| Charleston: | 56.7 |
| Mount Pleasant: | 2.8 |
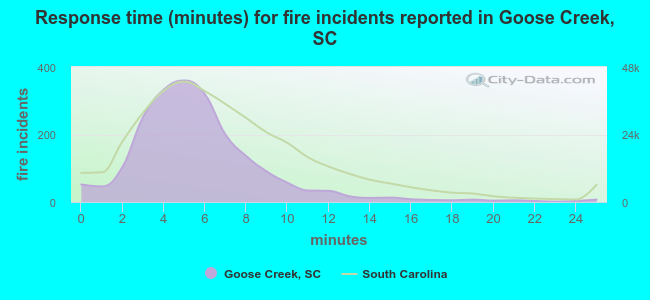 The median response time based on all reported fire incidents is 5 minutes. This is lower than the state median value.
The median response time in Goose Creek, SC compared to nearest cities:
(Note: Based on data for all years, including only cities with at least 500 fire incidents)
| Goose Creek: | 5 minutes |
| Ladson: | 5 minutes |
| North Charleston: | 5 minutes |
| Summerville: | 6 minutes |
| Moncks Corner: | 5 minutes |
| Charleston: | 4 minutes |
| Mount Pleasant: | 6 minutes |
| Ridgeville: | 9 minutes |
| Johns Island: | 7 minutes |
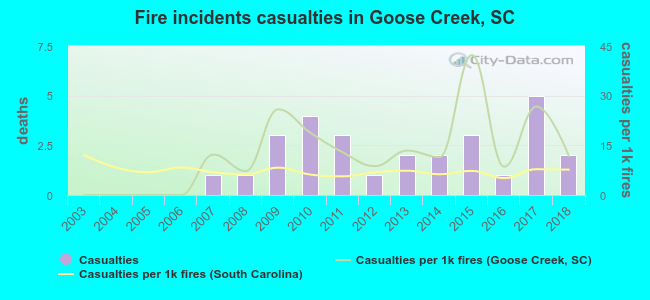 According to the reports from the years 2003 - 2018 the average number of fire-related yearly casualties is 2. The highest number of reported injuries - 5 took place in 2017, and the lowest - 0 in 2003. The data has a growing trend.
The average number of casualties per 1,000 fire incidents is 12. This indicator was the highest - 42 in 2015, and the lowest 0 in 2003. The trend for injuries per 1,000 fires is rising. Compared to the state value the number of injuries per 1,000 fire incidents is higher.
According to the reports from the years 2003 - 2018 the average number of fire-related yearly casualties is 2. The highest number of reported injuries - 5 took place in 2017, and the lowest - 0 in 2003. The data has a growing trend.
The average number of casualties per 1,000 fire incidents is 12. This indicator was the highest - 42 in 2015, and the lowest 0 in 2003. The trend for injuries per 1,000 fires is rising. Compared to the state value the number of injuries per 1,000 fire incidents is higher.Casualties per 1,000 incidents in Goose Creek, SC compared to nearest cities:
(Note: Based on data for all years, including only cities with at least 500 fire incidents)
| Goose Creek: | 13.3 |
| Ladson: | 2.1 |
| North Charleston: | 25.2 |
| Summerville: | 7.6 |
| Moncks Corner: | 3.3 |
| Charleston: | 7.7 |
| Mount Pleasant: | 18.4 |
| Ridgeville: | 0.0 |
| Johns Island: | 9.4 |
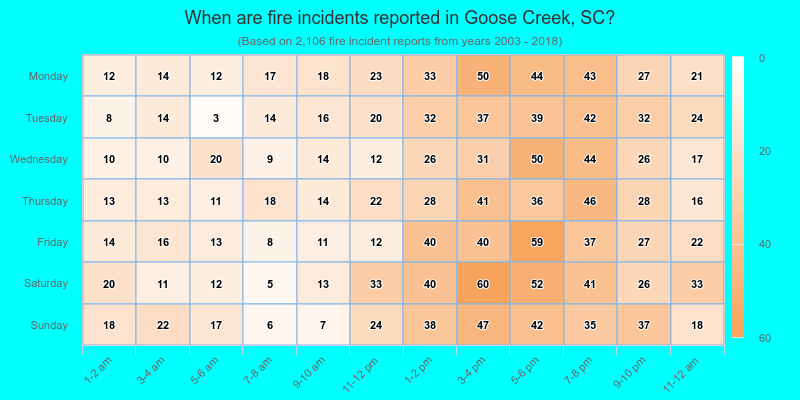
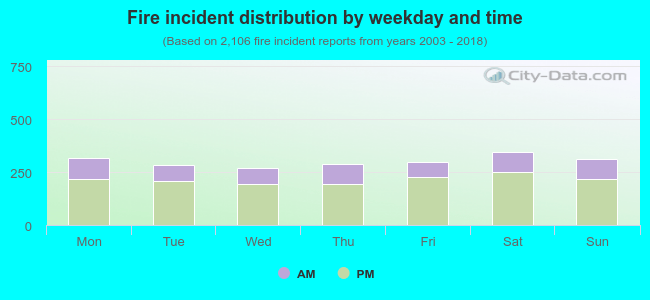 28.4% incidents where reported in the morning and 71.6% in the evening. The most fires (16.4%) took place on Saturday, and the least (12.8%) on Wednesday.
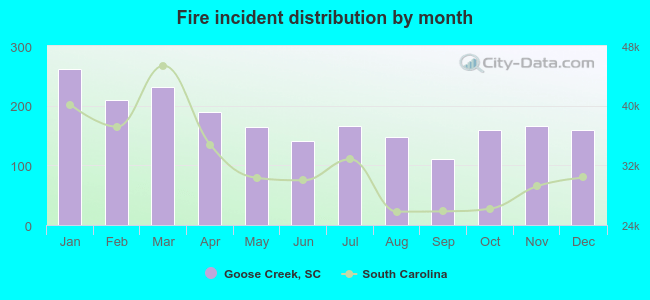 Based on the 2,106 fires from years 2003 - 2018 most fires (12.4%) took place during January, and the least (5.2%) in September.
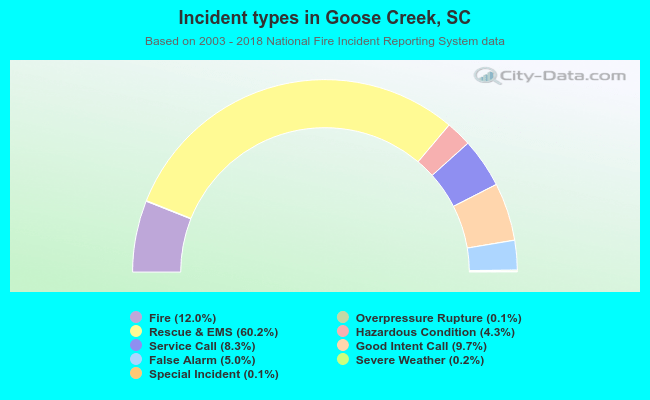 Out of all 17,525 cases reported during the years 2003 - 2018, the most belonged to the categories: Rescue & EMS (60.2%), Fire (12.0%), and Good Intent Call (9.7%).
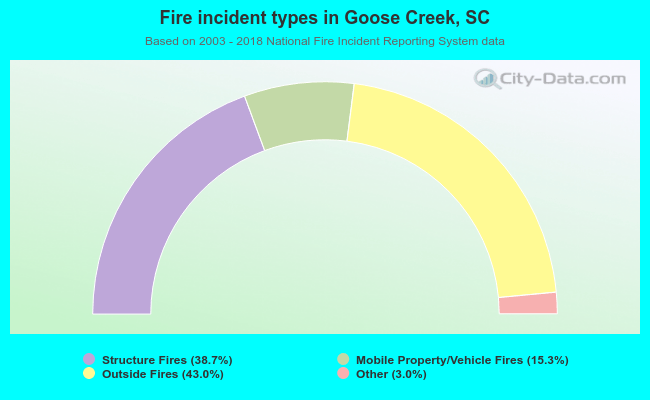 When looking into fire subcategories, the most incidents belonged to: Outside Fires (43.0%), and Structure Fires (38.7%).