Mesquite: Fire Incidents, Texas (TX)
Where are fire incidents reported in Mesquite, TX
Something went wrong! Please refresh the page.
| Fire incidents reported | |
|---|---|
| Sreet name | Count |
| HWY 80 | 532 |
| GALLOWAY AVE | 522 |
| TOWN EAST BLVD | 370 |
| GUS THOMASSON RD | 350 |
| OATES DR | 332 |
| HILLCREST ST | 298 |
| SAMUELL BLVD | 222 |
| GROSS RD | 212 |
| FRANKLIN DR | 196 |
| TOWNE CROSSING BLVD | 190 |
| CARTWRIGHT RD | 178 |
| MILITARY PKY | 166 |
| IH635 | 160 |
| AMERICANA LN | 144 |
| PINEHURST LN | 144 |
| BELT LINE RD | 138 |
| EAST MEADOWS BLVD | 132 |
| HIGHLAND VILLAGE DR | 132 |
| TRADEWIND DR | 132 |
| CASCADE ST | 118 |
| PEACHTREE RD | 118 |
| SAM HOUSTON RD | 110 |
| BIG TOWN BLVD | 108 |
| LAWSON RD | 106 |
| JOHN WEST RD | 100 |
| MOTLEY DR | 98 |
| HICKORY TREE RD | 92 |
| NORTHWEST DR | 90 |
| SCYENE RD | 88 |
| PIONEER RD | 84 |
| Other | 2,773 |
2002 - 2018 National Fire Incident Reporting System (NFIRS) incidents
- Incident types reported to NFIRS in Mesquite, TX
- 71,95066.2%Rescue & EMS
- 9,1408.4%Hazardous Condition
- 8,4357.8%Fire
- 7,7117.1%False Alarm
- 6,1545.7%Good Intent Call
- 5,1034.7%Service Call
- Fire incident types reported to NFIRS in Mesquite, TX
- 3,10636.8%Structure Fires
- 3,08836.6%Outside Fires
- 1,90322.6%Mobile Property/Vehicle Fires
- 3384.0%Other
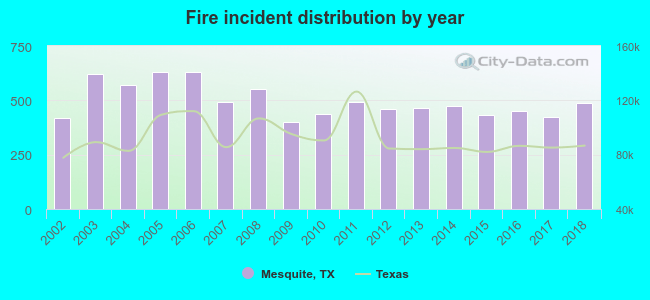 According to the data from the years 2002 - 2018 the average number of fire incidents per year is 496. The highest number of reported fires - 630 took place in 2005, and the least - 402 in 2009. The data has an increasing trend.
The average number of yearly fire incidents per 10k residents in Mesquite, TX compared to nearest cities:
(Note: Based on data for the last 3 years, including only cities with population 5,000 and above)
| Mesquite: | 31.4 |
| Sunnyvale: | 56.1 |
| Balch Springs: | 39.0 |
| Forney: | 71.1 |
| Garland: | 25.0 |
| Heath: | 31.3 |
| Rowlett: | 17.9 |
| Seagoville: | 51.3 |
| Dallas: | 16.3 |
 The median response time based on all reported fire incidents is 5 minutes. This is lower than the Texas median value.
The median response time in Mesquite, TX compared to nearest cities:
(Note: Based on data for all years, including only cities with at least 500 fire incidents)
| Mesquite: | 5 minutes |
| Balch Springs: | 5 minutes |
| Forney: | 6 minutes |
| Garland: | 5 minutes |
| Rowlett: | 6 minutes |
| Seagoville: | 5 minutes |
| Dallas: | 4 minutes |
| Hutchins: | 6 minutes |
| University Park: | 5 minutes |
 Based on the data from the years 2002 - 2018 the average number of fire-related yearly deaths is 0. The highest number of reported deaths - 2 took place in 2002, and the lowest - 0 in 2005. The data has a decreasing trend.
The average number of deaths per 1,000 fires is 1. This indicator was the highest - 5 in 2002, and the lowest 0 in 2005. The trend for fatalities per 1,000 fire incidents is dropping. Compared to the state value the number of deaths per 1,000 fire incidents is much lower.
Based on the data from the years 2002 - 2018 the average number of fire-related yearly deaths is 0. The highest number of reported deaths - 2 took place in 2002, and the lowest - 0 in 2005. The data has a decreasing trend.
The average number of deaths per 1,000 fires is 1. This indicator was the highest - 5 in 2002, and the lowest 0 in 2005. The trend for fatalities per 1,000 fire incidents is dropping. Compared to the state value the number of deaths per 1,000 fire incidents is much lower.Deaths per 1,000 incidents in Mesquite, TX compared to nearest cities:
(Note: Based on data for all years, including only cities with at least 2,500 fire incidents)
| Mesquite: | 0.8 |
| Garland: | 2.2 |
| Dallas: | 1.5 |
| Richardson: | 1.5 |
| Lancaster: | 1.9 |
| DeSoto: | 0.6 |
| Terrell: | 0.0 |
| Duncanville: | 0.8 |
| Plano: | 3.0 |
 According to the data from the years 2002 - 2018 the average number of fire-related yearly casualties is 6. The highest number of reported injuries - 20 took place in 2005, and the lowest - 1 in 2009. The data has a constant trend.
The average number of injuries per 1,000 fire incidents is 11. This indicator was the highest - 32 in 2005, and the lowest 2 in 2009. The trend for casualties per 1,000 incidents is decreasing. Compared to the Texas value the number of casualties per 1,000 fires is higher.
According to the data from the years 2002 - 2018 the average number of fire-related yearly casualties is 6. The highest number of reported injuries - 20 took place in 2005, and the lowest - 1 in 2009. The data has a constant trend.
The average number of injuries per 1,000 fire incidents is 11. This indicator was the highest - 32 in 2005, and the lowest 2 in 2009. The trend for casualties per 1,000 incidents is decreasing. Compared to the Texas value the number of casualties per 1,000 fires is higher.Casualties per 1,000 incidents in Mesquite, TX compared to nearest cities:
(Note: Based on data for all years, including only cities with at least 500 fire incidents)
| Mesquite: | 12.0 |
| Balch Springs: | 4.5 |
| Forney: | 0.6 |
| Garland: | 5.4 |
| Rowlett: | 14.3 |
| Seagoville: | 10.3 |
| Dallas: | 5.8 |
| Hutchins: | 9.0 |
| University Park: | 5.9 |
 28.2% incidents where reported in the morning and 71.8% in the evening. The most fires (15.3%) took place on Sunday, and the least (13.5%) on Wednesday.
 Based on the 8,435 incident reports from years 2002 - 2018 most fires (10.7%) took place during July, and the least (7.2%) in September.
 Out of all 108,624 cases reported during the years 2002 - 2018, the most belonged to the categories: Rescue & EMS (66.2%), Hazardous Condition (8.4%), and Fire (7.8%).
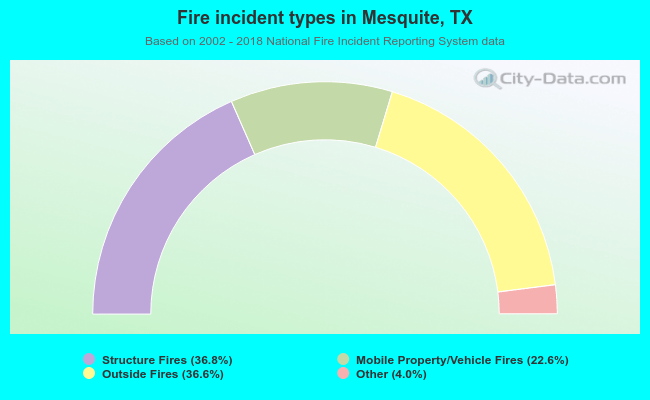 When looking into fire subcategories, the most reports belonged to: Structure Fires (36.8%), and Outside Fires (36.6%).