Garland: Fire Incidents, Texas (TX)
Where are fire incidents reported in Garland, TX
Something went wrong! Please refresh the page.
| Fire incidents reported | |
|---|---|
| Sreet name | Count |
| WALNUT ST | 576 |
| JUPITER RD | 380 |
| CENTERVILLE RD | 374 |
| BUCKINGHAM RD | 366 |
| SHILOH RD | 352 |
| DUCK CREEK DR | 332 |
| GARLAND AVE | 318 |
| I30 FRWY | 314 |
| BELT LINE RD | 312 |
| GLENBROOK DR | 304 |
| BROADWAY BLVD | 282 |
| KINGSLEY RD | 256 |
| SATURN RD | 206 |
| MILLER RD | 200 |
| CASTLE DR | 186 |
| FOREST LN | 178 |
| FIRST ST | 162 |
| LBJ FRWY | 162 |
| APOLLO RD | 158 |
| CHAHA RD | 148 |
| OATES RD | 148 |
| GEORGE BUSH HWY | 146 |
| LAVON DR | 142 |
| NORTHWEST HWY | 142 |
| BOBTOWN RD | 126 |
| BARNES DR | 122 |
| LBJ FRWY | 118 |
| EASTON MEADOWS DR | 116 |
| LBJ | 114 |
| ROSEHILL RD | 112 |
| Other | 4,499 |
2002 - 2018 National Fire Incident Reporting System (NFIRS) incidents
- Incident types reported to NFIRS in Garland, TX
- 93,64864.8%Rescue & EMS
- 12,1818.4%Good Intent Call
- 11,3517.9%Fire
- 10,6087.3%Service Call
- 9,7356.7%Hazardous Condition
- 6,8924.8%False Alarm
- Fire incident types reported to NFIRS in Garland, TX
- 4,61240.6%Structure Fires
- 4,11836.3%Outside Fires
- 2,26620.0%Mobile Property/Vehicle Fires
- 3553.1%Other
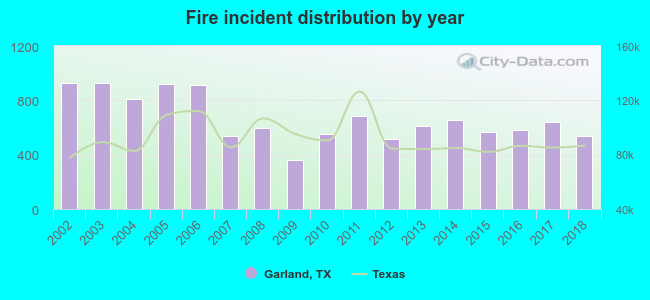 According to the data from the years 2002 - 2018 the average number of fire incidents per year is 668. The highest number of fire incidents - 929 took place in 2002, and the least - 358 in 2009. The data has a dropping trend.
The average number of yearly fire incidents per 10k residents in Garland, TX compared to nearest cities:
(Note: Based on data for the last 3 years, including only cities with population 5,000 and above)
| Garland: | 25.0 |
| Rowlett: | 17.9 |
| Sachse: | 16.6 |
| Richardson: | 18.0 |
| Murphy: | 16.6 |
| Sunnyvale: | 56.1 |
| Mesquite: | 31.4 |
| Wylie: | 21.6 |
| University Park: | 15.3 |
 The median response time based on all reported fire incidents is 5 minutes. This is lower than the Texas median value.
The median response time in Garland, TX compared to nearest cities:
(Note: Based on data for all years, including only cities with at least 500 fire incidents)
| Garland: | 5 minutes |
| Rowlett: | 6 minutes |
| Sachse: | 6 minutes |
| Richardson: | 5 minutes |
| Mesquite: | 5 minutes |
| Wylie: | 6 minutes |
| University Park: | 5 minutes |
| Rockwall: | 5 minutes |
| Dallas: | 4 minutes |
 According to the reports from the years 2002 - 2018 the average number of fire-related yearly deaths is 1. The highest number of deaths - 7 took place in 2006, and the lowest - 0 in 2002. The data has a constant trend.
The average number of deaths per 1,000 fires is 2. This indicator was the highest - 9 in 2016, and the lowest 0 in 2002. The trend for deaths per 1,000 fire incidents is declining. Compared to the Texas value the number of fatalities per 1,000 incidents is higher.
According to the reports from the years 2002 - 2018 the average number of fire-related yearly deaths is 1. The highest number of deaths - 7 took place in 2006, and the lowest - 0 in 2002. The data has a constant trend.
The average number of deaths per 1,000 fires is 2. This indicator was the highest - 9 in 2016, and the lowest 0 in 2002. The trend for deaths per 1,000 fire incidents is declining. Compared to the Texas value the number of fatalities per 1,000 incidents is higher.Deaths per 1,000 incidents in Garland, TX compared to nearest cities:
(Note: Based on data for all years, including only cities with at least 2,500 fire incidents)
| Garland: | 2.2 |
| Richardson: | 1.5 |
| Mesquite: | 0.8 |
| Dallas: | 1.5 |
| Plano: | 3.0 |
| Carrollton: | 1.7 |
| Frisco: | 1.3 |
| Irving: | 0.7 |
| McKinney: | 2.8 |
 According to the data from the years 2002 - 2018 the average number of fire-related yearly casualties is 4. The highest number of casualties - 8 took place in 2002, and the lowest - 0 in 2009. The data has a dropping trend.
The average number of casualties per 1,000 fire incidents is 5. This indicator was the highest - 11 in 2018, and the lowest 0 in 2009. The trend for injuries per 1,000 fire incidents is growing. Compared to the Texas value the number of casualties per 1,000 fires is lower.
According to the data from the years 2002 - 2018 the average number of fire-related yearly casualties is 4. The highest number of casualties - 8 took place in 2002, and the lowest - 0 in 2009. The data has a dropping trend.
The average number of casualties per 1,000 fire incidents is 5. This indicator was the highest - 11 in 2018, and the lowest 0 in 2009. The trend for injuries per 1,000 fire incidents is growing. Compared to the Texas value the number of casualties per 1,000 fires is lower.Casualties per 1,000 incidents in Garland, TX compared to nearest cities:
(Note: Based on data for all years, including only cities with at least 500 fire incidents)
| Garland: | 5.4 |
| Rowlett: | 14.3 |
| Sachse: | 15.9 |
| Richardson: | 24.9 |
| Mesquite: | 12.0 |
| Wylie: | 16.0 |
| University Park: | 5.9 |
| Rockwall: | 2.2 |
| Dallas: | 5.8 |
 29.9% incidents where reported in the morning and 70.1% in the evening. The most fires (15.3%) took place on Sunday, and the least (13.8%) on Friday.
 According to the 11,351 fire incident reports from years 2002 - 2018 most fires (10.2%) took place during January, and the least (7.3%) in October.
 Out of all 144,590 cases reported during the years 2002 - 2018, the most belonged to the categories: Rescue & EMS (64.8%), Good Intent Call (8.4%), and Fire (7.9%).
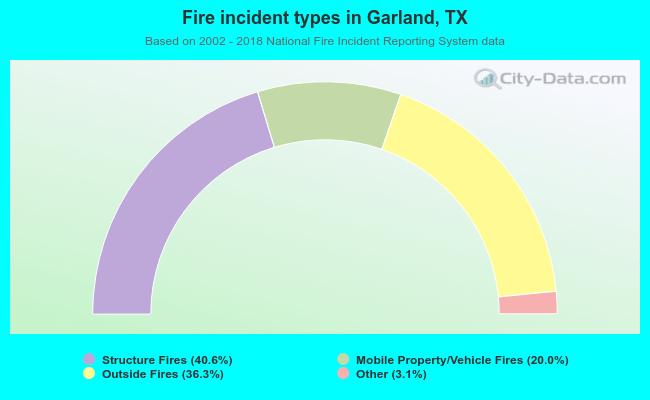 When looking into fire subcategories, the most reports belonged to: Structure Fires (40.6%), and Outside Fires (36.3%).