Mesa: Fire Incidents, Arizona (AZ)
Where are fire incidents reported in Mesa, AZ
Something went wrong! Please refresh the page.
| Fire incidents reported | |
|---|---|
| Sreet name | Count |
| MAIN ST | 1,698 |
| BROADWAY RD | 1,314 |
| COUNTRY CLUB DR | 996 |
| UNIVERSITY DR | 994 |
| DOBSON RD | 956 |
| SOUTHERN AVE | 896 |
| ALMA SCHOOL RD | 764 |
| BASELINE RD | 690 |
| MCKELLIPS RD | 636 |
| BROWN RD | 626 |
| LONGMORE | 546 |
| POWER RD | 496 |
| GILBERT RD | 456 |
| MESA DR | 444 |
| EXTENSION RD | 396 |
| STAPLEY DR | 368 |
| 60 SUPERSTITION FRWY | 344 |
| GUADALUPE RD | 330 |
| ELLSWORTH RD | 308 |
| 8TH AVE | 298 |
| CENTER ST | 270 |
| HORNE | 268 |
| HAMPTON AVE | 250 |
| GREENFIELD RD | 236 |
| VAL VISTA DR | 214 |
| HIGLEY RD | 194 |
| EMELITA AVE | 164 |
| ADOBE ST | 162 |
| MAY | 162 |
| 1ST ST | 156 |
| Other | 1,353 |
2005 - 2018 National Fire Incident Reporting System (NFIRS) incidents
- Incident types reported to NFIRS in Mesa, AZ
- 200,12473.8%Rescue & EMS
- 22,1078.2%Service Call
- 19,0197.0%Good Intent Call
- 16,9866.3%Fire
- 7,7602.9%Hazardous Condition
- 4,2931.6%False Alarm
- 5460.2%Special Incident
- Fire incident types reported to NFIRS in Mesa, AZ
- 7,37743.4%Outside Fires
- 6,18736.4%Structure Fires
- 2,83416.7%Mobile Property/Vehicle Fires
- 5873.5%Other
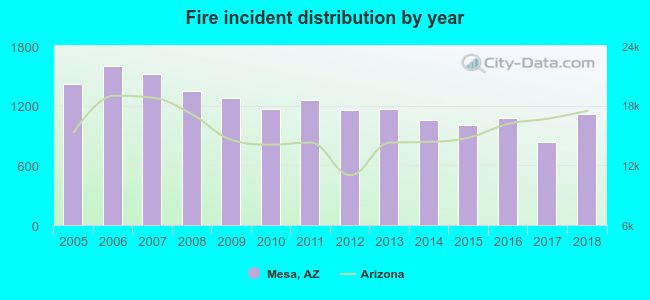 According to the data from the years 2005 - 2018 the average number of fires per year is 1,213. The highest number of reported fires - 1,596 took place in 2006, and the least - 834 in 2017. The data has a declining trend.
The average number of yearly fire incidents per 10k residents in Mesa, AZ compared to nearest cities:
(Note: Based on data for the last 3 years, including only cities with population 5,000 and above)
| Mesa: | 21.6 |
| Gilbert: | 12.8 |
| Salt River: | 1.1 |
| Chandler: | 16.6 |
| Tempe: | 29.2 |
| Apache Junction: | 8.3 |
| Guadalupe: | 9.3 |
| Queen Creek: | 21.4 |
| Scottsdale: | 14.2 |
 The median response time based on all reported fire incidents is 5 minutes. This is about the same as the Arizona median value.
The median response time in Mesa, AZ compared to nearest cities:
(Note: Based on data for all years, including only cities with at least 500 fire incidents)
| Mesa: | 5 minutes |
| Gilbert: | 5 minutes |
| Chandler: | 5 minutes |
| Tempe: | 4 minutes |
| Apache Junction: | 6 minutes |
| Queen Creek: | 6 minutes |
| Scottsdale: | 5 minutes |
| Phoenix: | 4 minutes |
| Glendale: | 4 minutes |
 Based on the reports from the years 2005 - 2018 the average number of fire-related yearly deaths is 1. The highest number of reported deaths - 3 took place in 2008, and the lowest - 0 in 2010. The data has a constant trend.
The average number of fatalities per 1,000 fire incidents is 1. This indicator was the highest - 4 in 2017, and the lowest 0 in 2010. The trend for fatalities per 1,000 fires is increasing. Compared to the Arizona value the number of deaths per 1,000 incidents is higher.
Based on the reports from the years 2005 - 2018 the average number of fire-related yearly deaths is 1. The highest number of reported deaths - 3 took place in 2008, and the lowest - 0 in 2010. The data has a constant trend.
The average number of fatalities per 1,000 fire incidents is 1. This indicator was the highest - 4 in 2017, and the lowest 0 in 2010. The trend for fatalities per 1,000 fires is increasing. Compared to the Arizona value the number of deaths per 1,000 incidents is higher.Deaths per 1,000 incidents in Mesa, AZ compared to nearest cities:
(Note: Based on data for all years, including only cities with at least 2,500 fire incidents)
| Mesa: | 0.9 |
| Gilbert: | 0.3 |
| Chandler: | 0.9 |
| Tempe: | 1.1 |
| Scottsdale: | 0.0 |
| Phoenix: | 0.0 |
| Glendale: | 0.4 |
| Peoria: | 0.3 |
| Casa Grande: | 1.1 |
 According to the data from the years 2005 - 2018 the average number of fire-related yearly casualties is 19. The highest number of reported casualties - 46 took place in 2005, and the lowest - 0 in 2015. The data has a declining trend.
The average number of casualties per 1,000 fires is 15. This indicator was the highest - 33 in 2005, and the lowest 0 in 2015. The trend for injuries per 1,000 fire incidents is declining. Compared to the state value the number of casualties per 1,000 fires is much higher.
According to the data from the years 2005 - 2018 the average number of fire-related yearly casualties is 19. The highest number of reported casualties - 46 took place in 2005, and the lowest - 0 in 2015. The data has a declining trend.
The average number of casualties per 1,000 fires is 15. This indicator was the highest - 33 in 2005, and the lowest 0 in 2015. The trend for injuries per 1,000 fire incidents is declining. Compared to the state value the number of casualties per 1,000 fires is much higher.Casualties per 1,000 incidents in Mesa, AZ compared to nearest cities:
(Note: Based on data for all years, including only cities with at least 500 fire incidents)
| Mesa: | 15.7 |
| Gilbert: | 5.0 |
| Chandler: | 1.8 |
| Tempe: | 8.7 |
| Apache Junction: | 25.6 |
| Queen Creek: | 1.5 |
| Scottsdale: | 2.6 |
| Phoenix: | 0.0 |
| Glendale: | 1.9 |
 33.4% incidents where reported in the morning and 66.6% in the evening. The most fires (15.1%) took place on Sunday, and the least (13.4%) on Wednesday.
 Based on the 16,985 fire incident reports from years 2005 - 2018 most fires (10.4%) took place during June, and the least (7.1%) in February.
 Out of all 270,998 cases reported during the years 2005 - 2018, the most belonged to the categories: Rescue & EMS (73.8%), Service Call (8.2%), and Good Intent Call (7.0%).
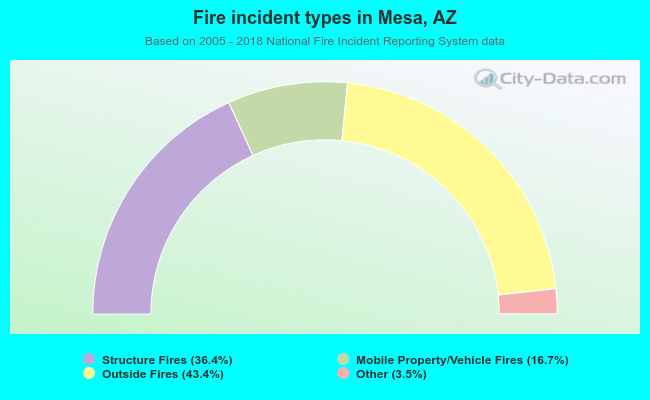 When looking into fire subcategories, the most reports belonged to: Outside Fires (43.4%), and Structure Fires (36.4%).