Glendale: Fire Incidents, Arizona (AZ)
Where are fire incidents reported in Glendale, AZ
Something went wrong! Please refresh the page.
| Fire incidents reported | |
|---|---|
| Sreet name | Count |
| 59TH AV | 1,102 |
| 67TH AV | 1,062 |
| 51ST AV | 500 |
| GLENDALE AV | 422 |
| OCOTILLO RD | 346 |
| 55TH AV | 340 |
| 61ST AV | 334 |
| 75TH AV | 306 |
| BETHANY HOME RD | 290 |
| 63RD AV | 288 |
| 43RD AV | 270 |
| 71ST AV | 216 |
| MARYLAND AV | 212 |
| OLIVE AV | 202 |
| 45TH AV | 200 |
| NORTHERN AV | 192 |
| 47TH AV | 182 |
| 65TH AV | 182 |
| 60TH AV | 178 |
| 53RD AV | 174 |
| 83RD AV | 170 |
| PEORIA AV | 166 |
| 57TH AV | 164 |
| 69TH AV | 160 |
| 54TH AV | 156 |
| MISSOURI AV | 150 |
| BELL RD | 136 |
| 49TH AV | 116 |
| MONTEBELLO AV | 116 |
| MYRTLE AV | 116 |
2003 - 2015 National Fire Incident Reporting System (NFIRS) incidents
- Incident types reported to NFIRS in Glendale, AZ
- 22,44754.5%Rescue & EMS
- 7,88319.2%Fire
- 3,4158.3%Good Intent Call
- 3,3168.1%Special Incident
- 1,9624.8%Hazardous Condition
- 1,4783.6%Service Call
- 6561.6%False Alarm
- Fire incident types reported to NFIRS in Glendale, AZ
- 4,48156.8%Outside Fires
- 1,74522.1%Structure Fires
- 1,31016.6%Mobile Property/Vehicle Fires
- 3474.4%Other
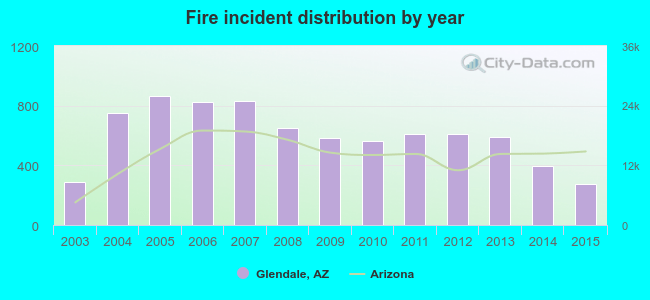 Based on the data from the years 2003 - 2015 the average number of fires per year is 602. The highest number of fire incidents - 862 took place in 2005, and the least - 273 in 2015. The data has a dropping trend.
The average number of yearly fire incidents per 10k residents in Glendale, AZ compared to nearest cities:
(Note: Based on data for the last 3 years, including only cities with population 5,000 and above)
| Glendale: | 0.8 |
| Sun City: | 22.6 |
| Peoria: | 6.5 |
| Youngtown: | 53.5 |
| El Mirage: | 32.0 |
| Phoenix: | 36.2 |
| Tolleson: | 96.7 |
| Litchfield Park: | 17.9 |
| Avondale: | 34.3 |
 The median response time based on all reported fire incidents is 4 minutes. This is lower compared to the state median value.
The median response time in Glendale, AZ compared to nearest cities:
(Note: Based on data for all years, including only cities with at least 500 fire incidents)
| Glendale: | 4 minutes |
| Sun City: | 4 minutes |
| Peoria: | 5 minutes |
| El Mirage: | 5 minutes |
| Phoenix: | 4 minutes |
| Avondale: | 5 minutes |
| Surprise: | 5 minutes |
| Scottsdale: | 5 minutes |
| Goodyear: | 6 minutes |
 According to the data from the years 2003 - 2015 the average number of fire-related yearly deaths is 0. The highest number of reported deaths - 1 took place in 2003, and the lowest - 0 in 2005. The data has a decreasing trend.
The average number of fatalities per 1,000 fire incidents is 1. This indicator was the highest - 3 in 2003, and the lowest 0 in 2005. The trend for deaths per 1,000 fires is decreasing. Compared to the Arizona value the number of fatalities per 1,000 fire incidents is lower.
According to the data from the years 2003 - 2015 the average number of fire-related yearly deaths is 0. The highest number of reported deaths - 1 took place in 2003, and the lowest - 0 in 2005. The data has a decreasing trend.
The average number of fatalities per 1,000 fire incidents is 1. This indicator was the highest - 3 in 2003, and the lowest 0 in 2005. The trend for deaths per 1,000 fires is decreasing. Compared to the Arizona value the number of fatalities per 1,000 fire incidents is lower.
 According to the reports from the years 2003 - 2015 the average number of fire-related casualties per year is 1. The highest number of casualties - 5 took place in 2005, and the lowest - 0 in 2003. The data has a constant trend.
The average number of injuries per 1,000 fires is 1. This indicator was the highest - 6 in 2005, and the lowest 0 in 2003. The trend for injuries per 1,000 fires is constant. Compared to the Arizona value the number of casualties per 1,000 incidents is much lower.
According to the reports from the years 2003 - 2015 the average number of fire-related casualties per year is 1. The highest number of casualties - 5 took place in 2005, and the lowest - 0 in 2003. The data has a constant trend.
The average number of injuries per 1,000 fires is 1. This indicator was the highest - 6 in 2005, and the lowest 0 in 2003. The trend for injuries per 1,000 fires is constant. Compared to the Arizona value the number of casualties per 1,000 incidents is much lower.
 33.0% incidents where reported in the morning and 67.0% in the evening. The most fires (15.9%) took place on Sunday, and the least (13.0%) on Friday.
 Based on the 7,883 incident reports from years 2003 - 2015 most fires (10.4%) took place during May, and the least (6.9%) in February.
 Out of all 41,163 cases reported during the years 2003 - 2015, the most belonged to the categories: Rescue & EMS (54.5%), Fire (19.2%), and Good Intent Call (8.3%).
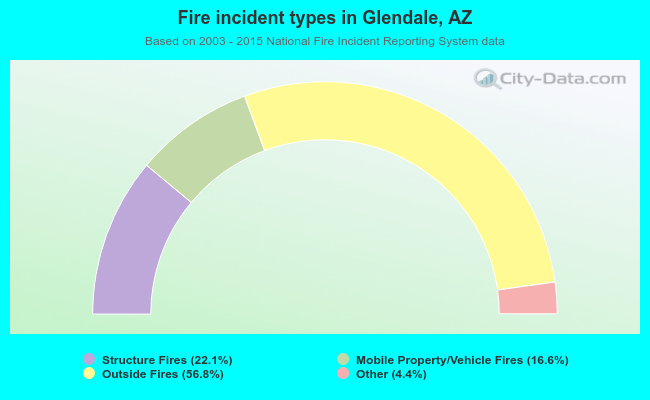 When looking into fire subcategories, the most reports belonged to: Outside Fires (56.8%), and Structure Fires (22.1%).