Glenpool, Oklahoma Submit your own pictures of this city and show them to the world
OSM Map
General Map
Google Map
MSN Map
OSM Map
General Map
Google Map
MSN Map
OSM Map
General Map
Google Map
MSN Map
OSM Map
General Map
Google Map
MSN Map
Please wait while loading the map...
Population in 2022: 14,211 (89% urban, 11% rural). Population change since 2000: +74.9%Males: 6,732 Females: 7,479
March 2022 cost of living index in Glenpool: 87.1 (less than average, U.S. average is 100) Percentage of residents living in poverty in 2022: 9.2%for White Non-Hispanic residents , 7.0% for Hispanic or Latino residents , 24.5% for American Indian residents , 7.8% for two or more races residents )
Profiles of local businesses
Business Search - 14 Million verified businesses
Data:
Median household income ($)
Median household income (% change since 2000)
Household income diversity
Ratio of average income to average house value (%)
Ratio of average income to average rent
Median household income ($) - White
Median household income ($) - Black or African American
Median household income ($) - Asian
Median household income ($) - Hispanic or Latino
Median household income ($) - American Indian and Alaska Native
Median household income ($) - Multirace
Median household income ($) - Other Race
Median household income for houses/condos with a mortgage ($)
Median household income for apartments without a mortgage ($)
Races - White alone (%)
Races - White alone (% change since 2000)
Races - Black alone (%)
Races - Black alone (% change since 2000)
Races - American Indian alone (%)
Races - American Indian alone (% change since 2000)
Races - Asian alone (%)
Races - Asian alone (% change since 2000)
Races - Hispanic (%)
Races - Hispanic (% change since 2000)
Races - Native Hawaiian and Other Pacific Islander alone (%)
Races - Native Hawaiian and Other Pacific Islander alone (% change since 2000)
Races - Two or more races (%)
Races - Two or more races (% change since 2000)
Races - Other race alone (%)
Races - Other race alone (% change since 2000)
Racial diversity
Unemployment (%)
Unemployment (% change since 2000)
Unemployment (%) - White
Unemployment (%) - Black or African American
Unemployment (%) - Asian
Unemployment (%) - Hispanic or Latino
Unemployment (%) - American Indian and Alaska Native
Unemployment (%) - Multirace
Unemployment (%) - Other Race
Population density (people per square mile)
Population - Males (%)
Population - Females (%)
Population - Males (%) - White
Population - Males (%) - Black or African American
Population - Males (%) - Asian
Population - Males (%) - Hispanic or Latino
Population - Males (%) - American Indian and Alaska Native
Population - Males (%) - Multirace
Population - Males (%) - Other Race
Population - Females (%) - White
Population - Females (%) - Black or African American
Population - Females (%) - Asian
Population - Females (%) - Hispanic or Latino
Population - Females (%) - American Indian and Alaska Native
Population - Females (%) - Multirace
Population - Females (%) - Other Race
Coronavirus confirmed cases (May 21, 2024)
Deaths caused by coronavirus (May 21, 2024)
Coronavirus confirmed cases (per 100k population) (May 21, 2024)
Deaths caused by coronavirus (per 100k population) (May 21, 2024)
Daily increase in number of cases (May 21, 2024)
Weekly increase in number of cases (May 21, 2024)
Cases doubled (in days) (May 21, 2024)
Hospitalized patients (Apr 18, 2022)
Negative test results (Apr 18, 2022)
Total test results (Apr 18, 2022)
COVID Vaccine doses distributed (per 100k population) (Sep 19, 2023)
COVID Vaccine doses administered (per 100k population) (Sep 19, 2023)
COVID Vaccine doses distributed (Sep 19, 2023)
COVID Vaccine doses administered (Sep 19, 2023)
Likely homosexual households (%)
Likely homosexual households (% change since 2000)
Likely homosexual households - Lesbian couples (%)
Likely homosexual households - Lesbian couples (% change since 2000)
Likely homosexual households - Gay men (%)
Likely homosexual households - Gay men (% change since 2000)
Cost of living index
Median gross rent ($)
Median contract rent ($)
Median monthly housing costs ($)
Median house or condo value ($)
Median house or condo value ($ change since 2000)
Mean house or condo value by units in structure - 1, detached ($)
Mean house or condo value by units in structure - 1, attached ($)
Mean house or condo value by units in structure - 2 ($)
Mean house or condo value by units in structure by units in structure - 3 or 4 ($)
Mean house or condo value by units in structure - 5 or more ($)
Mean house or condo value by units in structure - Boat, RV, van, etc. ($)
Mean house or condo value by units in structure - Mobile home ($)
Median house or condo value ($) - White
Median house or condo value ($) - Black or African American
Median house or condo value ($) - Asian
Median house or condo value ($) - Hispanic or Latino
Median house or condo value ($) - American Indian and Alaska Native
Median house or condo value ($) - Multirace
Median house or condo value ($) - Other Race
Median resident age
Resident age diversity
Median resident age - Males
Median resident age - Females
Median resident age - White
Median resident age - Black or African American
Median resident age - Asian
Median resident age - Hispanic or Latino
Median resident age - American Indian and Alaska Native
Median resident age - Multirace
Median resident age - Other Race
Median resident age - Males - White
Median resident age - Males - Black or African American
Median resident age - Males - Asian
Median resident age - Males - Hispanic or Latino
Median resident age - Males - American Indian and Alaska Native
Median resident age - Males - Multirace
Median resident age - Males - Other Race
Median resident age - Females - White
Median resident age - Females - Black or African American
Median resident age - Females - Asian
Median resident age - Females - Hispanic or Latino
Median resident age - Females - American Indian and Alaska Native
Median resident age - Females - Multirace
Median resident age - Females - Other Race
Commute - mean travel time to work (minutes)
Travel time to work - Less than 5 minutes (%)
Travel time to work - Less than 5 minutes (% change since 2000)
Travel time to work - 5 to 9 minutes (%)
Travel time to work - 5 to 9 minutes (% change since 2000)
Travel time to work - 10 to 19 minutes (%)
Travel time to work - 10 to 19 minutes (% change since 2000)
Travel time to work - 20 to 29 minutes (%)
Travel time to work - 20 to 29 minutes (% change since 2000)
Travel time to work - 30 to 39 minutes (%)
Travel time to work - 30 to 39 minutes (% change since 2000)
Travel time to work - 40 to 59 minutes (%)
Travel time to work - 40 to 59 minutes (% change since 2000)
Travel time to work - 60 to 89 minutes (%)
Travel time to work - 60 to 89 minutes (% change since 2000)
Travel time to work - 90 or more minutes (%)
Travel time to work - 90 or more minutes (% change since 2000)
Marital status - Never married (%)
Marital status - Now married (%)
Marital status - Separated (%)
Marital status - Widowed (%)
Marital status - Divorced (%)
Median family income ($)
Median family income (% change since 2000)
Median non-family income ($)
Median non-family income (% change since 2000)
Median per capita income ($)
Median per capita income (% change since 2000)
Median family income ($) - White
Median family income ($) - Black or African American
Median family income ($) - Asian
Median family income ($) - Hispanic or Latino
Median family income ($) - American Indian and Alaska Native
Median family income ($) - Multirace
Median family income ($) - Other Race
Median year house/condo built
Median year apartment built
Year house built - Built 2005 or later (%)
Year house built - Built 2000 to 2004 (%)
Year house built - Built 1990 to 1999 (%)
Year house built - Built 1980 to 1989 (%)
Year house built - Built 1970 to 1979 (%)
Year house built - Built 1960 to 1969 (%)
Year house built - Built 1950 to 1959 (%)
Year house built - Built 1940 to 1949 (%)
Year house built - Built 1939 or earlier (%)
Average household size
Household density (households per square mile)
Average household size - White
Average household size - Black or African American
Average household size - Asian
Average household size - Hispanic or Latino
Average household size - American Indian and Alaska Native
Average household size - Multirace
Average household size - Other Race
Occupied housing units (%)
Vacant housing units (%)
Owner occupied housing units (%)
Renter occupied housing units (%)
Vacancy status - For rent (%)
Vacancy status - For sale only (%)
Vacancy status - Rented or sold, not occupied (%)
Vacancy status - For seasonal, recreational, or occasional use (%)
Vacancy status - For migrant workers (%)
Vacancy status - Other vacant (%)
Residents with income below the poverty level (%)
Residents with income below 50% of the poverty level (%)
Children below poverty level (%)
Poor families by family type - Married-couple family (%)
Poor families by family type - Male, no wife present (%)
Poor families by family type - Female, no husband present (%)
Poverty status for native-born residents (%)
Poverty status for foreign-born residents (%)
Poverty among high school graduates not in families (%)
Poverty among people who did not graduate high school not in families (%)
Residents with income below the poverty level (%) - White
Residents with income below the poverty level (%) - Black or African American
Residents with income below the poverty level (%) - Asian
Residents with income below the poverty level (%) - Hispanic or Latino
Residents with income below the poverty level (%) - American Indian and Alaska Native
Residents with income below the poverty level (%) - Multirace
Residents with income below the poverty level (%) - Other Race
Air pollution - Air Quality Index (AQI)
Air pollution - CO
Air pollution - NO2
Air pollution - SO2
Air pollution - Ozone
Air pollution - PM10
Air pollution - PM25
Air pollution - Pb
Crime - Murders per 100,000 population
Crime - Rapes per 100,000 population
Crime - Robberies per 100,000 population
Crime - Assaults per 100,000 population
Crime - Burglaries per 100,000 population
Crime - Thefts per 100,000 population
Crime - Auto thefts per 100,000 population
Crime - Arson per 100,000 population
Crime - City-data.com crime index
Crime - Violent crime index
Crime - Property crime index
Crime - Murders per 100,000 population (5 year average)
Crime - Rapes per 100,000 population (5 year average)
Crime - Robberies per 100,000 population (5 year average)
Crime - Assaults per 100,000 population (5 year average)
Crime - Burglaries per 100,000 population (5 year average)
Crime - Thefts per 100,000 population (5 year average)
Crime - Auto thefts per 100,000 population (5 year average)
Crime - Arson per 100,000 population (5 year average)
Crime - City-data.com crime index (5 year average)
Crime - Violent crime index (5 year average)
Crime - Property crime index (5 year average)
1996 Presidential Elections Results (%) - Democratic Party (Clinton)
1996 Presidential Elections Results (%) - Republican Party (Dole)
1996 Presidential Elections Results (%) - Other
2000 Presidential Elections Results (%) - Democratic Party (Gore)
2000 Presidential Elections Results (%) - Republican Party (Bush)
2000 Presidential Elections Results (%) - Other
2004 Presidential Elections Results (%) - Democratic Party (Kerry)
2004 Presidential Elections Results (%) - Republican Party (Bush)
2004 Presidential Elections Results (%) - Other
2008 Presidential Elections Results (%) - Democratic Party (Obama)
2008 Presidential Elections Results (%) - Republican Party (McCain)
2008 Presidential Elections Results (%) - Other
2012 Presidential Elections Results (%) - Democratic Party (Obama)
2012 Presidential Elections Results (%) - Republican Party (Romney)
2012 Presidential Elections Results (%) - Other
2016 Presidential Elections Results (%) - Democratic Party (Clinton)
2016 Presidential Elections Results (%) - Republican Party (Trump)
2016 Presidential Elections Results (%) - Other
2020 Presidential Elections Results (%) - Democratic Party (Biden)
2020 Presidential Elections Results (%) - Republican Party (Trump)
2020 Presidential Elections Results (%) - Other
Ancestries Reported - Arab (%)
Ancestries Reported - Czech (%)
Ancestries Reported - Danish (%)
Ancestries Reported - Dutch (%)
Ancestries Reported - English (%)
Ancestries Reported - French (%)
Ancestries Reported - French Canadian (%)
Ancestries Reported - German (%)
Ancestries Reported - Greek (%)
Ancestries Reported - Hungarian (%)
Ancestries Reported - Irish (%)
Ancestries Reported - Italian (%)
Ancestries Reported - Lithuanian (%)
Ancestries Reported - Norwegian (%)
Ancestries Reported - Polish (%)
Ancestries Reported - Portuguese (%)
Ancestries Reported - Russian (%)
Ancestries Reported - Scotch-Irish (%)
Ancestries Reported - Scottish (%)
Ancestries Reported - Slovak (%)
Ancestries Reported - Subsaharan African (%)
Ancestries Reported - Swedish (%)
Ancestries Reported - Swiss (%)
Ancestries Reported - Ukrainian (%)
Ancestries Reported - United States (%)
Ancestries Reported - Welsh (%)
Ancestries Reported - West Indian (%)
Ancestries Reported - Other (%)
Educational Attainment - No schooling completed (%)
Educational Attainment - Less than high school (%)
Educational Attainment - High school or equivalent (%)
Educational Attainment - Less than 1 year of college (%)
Educational Attainment - 1 or more years of college (%)
Educational Attainment - Associate degree (%)
Educational Attainment - Bachelor's degree (%)
Educational Attainment - Master's degree (%)
Educational Attainment - Professional school degree (%)
Educational Attainment - Doctorate degree (%)
School Enrollment - Nursery, preschool (%)
School Enrollment - Kindergarten (%)
School Enrollment - Grade 1 to 4 (%)
School Enrollment - Grade 5 to 8 (%)
School Enrollment - Grade 9 to 12 (%)
School Enrollment - College undergrad (%)
School Enrollment - Graduate or professional (%)
School Enrollment - Not enrolled in school (%)
School enrollment - Public schools (%)
School enrollment - Private schools (%)
School enrollment - Not enrolled (%)
Median number of rooms in houses and condos
Median number of rooms in apartments
Housing units lacking complete plumbing facilities (%)
Housing units lacking complete kitchen facilities (%)
Density of houses
Urban houses (%)
Rural houses (%)
Households with people 60 years and over (%)
Households with people 65 years and over (%)
Households with people 75 years and over (%)
Households with one or more nonrelatives (%)
Households with no nonrelatives (%)
Population in households (%)
Family households (%)
Nonfamily households (%)
Population in families (%)
Family households with own children (%)
Median number of bedrooms in owner occupied houses
Mean number of bedrooms in owner occupied houses
Median number of bedrooms in renter occupied houses
Mean number of bedrooms in renter occupied houses
Median number of vehichles in owner occupied houses
Mean number of vehichles in owner occupied houses
Median number of vehichles in renter occupied houses
Mean number of vehichles in renter occupied houses
Mortgage status - with mortgage (%)
Mortgage status - with second mortgage (%)
Mortgage status - with home equity loan (%)
Mortgage status - with both second mortgage and home equity loan (%)
Mortgage status - without a mortgage (%)
Average family size
Average family size - White
Average family size - Black or African American
Average family size - Asian
Average family size - Hispanic or Latino
Average family size - American Indian and Alaska Native
Average family size - Multirace
Average family size - Other Race
Geographical mobility - Same house 1 year ago (%)
Geographical mobility - Moved within same county (%)
Geographical mobility - Moved from different county within same state (%)
Geographical mobility - Moved from different state (%)
Geographical mobility - Moved from abroad (%)
Place of birth - Born in state of residence (%)
Place of birth - Born in other state (%)
Place of birth - Native, outside of US (%)
Place of birth - Foreign born (%)
Housing units in structures - 1, detached (%)
Housing units in structures - 1, attached (%)
Housing units in structures - 2 (%)
Housing units in structures - 3 or 4 (%)
Housing units in structures - 5 to 9 (%)
Housing units in structures - 10 to 19 (%)
Housing units in structures - 20 to 49 (%)
Housing units in structures - 50 or more (%)
Housing units in structures - Mobile home (%)
Housing units in structures - Boat, RV, van, etc. (%)
House/condo owner moved in on average (years ago)
Renter moved in on average (years ago)
Year householder moved into unit - Moved in 1999 to March 2000 (%)
Year householder moved into unit - Moved in 1995 to 1998 (%)
Year householder moved into unit - Moved in 1990 to 1994 (%)
Year householder moved into unit - Moved in 1980 to 1989 (%)
Year householder moved into unit - Moved in 1970 to 1979 (%)
Year householder moved into unit - Moved in 1969 or earlier (%)
Means of transportation to work - Drove car alone (%)
Means of transportation to work - Carpooled (%)
Means of transportation to work - Public transportation (%)
Means of transportation to work - Bus or trolley bus (%)
Means of transportation to work - Streetcar or trolley car (%)
Means of transportation to work - Subway or elevated (%)
Means of transportation to work - Railroad (%)
Means of transportation to work - Ferryboat (%)
Means of transportation to work - Taxicab (%)
Means of transportation to work - Motorcycle (%)
Means of transportation to work - Bicycle (%)
Means of transportation to work - Walked (%)
Means of transportation to work - Other means (%)
Working at home (%)
Industry diversity
Most Common Industries - Agriculture, forestry, fishing and hunting, and mining (%)
Most Common Industries - Agriculture, forestry, fishing and hunting (%)
Most Common Industries - Mining, quarrying, and oil and gas extraction (%)
Most Common Industries - Construction (%)
Most Common Industries - Manufacturing (%)
Most Common Industries - Wholesale trade (%)
Most Common Industries - Retail trade (%)
Most Common Industries - Transportation and warehousing, and utilities (%)
Most Common Industries - Transportation and warehousing (%)
Most Common Industries - Utilities (%)
Most Common Industries - Information (%)
Most Common Industries - Finance and insurance, and real estate and rental and leasing (%)
Most Common Industries - Finance and insurance (%)
Most Common Industries - Real estate and rental and leasing (%)
Most Common Industries - Professional, scientific, and management, and administrative and waste management services (%)
Most Common Industries - Professional, scientific, and technical services (%)
Most Common Industries - Management of companies and enterprises (%)
Most Common Industries - Administrative and support and waste management services (%)
Most Common Industries - Educational services, and health care and social assistance (%)
Most Common Industries - Educational services (%)
Most Common Industries - Health care and social assistance (%)
Most Common Industries - Arts, entertainment, and recreation, and accommodation and food services (%)
Most Common Industries - Arts, entertainment, and recreation (%)
Most Common Industries - Accommodation and food services (%)
Most Common Industries - Other services, except public administration (%)
Most Common Industries - Public administration (%)
Occupation diversity
Most Common Occupations - Management, business, science, and arts occupations (%)
Most Common Occupations - Management, business, and financial occupations (%)
Most Common Occupations - Management occupations (%)
Most Common Occupations - Business and financial operations occupations (%)
Most Common Occupations - Computer, engineering, and science occupations (%)
Most Common Occupations - Computer and mathematical occupations (%)
Most Common Occupations - Architecture and engineering occupations (%)
Most Common Occupations - Life, physical, and social science occupations (%)
Most Common Occupations - Education, legal, community service, arts, and media occupations (%)
Most Common Occupations - Community and social service occupations (%)
Most Common Occupations - Legal occupations (%)
Most Common Occupations - Education, training, and library occupations (%)
Most Common Occupations - Arts, design, entertainment, sports, and media occupations (%)
Most Common Occupations - Healthcare practitioners and technical occupations (%)
Most Common Occupations - Health diagnosing and treating practitioners and other technical occupations (%)
Most Common Occupations - Health technologists and technicians (%)
Most Common Occupations - Service occupations (%)
Most Common Occupations - Healthcare support occupations (%)
Most Common Occupations - Protective service occupations (%)
Most Common Occupations - Fire fighting and prevention, and other protective service workers including supervisors (%)
Most Common Occupations - Law enforcement workers including supervisors (%)
Most Common Occupations - Food preparation and serving related occupations (%)
Most Common Occupations - Building and grounds cleaning and maintenance occupations (%)
Most Common Occupations - Personal care and service occupations (%)
Most Common Occupations - Sales and office occupations (%)
Most Common Occupations - Sales and related occupations (%)
Most Common Occupations - Office and administrative support occupations (%)
Most Common Occupations - Natural resources, construction, and maintenance occupations (%)
Most Common Occupations - Farming, fishing, and forestry occupations (%)
Most Common Occupations - Construction and extraction occupations (%)
Most Common Occupations - Installation, maintenance, and repair occupations (%)
Most Common Occupations - Production, transportation, and material moving occupations (%)
Most Common Occupations - Production occupations (%)
Most Common Occupations - Transportation occupations (%)
Most Common Occupations - Material moving occupations (%)
People in Group quarters - Institutionalized population (%)
People in Group quarters - Correctional institutions (%)
People in Group quarters - Federal prisons and detention centers (%)
People in Group quarters - Halfway houses (%)
People in Group quarters - Local jails and other confinement facilities (including police lockups) (%)
People in Group quarters - Military disciplinary barracks (%)
People in Group quarters - State prisons (%)
People in Group quarters - Other types of correctional institutions (%)
People in Group quarters - Nursing homes (%)
People in Group quarters - Hospitals/wards, hospices, and schools for the handicapped (%)
People in Group quarters - Hospitals/wards and hospices for chronically ill (%)
People in Group quarters - Hospices or homes for chronically ill (%)
People in Group quarters - Military hospitals or wards for chronically ill (%)
People in Group quarters - Other hospitals or wards for chronically ill (%)
People in Group quarters - Hospitals or wards for drug/alcohol abuse (%)
People in Group quarters - Mental (Psychiatric) hospitals or wards (%)
People in Group quarters - Schools, hospitals, or wards for the mentally retarded (%)
People in Group quarters - Schools, hospitals, or wards for the physically handicapped (%)
People in Group quarters - Institutions for the deaf (%)
People in Group quarters - Institutions for the blind (%)
People in Group quarters - Orthopedic wards and institutions for the physically handicapped (%)
People in Group quarters - Wards in general hospitals for patients who have no usual home elsewhere (%)
People in Group quarters - Wards in military hospitals for patients who have no usual home elsewhere (%)
People in Group quarters - Juvenile institutions (%)
People in Group quarters - Long-term care (%)
People in Group quarters - Homes for abused, dependent, and neglected children (%)
People in Group quarters - Residential treatment centers for emotionally disturbed children (%)
People in Group quarters - Training schools for juvenile delinquents (%)
People in Group quarters - Short-term care, detention or diagnostic centers for delinquent children (%)
People in Group quarters - Type of juvenile institution unknown (%)
People in Group quarters - Noninstitutionalized population (%)
People in Group quarters - College dormitories (includes college quarters off campus) (%)
People in Group quarters - Military quarters (%)
People in Group quarters - On base (%)
People in Group quarters - Barracks, unaccompanied personnel housing (UPH), (Enlisted/Officer), ;and similar group living quarters for military personnel (%)
People in Group quarters - Transient quarters for temporary residents (%)
People in Group quarters - Military ships (%)
People in Group quarters - Group homes (%)
People in Group quarters - Homes or halfway houses for drug/alcohol abuse (%)
People in Group quarters - Homes for the mentally ill (%)
People in Group quarters - Homes for the mentally retarded (%)
People in Group quarters - Homes for the physically handicapped (%)
People in Group quarters - Other group homes (%)
People in Group quarters - Religious group quarters (%)
People in Group quarters - Dormitories (%)
People in Group quarters - Agriculture workers' dormitories on farms (%)
People in Group quarters - Job Corps and vocational training facilities (%)
People in Group quarters - Other workers' dormitories (%)
People in Group quarters - Crews of maritime vessels (%)
People in Group quarters - Other nonhousehold living situations (%)
People in Group quarters - Other noninstitutional group quarters (%)
Residents speaking English at home (%)
Residents speaking English at home - Born in the United States (%)
Residents speaking English at home - Native, born elsewhere (%)
Residents speaking English at home - Foreign born (%)
Residents speaking Spanish at home (%)
Residents speaking Spanish at home - Born in the United States (%)
Residents speaking Spanish at home - Native, born elsewhere (%)
Residents speaking Spanish at home - Foreign born (%)
Residents speaking other language at home (%)
Residents speaking other language at home - Born in the United States (%)
Residents speaking other language at home - Native, born elsewhere (%)
Residents speaking other language at home - Foreign born (%)
Class of Workers - Employee of private company (%)
Class of Workers - Self-employed in own incorporated business (%)
Class of Workers - Private not-for-profit wage and salary workers (%)
Class of Workers - Local government workers (%)
Class of Workers - State government workers (%)
Class of Workers - Federal government workers (%)
Class of Workers - Self-employed workers in own not incorporated business and Unpaid family workers (%)
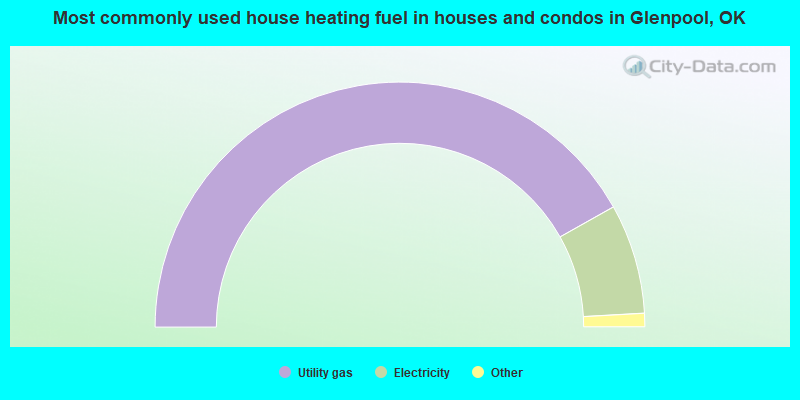
House heating fuel used in houses and condos - Utility gas (%)
House heating fuel used in houses and condos - Bottled, tank, or LP gas (%)
House heating fuel used in houses and condos - Electricity (%)
House heating fuel used in houses and condos - Fuel oil, kerosene, etc. (%)
House heating fuel used in houses and condos - Coal or coke (%)
House heating fuel used in houses and condos - Wood (%)
House heating fuel used in houses and condos - Solar energy (%)
House heating fuel used in houses and condos - Other fuel (%)
House heating fuel used in houses and condos - No fuel used (%)
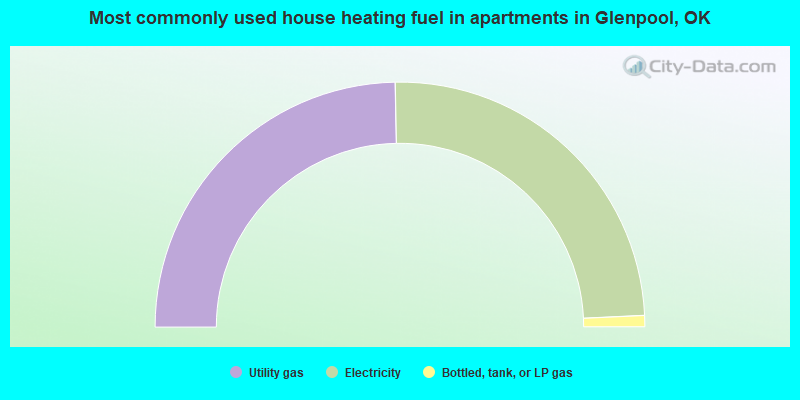
House heating fuel used in apartments - Utility gas (%)
House heating fuel used in apartments - Bottled, tank, or LP gas (%)
House heating fuel used in apartments - Electricity (%)
House heating fuel used in apartments - Fuel oil, kerosene, etc. (%)
House heating fuel used in apartments - Coal or coke (%)
House heating fuel used in apartments - Wood (%)
House heating fuel used in apartments - Solar energy (%)
House heating fuel used in apartments - Other fuel (%)
House heating fuel used in apartments - No fuel used (%)
Armed forces status - In Armed Forces (%)
Armed forces status - Civilian (%)
Armed forces status - Civilian - Veteran (%)
Armed forces status - Civilian - Nonveteran (%)
Fatal accidents locations in years 2005-2021
Fatal accidents locations in 2005
Fatal accidents locations in 2006
Fatal accidents locations in 2007
Fatal accidents locations in 2008
Fatal accidents locations in 2009
Fatal accidents locations in 2010
Fatal accidents locations in 2011
Fatal accidents locations in 2012
Fatal accidents locations in 2013
Fatal accidents locations in 2014
Fatal accidents locations in 2015
Fatal accidents locations in 2016
Fatal accidents locations in 2017
Fatal accidents locations in 2018
Fatal accidents locations in 2019
Fatal accidents locations in 2020
Fatal accidents locations in 2021
Alcohol use - People drinking some alcohol every month (%)
Alcohol use - People not drinking at all (%)
Alcohol use - Average days/month drinking alcohol
Alcohol use - Average drinks/week
Alcohol use - Average days/year people drink much
Audiometry - Average condition of hearing (%)
Audiometry - People that can hear a whisper from across a quiet room (%)
Audiometry - People that can hear normal voice from across a quiet room (%)
Audiometry - Ears ringing, roaring, buzzing (%)
Audiometry - Had a job exposure to loud noise (%)
Audiometry - Had off-work exposure to loud noise (%)
Blood Pressure & Cholesterol - Has high blood pressure (%)
Blood Pressure & Cholesterol - Checking blood pressure at home (%)
Blood Pressure & Cholesterol - Frequently checking blood cholesterol (%)
Blood Pressure & Cholesterol - Has high cholesterol level (%)
Consumer Behavior - Money monthly spent on food at supermarket/grocery store
Consumer Behavior - Money monthly spent on food at other stores
Consumer Behavior - Money monthly spent on eating out
Consumer Behavior - Money monthly spent on carryout/delivered foods
Consumer Behavior - Income spent on food at supermarket/grocery store (%)
Consumer Behavior - Income spent on food at other stores (%)
Consumer Behavior - Income spent on eating out (%)
Consumer Behavior - Income spent on carryout/delivered foods (%)
Current Health Status - General health condition (%)
Current Health Status - Blood donors (%)
Current Health Status - Has blood ever tested for HIV virus (%)
Current Health Status - Left-handed people (%)
Dermatology - People using sunscreen (%)
Diabetes - Diabetics (%)
Diabetes - Had a blood test for high blood sugar (%)
Diabetes - People taking insulin (%)
Diet Behavior & Nutrition - Diet health (%)
Diet Behavior & Nutrition - Milk product consumption (# of products/month)
Diet Behavior & Nutrition - Meals not home prepared (#/week)
Diet Behavior & Nutrition - Meals from fast food or pizza place (#/week)
Diet Behavior & Nutrition - Ready-to-eat foods (#/month)
Diet Behavior & Nutrition - Frozen meals/pizza (#/month)
Drug Use - People that ever used marijuana or hashish (%)
Drug Use - Ever used hard drugs (%)
Drug Use - Ever used any form of cocaine (%)
Drug Use - Ever used heroin (%)
Drug Use - Ever used methamphetamine (%)
Health Insurance - People covered by health insurance (%)
Kidney Conditions-Urology - Avg. # of times urinating at night
Medical Conditions - People with asthma (%)
Medical Conditions - People with anemia (%)
Medical Conditions - People with psoriasis (%)
Medical Conditions - People with overweight (%)
Medical Conditions - Elderly people having difficulties in thinking or remembering (%)
Medical Conditions - People who ever received blood transfusion (%)
Medical Conditions - People having trouble seeing even with glass/contacts (%)
Medical Conditions - People with arthritis (%)
Medical Conditions - People with gout (%)
Medical Conditions - People with congestive heart failure (%)
Medical Conditions - People with coronary heart disease (%)
Medical Conditions - People with angina pectoris (%)
Medical Conditions - People who ever had heart attack (%)
Medical Conditions - People who ever had stroke (%)
Medical Conditions - People with emphysema (%)
Medical Conditions - People with thyroid problem (%)
Medical Conditions - People with chronic bronchitis (%)
Medical Conditions - People with any liver condition (%)
Medical Conditions - People who ever had cancer or malignancy (%)
Mental Health - People who have little interest in doing things (%)
Mental Health - People feeling down, depressed, or hopeless (%)
Mental Health - People who have trouble sleeping or sleeping too much (%)
Mental Health - People feeling tired or having little energy (%)
Mental Health - People with poor appetite or overeating (%)
Mental Health - People feeling bad about themself (%)
Mental Health - People who have trouble concentrating on things (%)
Mental Health - People moving or speaking slowly or too fast (%)
Mental Health - People having thoughts they would be better off dead (%)
Oral Health - Average years since last visit a dentist
Oral Health - People embarrassed because of mouth (%)
Oral Health - People with gum disease (%)
Oral Health - General health of teeth and gums (%)
Oral Health - Average days a week using dental floss/device
Oral Health - Average days a week using mouthwash for dental problem
Oral Health - Average number of teeth
Pesticide Use - Households using pesticides to control insects (%)
Pesticide Use - Households using pesticides to kill weeds (%)
Physical Activity - People doing vigorous-intensity work activities (%)
Physical Activity - People doing moderate-intensity work activities (%)
Physical Activity - People walking or bicycling (%)
Physical Activity - People doing vigorous-intensity recreational activities (%)
Physical Activity - People doing moderate-intensity recreational activities (%)
Physical Activity - Average hours a day doing sedentary activities
Physical Activity - Average hours a day watching TV or videos
Physical Activity - Average hours a day using computer
Physical Functioning - People having limitations keeping them from working (%)
Physical Functioning - People limited in amount of work they can do (%)
Physical Functioning - People that need special equipment to walk (%)
Physical Functioning - People experiencing confusion/memory problems (%)
Physical Functioning - People requiring special healthcare equipment (%)
Prescription Medications - Average number of prescription medicines taking
Preventive Aspirin Use - Adults 40+ taking low-dose aspirin (%)
Reproductive Health - Vaginal deliveries (%)
Reproductive Health - Cesarean deliveries (%)
Reproductive Health - Deliveries resulted in a live birth (%)
Reproductive Health - Pregnancies resulted in a delivery (%)
Reproductive Health - Women breastfeeding newborns (%)
Reproductive Health - Women that had a hysterectomy (%)
Reproductive Health - Women that had both ovaries removed (%)
Reproductive Health - Women that have ever taken birth control pills (%)
Reproductive Health - Women taking birth control pills (%)
Reproductive Health - Women that have ever used Depo-Provera or injectables (%)
Reproductive Health - Women that have ever used female hormones (%)
Sexual Behavior - People 18+ that ever had sex (vaginal, anal, or oral) (%)
Sexual Behavior - Males 18+ that ever had vaginal sex with a woman (%)
Sexual Behavior - Males 18+ that ever performed oral sex on a woman (%)
Sexual Behavior - Males 18+ that ever had anal sex with a woman (%)
Sexual Behavior - Males 18+ that ever had any sex with a man (%)
Sexual Behavior - Females 18+ that ever had vaginal sex with a man (%)
Sexual Behavior - Females 18+ that ever performed oral sex on a man (%)
Sexual Behavior - Females 18+ that ever had anal sex with a man (%)
Sexual Behavior - Females 18+ that ever had any kind of sex with a woman (%)
Sexual Behavior - Average age people first had sex
Sexual Behavior - Average number of female sex partners in lifetime (males 18+)
Sexual Behavior - Average number of female vaginal sex partners in lifetime (males 18+)
Sexual Behavior - Average age people first performed oral sex on a woman (18+)
Sexual Behavior - Average number of woman performed oral sex on in lifetime (18+)
Sexual Behavior - Average number of male sex partners in lifetime (males 18+)
Sexual Behavior - Average number of male anal sex partners in lifetime (males 18+)
Sexual Behavior - Average age people first performed oral sex on a man (18+)
Sexual Behavior - Average number of male oral sex partners in lifetime (18+)
Sexual Behavior - People using protection when performing oral sex (%)
Sexual Behavior - Average number of times people have vaginal or anal sex a year
Sexual Behavior - People having sex without condom (%)
Sexual Behavior - Average number of male sex partners in lifetime (females 18+)
Sexual Behavior - Average number of male vaginal sex partners in lifetime (females 18+)
Sexual Behavior - Average number of female sex partners in lifetime (females 18+)
Sexual Behavior - Circumcised males 18+ (%)
Sleep Disorders - Average hours sleeping at night
Sleep Disorders - People that has trouble sleeping (%)
Smoking-Cigarette Use - People smoking cigarettes (%)
Taste & Smell - People 40+ having problems with smell (%)
Taste & Smell - People 40+ having problems with taste (%)
Taste & Smell - People 40+ that ever had wisdom teeth removed (%)
Taste & Smell - People 40+ that ever had tonsils teeth removed (%)
Taste & Smell - People 40+ that ever had a loss of consciousness because of a head injury (%)
Taste & Smell - People 40+ that ever had a broken nose or other serious injury to face or skull (%)
Taste & Smell - People 40+ that ever had two or more sinus infections (%)
Weight - Average height (inches)
Weight - Average weight (pounds)
Weight - Average BMI
Weight - People that are obese (%)
Weight - People that ever were obese (%)
Weight - People trying to lose weight (%)
According to our research of Oklahoma and other state lists, there were 3 registered sex offenders living in Glenpool, Oklahoma as of May 21, 2024 . The ratio of all residents to sex offenders in Glenpool is 4,203 to 1.The ratio of registered sex offenders to all residents in this city is much lower than the state average.
Officers per 1,000 residents here:
1.67Oklahoma average:
2.27
Latest news from Glenpool, OK collected exclusively by city-data.com from local newspapers, TV, and radio stations
Ancestries: American (12.7%), English (10.4%), German (7.7%), Irish (4.7%), Polish (1.9%), European (1.2%).
Current Local Time:
Land area: 9.30 square miles.
Population density: 1,528 people per square mile (low).
722 residents are foreign born (2.3% Asia , 2.3% Latin America ).
This city:
5.2%Oklahoma:
6.1%
Median real estate property taxes paid for housing units with mortgages in 2022: $1,692 (0.9%)Median real estate property taxes paid for housing units with no mortgage in 2022: $1,425 (0.8%)
Nearest city with pop. 50,000+: Tulsa, OK
Nearest city with pop. 1,000,000+: Dallas, TX
Nearest cities:
Liberty, OK (2.6 miles),
Latitude: 35.95 N, Longitude: 96.00 W
Daytime population change due to commuting: -4,080 (-29.4%)Workers who live and work in this city: 1,195 (15.9%)
Area code commonly used in this area: 918
Single-family new house construction building permits:
2022: 69 buildings , average cost: $154,5002021: 87 buildings , average cost: $156,6002020: 76 buildings , average cost: $158,0002019: 31 buildings , average cost: $165,4002018: 20 buildings , average cost: $123,6002017: 80 buildings , average cost: $140,4002016: 101 buildings , average cost: $121,2002015: 135 buildings , average cost: $115,9002014: 80 buildings , average cost: $148,3002013: 82 buildings , average cost: $132,9002012: 64 buildings , average cost: $134,2002011: 48 buildings , average cost: $127,9002010: 103 buildings , average cost: $107,7002009: 122 buildings , average cost: $109,8002008: 142 buildings , average cost: $126,2002007: 147 buildings , average cost: $130,5002006: 112 buildings , average cost: $136,0002005: 79 buildings , average cost: $131,6002004: 89 buildings , average cost: $125,6002003: 93 buildings , average cost: $121,4002002: 24 buildings , average cost: $138,4002001: 10 buildings , average cost: $121,9002000: 13 buildings , average cost: $58,7001999: 22 buildings , average cost: $78,3001998: 42 buildings , average cost: $64,0001997: 71 buildings , average cost: $65,600Unemployment in December 2023:
Population change in the 1990s: +1,180 (+17.0%).
Most common occupations in Glenpool, OK (%)
Both Males Females
Other production occupations, including supervisors (4.3%)
Material recording, scheduling, dispatching, and distributing workers (4.2%)
Preschool, kindergarten, elementary, and middle school teachers (4.1%)
Other office and administrative support workers, including supervisors (3.6%)
Secretaries and administrative assistants (3.5%)
Information and record clerks, except customer service representatives (3.3%)
Retail sales workers, except cashiers (3.0%)
Other production occupations, including supervisors (6.7%)
Electrical equipment mechanics and other installation, maintenance, and repair workers, including supervisors (5.4%)
Vehicle and mobile equipment mechanics, installers, and repairers (5.0%)
Driver/sales workers and truck drivers (4.6%)
Metal workers and plastic workers (4.1%)
Top executives (3.9%)
Material recording, scheduling, dispatching, and distributing workers (3.9%)
Preschool, kindergarten, elementary, and middle school teachers (7.0%)
Secretaries and administrative assistants (7.0%)
Information and record clerks, except customer service representatives (7.0%)
Other office and administrative support workers, including supervisors (5.7%)
Child care workers (4.6%)
Material recording, scheduling, dispatching, and distributing workers (4.4%)
Registered nurses (4.2%)
Tornado activity:
Glenpool-area historical tornado activity is slightly above Oklahoma state average. It is 186% greater than the overall U.S. average.
On 5/5/1960, a category F5 (max. wind speeds 261-318 mph) tornado 7.9 miles away from the Glenpool city center killed 5 people and injured 81 people and caused between $500,000 and $5,000,000 in damages.
On 4/24/1993, a category F4 (max. wind speeds 207-260 mph) tornado 16.9 miles away from the city center killed 7 people and injured 100 people and caused between $5,000,000 and $50,000,000 in damages.
Earthquake activity:
Glenpool-area historical earthquake activity is significantly above Oklahoma state average. It is 803% greater than the overall U.S. average. On 9/3/2016 at 12:02:44, a magnitude 5.8 (5.8 MW, Depth: 3.5 mi, Class: Moderate, Intensity: VI - VII) earthquake occurred 61.3 miles away from the city center On 11/6/2011 at 03:53:10, a magnitude 5.7 (5.7 MW, Depth: 3.2 mi) earthquake occurred 51.6 miles away from Glenpool center On 11/7/2016 at 01:44:24, a magnitude 5.0 (5.0 MW, Depth: 2.8 mi) earthquake occurred 44.9 miles away from Glenpool center On 11/5/2011 at 07:12:45, a magnitude 4.8 (4.8 MW, Depth: 1.9 mi, Class: Light, Intensity: IV - V) earthquake occurred 50.9 miles away from the city center On 11/8/2011 at 02:46:57, a magnitude 4.8 (4.8 MW, Depth: 3.1 mi) earthquake occurred 52.8 miles away from Glenpool center On 2/13/2016 at 17:07:06, a magnitude 5.1 (5.1 MW, Depth: 5.2 mi) earthquake occurred 155.6 miles away from the city center Magnitude types: moment magnitude (MW) Natural disasters: The number of natural disasters in Tulsa County (34) is a lot greater than the US average (15).Major Disasters (Presidential) Declared: 22Emergencies Declared: 7Storms: 15, Floods: 14, Winter Storms: 9, Tornadoes: 8, Fires: 5, Heavy Rains: 2, Winds: 2, Hurricane: 1, Ice Storm: 1, Snow: 1, Snowstorm: 1, Other: 1 (Note: some incidents may be assigned to more than one category). Hospitals and medical centers in Glenpool: GLENNWOOD HEALTHCARE, INC (1700 EAST 141ST STREET)
Other hospitals and medical centers near Glenpool: THE GARDENS (Nursing Home, about 6 miles away; SAPULPA, OK)
RIVERSIDE HEALTH CARE CENTER I (Nursing Home, about 6 miles away; JENKS, OK)
GRACE LIVING CENTER-JENKS (Nursing Home, about 6 miles away; JENKS, OK)
RANCH TERRACE NURSING HOME, INC (Nursing Home, about 7 miles away; SAPULPA, OK)
ST JOHN-SAPULPA DIALYSIS (Dialysis Facility, about 7 miles away; SAPULPA, OK)
ST JOHN SAPULPA (about 7 miles away; SAPULPA, OK)
FAMILY HOME HEALTH (Home Health Center, about 7 miles away; SAPULPA, OK)
Amtrak station near Glenpool: 15 miles: TULSA (GREYHOUND STA., 317 S. DETROIT ST.) - Bus Station Colleges/universities with over 2000 students nearest to Glenpool:
Oral Roberts University (about 8 miles; Tulsa, OK ; Full-time enrollment: 3,216)
Tulsa Community College (about 13 miles; Tulsa, OK ; FT enrollment: 12,480)
University of Tulsa (about 15 miles; Tulsa, OK ; FT enrollment: 3,702)
Oklahoma State University Institute of Technology (about 23 miles; Okmulgee, OK ; FT enrollment: 3,243)
Rogers State University (about 33 miles; Claremore, OK ; FT enrollment: 3,482)
Northeastern State University (about 58 miles; Tahlequah, OK ; FT enrollment: 6,895)
Oklahoma State University-Main Campus (about 61 miles; Stillwater, OK ; FT enrollment: 21,700)
Public high school in Glenpool: GLENPOOL HS Students: 628, Location: 461 E 146TH ST, Grades: 9-12)Public elementary/middle schools in Glenpool: GLENPOOL ES Students: 1,232, Location: 461 E 146TH ST, Grades: PK-5)GLENPOOL MS Students: 499, Location: 461 E 146TH ST, Grades: 6-8)See full list of schools located in Glenpool Tulsa County has a predicted average indoor radon screening level less than 2 pCi/L (pico curies per liter) - Low Potential Drinking water stations with addresses in Glenpool and their reported violations in the past:
GLENPOOL WATER (Address: 503 W. 138TH ST Population served: 9,599, Purch surface water):
Past health violations:
MCL, Monthly (TCR) - In OCT-2008, Contaminant: Coliform. Follow-up actions: St Compliance achieved (NOV-01-2008), St Public Notif requested (NOV-21-2008), St Violation/Reminder Notice (NOV-21-2008)
MCL, Monthly (TCR) - In AUG-2007, Contaminant: Coliform. Follow-up actions: St Compliance achieved (SEP-01-2007), St Public Notif requested (SEP-26-2007), St Violation/Reminder Notice (SEP-26-2007)
Past monitoring violations:
Monitoring, Routine (IDSE) - Between FEB-2009 and APR-2009, Contaminant: TTHM. Follow-up actions: St Compliance achieved (MAY-08-2014)
Monitoring, Routine (IDSE) - Between FEB-2009 and APR-2009, Contaminant: Total Haloacetic Acids (HAA5). Follow-up actions: St Compliance achieved (MAY-08-2014)
Monitoring, Repeat Major (TCR) - In JUL-2008, Contaminant: Coliform (TCR). Follow-up actions: St Public Notif requested (AUG-25-2008), St Violation/Reminder Notice (AUG-25-2008), St Compliance achieved (NOV-01-2008)
Average household size: This city:
2.9 peopleOklahoma:
2.5 people
Percentage of family households: This city:
78.6%Whole state:
66.8%
Percentage of households with unmarried partners: This city:
6.1%Whole state:
5.9%
Likely homosexual households (counted as self-reported same-sex unmarried-partner households)
Lesbian couples: 0.5% of all households Gay men: 0.1% of all households
64 people in nursing facilities/skilled-nursing facilities in 2010people in nursing homes in 2000
Banks with branches in Glenpool (2011 data):
The City National Bank and Trust Company of Lawton, Oklahoma: Glenpool Branch at 12200 South Waco, branch established on 2008/05/07. Info updated 2006/11/03: Bank assets: $287.7 mil, Deposits: $245.8 mil, headquarters in Lawton, OK, positive income , Commercial Lending Specialization, 36 total offices , Holding Company: Jrmb Ii, Inc
BancFirst: Glenpool Branch at 394 East 141st Street, branch established on 1983/04/04. Info updated 2012/02/24: Bank assets: $5,407.8 mil, Deposits: $4,893.4 mil, headquarters in Oklahoma City, OK, positive income , Commercial Lending Specialization, 101 total offices , Holding Company: Bancfirst Corporation
American Heritage Bank: Glenpool Branch at 12120 South Vancouver Avenue, branch established on 2009/02/23. Info updated 2006/11/03: Bank assets: $752.5 mil, Deposits: $575.8 mil, headquarters in Sapulpa, OK, positive income , 16 total offices , Holding Company: American Bancorporation, Inc.
Citizens Security Bank & Trust Company: Glenpool Branch at East 141st Street, branch established on 1998/02/26. Info updated 2008/08/26: Bank assets: $637.2 mil, Deposits: $569.0 mil, headquarters in Bixby, OK, positive income , Commercial Lending Specialization, 13 total offices , Holding Company: Mabrey Bancorporation, Inc.
For population 15 years and over in Glenpool:
Never married: 29.4%Now married: 56.0%Separated: 1.4%Widowed: 3.0%Divorced: 10.1% For population 25 years and over in Glenpool:
High school or higher: 91.5%Bachelor's degree or higher: 25.3%Graduate or professional degree: 5.6%Unemployed: 3.1%Mean travel time to work (commute): 21.3 minutes
Education Gini index (Inequality in education) Here:
9.5Oklahoma average:
11.3
Religion statistics for Glenpool, OK (based on Tulsa County data)
Religion Adherents Congregations Evangelical Protestant 213,615 545 Mainline Protestant 85,250 103 Catholic 49,144 23 Other 17,310 49 Black Protestant 12,226 29 Orthodox 778 5 None 225,080 -
Source: Clifford Grammich, Kirk Hadaway, Richard Houseal, Dale E.Jones, Alexei Krindatch, Richie Stanley and Richard H.Taylor. 2012. 2010 U.S.Religion Census: Religious Congregations & Membership Study. Association of Statisticians of American Religious Bodies. Jones, Dale E., et al. 2002. Congregations and Membership in the United States 2000. Nashville, TN: Glenmary Research Center. Graphs represent county-level data
Food Environment Statistics: Number of grocery stores : 88This county :
1.51 / 10,000 pop.Oklahoma :
1.97 / 10,000 pop.
Number of supercenters and club stores : 9Here :
0.15 / 10,000 pop.Oklahoma :
0.20 / 10,000 pop.
Number of convenience stores (no gas) : 30Tulsa County :
0.51 / 10,000 pop.Oklahoma :
0.76 / 10,000 pop.
Number of convenience stores (with gas) : 166Tulsa County :
2.84 / 10,000 pop.Oklahoma :
4.35 / 10,000 pop.
Number of full-service restaurants : 489This county :
8.37 / 10,000 pop.State :
6.89 / 10,000 pop.
Adult diabetes rate : This county :
9.4%State :
10.3%
Adult obesity rate : This county :
27.3%State :
29.2%
Health and Nutrition: Healthy diet rate : Glenpool:
47.0%Oklahoma:
48.6%
Average overall health of teeth and gums : This city:
44.9%Oklahoma:
45.2%
Average BMI : This city:
28.9Oklahoma:
28.7
People feeling badly about themselves : Glenpool:
24.0%Oklahoma:
21.4%
People not drinking alcohol at all : This city:
10.3%Oklahoma:
10.8%
Average hours sleeping at night : Overweight people : Glenpool:
33.2%Oklahoma:
33.9%
General health condition : Glenpool:
56.2%Oklahoma:
55.2%
Average condition of hearing : This city:
80.8%Oklahoma:
78.4%
More about Health and Nutrition of Glenpool, OK Residents
Local government employment and payroll (March 2022)
Function
Full-time employees
Monthly full-time payroll
Average yearly full-time wage
Part-time employees
Monthly part-time payroll
Police Protection - Officers
25 $148,266 $71,168 0 $0 Firefighters
24 $154,198 $77,099 6 $1,384 Police - Other
8 $25,081 $37,622 0 $0 Sewerage
7 $24,052 $41,232 0 $0 Other and Unallocable
6 $27,849 $55,698 0 $0 Other Government Administration
4 $35,327 $105,981 0 $0 Housing and Community Development (Local)
4 $24,552 $73,656 0 $0 Water Supply
3 $10,458 $41,832 1 $1,521 Streets and Highways
3 $9,672 $38,688 0 $0 Parks and Recreation
3 $9,672 $38,688 0 $0 Financial Administration
3 $15,509 $62,036 0 $0 Judicial and Legal
1 $7,170 $86,040 0 $0
Totals for Government
91 $491,806 $64,854 7 $2,905
Glenpool government finances - Expenditure in 2021 (per resident):
Current Operations - Local Fire Protection: $3,145,000 ($221.31)
Water Utilities: $3,120,000 ($219.55)Police Protection: $3,057,000 ($215.12)Central Staff Services: $2,936,000 ($206.60)Solid Waste Management: $794,000 ($55.87)Regular Highways: $573,000 ($40.32)General - Interest on Debt: $1,439,000 ($101.26)
Other Capital Outlay - Regular Highways: $808,000 ($56.86)
Police Protection: $313,000 ($22.03)Central Staff Services: $69,000 ($4.86)Local Fire Protection: $62,000 ($4.36)Water Utilities - Interest on Debt: $10,000 ($0.70)
Glenpool government finances - Revenue in 2021 (per resident):
Charges - Miscellaneous Commercial Activities: $2,357,000 ($165.86)
Other: $1,405,000 ($98.87)Sewerage: $1,393,000 ($98.02)Solid Waste Management: $822,000 ($57.84)Miscellaneous - Fines and Forfeits: $161,000 ($11.33)
General Revenue - Other: $96,000 ($6.76)Rents: $40,000 ($2.81)Interest Earnings: $7,000 ($0.49)Revenue - Water Utilities: $3,216,000 ($226.30)
State Intergovernmental - General Local Government Support: $674,000 ($47.43)
Highways: $151,000 ($10.63)Tax - General Sales and Gross Receipts: $12,572,000 ($884.67)
Public Utilities Sales: $456,000 ($32.09)Other License: $242,000 ($17.03)Other Selective Sales: $215,000 ($15.13)Other: $120,000 ($8.44)
Glenpool government finances - Debt in 2021 (per resident):
Long Term Debt - Beginning Outstanding - Unspecified Public Purpose: $45,829,000 ($3224.90)
Outstanding Unspecified Public Purpose: $43,241,000 ($3042.78)Retired Unspecified Public Purpose: $2,861,000 ($201.32)Issue, Unspecified Public Purpose: $273,000 ($19.21)
6.72% of this county's 2021 resident taxpayers lived in other counties in 2020 ($57,121 average adjusted gross income )
Here:
6.72%Oklahoma average:
8.28%
0.01% of residents moved from foreign countries ($143 average AGI )Tulsa County:
0.01%Oklahoma average:
0.04%
Top counties from which taxpayers relocated into this county between 2020 and 2021:
6.70% of this county's 2020 resident taxpayers moved to other counties in 2021 ($60,995 average adjusted gross income )
Here:
6.70%Oklahoma average:
7.66%
0.01% of residents moved to foreign countries ($93 average AGI )Tulsa County:
0.01%Oklahoma average:
0.03%
Top counties to which taxpayers relocated from this county between 2020 and 2021:
Businesses in Glenpool, OK
Name Count Name Count
Arby's 1 SONIC Drive-In 1 Best Western 1 Subway 2 Comfort Inn 1 U-Haul 1 FedEx 2 UPS 1 H&R Block 1 Walmart 1 McDonald's 1
Strongest AM radio stations in Glenpool:
KRMG (740 AM; 50 kW; TULSA, OK; Owner: CXR HOLDINGS, INC.)
KFAQ (1170 AM; 50 kW; TULSA, OK; Owner: JOURNAL BROADCAST CORPORATION)
KAKC (1300 AM; 5 kW; TULSA, OK; Owner: CLEAR CHANNEL BROADCASTING LICENSES, INC.)
KTBZ (1430 AM; 25 kW; TULSA, OK; Owner: CLEAR CHANNEL BROADCASTING LICENSES, INC.)
KYAL (1550 AM; 2 kW; SAPULPA, OK; Owner: KXOJ, INC.)
KMUS (1380 AM; 20 kW; MUSKOGEE, OK; Owner: ABC, INC.)
KCFO (970 AM; 2 kW; TULSA, OK; Owner: FRIENDSHIP BROADCASTING, L. P.)
KGTO (1050 AM; 1 kW; TULSA, OK; Owner: KJMM, INC.)
KXTD (1530 AM; daytime; 5 kW; WAGONER, OK; Owner: GAYTAN-GALVAN LIMITED LIABILITY COMP)
KOMA (1520 AM; 50 kW; OKLAHOMA CITY, OK; Owner: RENDA BROADCASTING CORP. OF NEVADA)
KTFX (1340 AM; 1 kW; SAND SPRINGS, OK; Owner: K95.5, INC.)
KGGF (690 AM; 10 kW; COFFEYVILLE, KS; Owner: KGGF-KUSN, INC.)
KOKL (1240 AM; 1 kW; OKMULGEE, OK; Owner: REGENCY RADIO, INC.)
Strongest FM radio stations in Glenpool:
KJMM (105.3 FM; BIXBY, OK; Owner: KJMM, INC.)
KXBL (99.5 FM; HENRYETTA, OK; Owner: JOURNAL BROADCAST CORPORATION)
KTSO (94.1 FM; OKMULGEE, OK; Owner: SHAMROCK COMMUNICATIONS, INC)
KNYD (90.5 FM; BROKEN ARROW, OK; Owner: CREATIVE EDUCATIONAL MEDIA CORP. INC)
KBEZ (92.9 FM; TULSA, OK; Owner: RENDA BROADCASTING CORP. OF NEVADA)
KHTT (106.9 FM; MUSKOGEE, OK; Owner: RENDA BROADCASTING CORP. OF NEVADA)
KMOD-FM (97.5 FM; TULSA, OK; Owner: CLEAR CHANNEL BROADCASTING LICENSES, INC.)
KRAV-FM (96.5 FM; TULSA, OK; Owner: CXR HOLDINGS, INC.)
KWEN (95.5 FM; TULSA, OK; Owner: CXR HOLDINGS, INC.)
KVOO-FM (98.5 FM; TULSA, OK; Owner: JOURNAL BROADCAST CORPORATION)
KIZS (92.1 FM; BROKEN ARROW, OK; Owner: CLEAR CHANNEL BROADCASTING LICENSES, INC.)
KJSR (103.3 FM; TULSA, OK; Owner: CXR HOLDINGS, INC.)
KWGS (89.5 FM; TULSA, OK; Owner: THE UNIVERSITY OF TULSA)
KMYZ-FM (104.5 FM; PRYOR, OK; Owner: SHAMROCK COMMUNICATIONS, INC.)
KXOJ-FM (100.9 FM; SAPULPA, OK; Owner: KXOJ, INC.)
KRTQ (102.3 FM; SAND SPRINGS, OK; Owner: CXR HOLDINGS, INC.)
KQCV-FM (95.1 FM; SHAWNEE, OK; Owner: COMMUNITY BROADCASTING, INC)
KQLL-FM (106.1 FM; OWASSO, OK; Owner: CLEAR CHANNEL BROADCASTING LICENSES, INC.)
KTBT (101.5 FM; COLLINSVILLE, OK; Owner: CLEAR CHANNEL BROADCASTING LICENSES, INC.)
TV broadcast stations around Glenpool:
KGEB (Channel 53; TULSA, OK; Owner: UNIVERSITY BROADCASTING, INC.)
KTPX (Channel 44; OKMULGEE, OK; Owner: PAXSON TULSA LICENSE, INC.)
KJRH (Channel 2; TULSA, OK; Owner: SCRIPPS HOWARD BROADCASTING COMPANY)
KOED-TV (Channel 11; TULSA, OK; Owner: OKLAHOMA EDUCATIONAL TELEVISION AUTHORITY)
KOTV (Channel 6; TULSA, OK; Owner: GRIFFIN LICENSING, L.L.C.)
KWHB (Channel 47; TULSA, OK; Owner: LESEA BROADCASTING CORPORATION)
KTUL (Channel 8; TULSA, OK; Owner: KTUL, LLC)
KTFO (Channel 41; TULSA, OK; Owner: CLEAR CHANNEL BROADCASTING LICENSES, INC.)
KOKI-TV (Channel 23; TULSA, OK; Owner: CLEAR CHANNEL BROADCASTING LICENSES, INC.)
K39CW (Channel 39; TULSA, OK; Owner: VENTANA TELEVISION, INC.)
KTZT-LP (Channel 29; TULSA, OK; Owner: ARACELIS ORTIZ, EXECUTRIX OF THE ESTATE OF CARLOS ORTIZ)
KOPE-LP (Channel 51; TULSA, OK; Owner: COPELAND BROADCASTING CORPORATION)
KWBT (Channel 19; MUSKOGEE, OK; Owner: TULSA COMMUNICATIONS, L.L.C.)
KLOT-LP (Channel 25; TULSA, OK; Owner: EQUITY BROADCASTING CORPORATION)
K15DA (Channel 15; TULSA, OK; Owner: LOCKE SUPPLY CO.)
K69GO (Channel 69; TULSA, OK; Owner: THREE ANGELS BROADCASTING NETWORK)
KDOR (Channel 17; BARTLESVILLE, OK; Owner: TRINITY BROADCASTING NETWORK)
KRSC-TV (Channel 35; CLAREMORE, OK; Owner: BOARD OF REGENTS OF OKLAHOMA COLLEGES)
K33EK (Channel 33; TULSA, OK; Owner: LOCKE SUPPLY CO.)
K04NZ (Channel 4; TULSA, OK; Owner: GERALD BROTHERS)
National Bridge Inventory (NBI) Statistics 11 Number of bridges85ft / 25.6m Total length $7,817,000 Total costs64,394 Total average daily traffic9,574 Total average daily truck traffic
New bridges - historical statistics
6 1990-1999 1 2000-2009 4 2010-2019
See full National Bridge Inventory statistics for Glenpool, OK
FCC Registered Cell Phone Towers: 2 (
See the full list of FCC Registered Cell Phone Towers in Glenpool )
FCC Registered Antenna Towers: 58 (
See the full list of FCC Registered Antenna Towers )
FCC Registered Broadcast Land Mobile Towers: 6
14522 S Broadway (Lat: 35.958417 Lon: -96.008611), Call Sign: KNGM516, Licensee ID: L00067332, Assigned Frequencies: 155.490 MHz, 155.655 MHz, 155.670 MHz, Grant Date: 02/09/1998, Expiration Date: 04/28/2003, Cancellation Date: 08/03/2003, Registrant: City Of Glenpool, 14522 S Broadway, Glenpool, OK 74033 Lat: 35.951556 Lon: -96.001639, Call Sign: WQAA334, Licensee ID: L00067554, Assigned Frequencies: 72.2600 MHz, 72.4000 MHz, 72.1800 MHz, Grant Date: 04/22/2014, Expiration Date: 04/20/2024, Certifier: Johnny Barnes, Registrant: Glenpool Public Schools110 W 141st Street (Lat: 35.959167 Lon: -96.010833), Call Sign: WQAE320, Assigned Frequencies: 469.212 MHz, 469.037 MHz, 469.237 MHz, 469.062 MHz, 469.262 MHz, 469.087 MHz, 469.287 MHz, 469.112 MHz, 469.312 MHz, 469.137 MHz... (+21 more), Grant Date: 05/14/2004, Expiration Date: 05/14/2014, Cancellation Date: 07/19/2014, Certifier: Kevin R Hern, Registrant: Panasonic Digital Communications & Security Co, 1707 N Randall Rd E1-D9, Elgin, IL 60123-7847, Phone: (847) 468-5318, Fax: (847) 468-5331, Email:
33 W 141st St (Lat: 35.959444 Lon: -96.009167), Call Sign: WQJP929, Licensee ID: L01442254, Assigned Frequencies: 469.012 MHz, 464.037 MHz, 469.037 MHz, 464.062 MHz, 469.062 MHz, 464.087 MHz, 469.087 MHz, 464.112 MHz, 469.112 MHz, 464.137 MHz... (+21 more), Grant Date: 11/20/2008, Expiration Date: 11/20/2018, Cancellation Date: 02/16/2019, Certifier: Victor J Herbert, Registrant: Peedle Inc Dba Taco Mayo #94, 33 W 141st St, Glenpool, OK 74033-0052, Phone: (918) 291-8226, Email:
Lat: 35.964444 Lon: -96.013500, Call Sign: WQMZ516, Assigned Frequencies: 462.412 MHz, Grant Date: 09/23/2020, Expiration Date: 11/16/2030, Certifier: Barney Mc Intosh, Registrant: City Of Glenpool, 12205 S. Yukon Ave., Glenpool, OK 74033, Phone: (918) 322-2172, Fax: (918) 322-2216, Email:
Corner Of 141st & Elewood, (Lat: 35.961917 Lon: -95.992389), Call Sign: WRYE535, Assigned Frequencies: 462.187 MHz, 452.837 MHz, 452.887 MHz, 451.362 MHz, 452.087 MHz, 452.787 MHz, Grant Date: 08/01/2023, Expiration Date: 08/01/2033, Certifier: Matt Hilburn, Registrant: Wireless Technologies, Inc., 3158 S. 108th E. Ave, Ste 270, Tulsa, OK 74146, Phone: (918) 232-1954, Email:
FCC Registered Microwave Towers: 7
BIXBY, 3 Mi Se Of Glenpool (Lat: 35.933167 Lon: -95.962222), Type: Tower, Structure height: 36.6 m, Overall height: 42.7 m, Call Sign: WMS230, Assigned Frequencies: 6286.19 MHz, 6625.00 MHz, 6226.89 MHz, 6655.00 MHz, Grant Date: 03/23/2021, Expiration Date: 02/01/2031, Certifier: Steven T Campbell, Registrant: Wilkinson Barker Knauer, LLP, 1800 M Street Nw, Suite 800n, Washington, DC 20036, Phone: (202) 383-3420, Fax: (202) 783-5851, Email:
GLENPOOL, 1/4 West 141 Street & Peoria (Lat: 35.958333 Lon: -95.978056), Type: Tank, Structure height: 38 m, Call Sign: WQEL357, Assigned Frequencies: 942.175 MHz, Grant Date: 12/03/2015, Expiration Date: 02/27/2026, Certifier: Don Catlett, Registrant: Tteltac, Jenks, OK 74037, Phone: (918) 633-6615, Email:
Glenpool, Lat: 35.967361 Lon: -96.037694, Type: Gtower, Structure height: 69.5 m, Call Sign: WQJG241, Assigned Frequencies: 3650.00 MHz, Grant Date: 09/13/2018, Expiration Date: 10/17/2020, Cancellation Date: 12/19/2020, Certifier: Samual T Curtis, Registrant: @link Services, LLC, 13431 Broadway Ext., Ste. 120, Oklahoma City, OK 73114, Phone: (405) 753-7151, Fax: (888) 207-1804, Email:
GLENPOOL, Lat: 35.959056 Lon: -96.009806, Call Sign: WQKY403, Assigned Frequencies: 956.393 MHz, Grant Date: 10/26/2009, Expiration Date: 10/26/2019, Cancellation Date: 12/28/2019, Certifier: Susan M White, Registrant: Sensus, 450 N Gallatin Avenue, Uniontown, PA 15401, Phone: (800) 638-3748, Fax: (800) 888-2403, Email:
Cap Station 348237, Lat: 35.944833 Lon: -95.991250, Type: Upole, Structure height: 9.1 m, Call Sign: WQLG431, Assigned Frequencies: 3650.00 MHz, Grant Date: 01/13/2010, Expiration Date: 01/31/2019, Cancellation Date: 04/06/2019, Certifier: John P Grunsted, Registrant: Og&e, Oklahoma City, OK 73101, Phone: (405) 553-2417, Email:
TU02544A, 75 East 151st Street (Tu02544a) (Lat: 35.945861 Lon: -96.006528), Type: Mtower, Structure height: 48.8 m, Call Sign: WQVQ841, Assigned Frequencies: 11015.0 MHz, 11015.0 MHz, 11015.0 MHz, 11015.0 MHz, 11015.0 MHz, 11015.0 MHz, 11015.0 MHz, 11015.0 MHz, 11015.0 MHz, 11015.0 MHz... (+8 more), Grant Date: 04/17/2015, Expiration Date: 04/17/2025, Cancellation Date: 03/18/2024, Certifier: David Werblow, Registrant: T-Mobile Usa, Inc., 12920 Se 38th Street, Bellevue, WA 98006, Phone: (425) 383-8401, Fax: (425) 383-4040, Email:
Glenpool Tower, 0.73 Miles Nw Of Intersection Of 141st St And S 33rd W Ave (Lat: 35.967361 Lon: -96.037694), Type: Gtower, Structure height: 67.1 m, Overall height: 69.5 m, Call Sign: WRMG311, Assigned Frequencies: 10755.0 MHz, 10755.0 MHz, 10755.0 MHz, 10755.0 MHz, 10755.0 MHz, 10755.0 MHz, 10755.0 MHz, 10755.0 MHz, 10755.0 MHz, 10755.0 MHz... (+10 more), Grant Date: 04/05/2021, Expiration Date: 04/05/2031, Certifier: Samual T Curtis, Registrant: Micronet Communications, Inc., 812 Lexington Dr, Plano, TX 75075, Phone: (972) 422-7200, Email:
FCC Registered Amateur Radio Licenses: 62 (
See the full list of FCC Registered Amateur Radio Licenses in Glenpool )
FAA Registered Aircraft: 8 (
See the full list of FAA Registered Aircraft in Glenpool )
Home Mortgage Disclosure Act Aggregated Statistics For Year 2009(Based on 2 partial tracts) A) FHA, FSA/RHS & VA B) Conventional C) Refinancings D) Home Improvement Loans F) Non-occupant Loans on G) Loans On Manufactured Number Average Value Number Average Value Number Average Value Number Average Value Number Average Value Number Average Value
LOANS ORIGINATED 144 $137,659 49 $150,560 187 $134,737 25 $44,149 20 $186,352 6 $74,218 APPLICATIONS APPROVED, NOT ACCEPTED 11 $157,785 5 $168,530 24 $132,423 0 $0 2 $94,975 2 $57,305 APPLICATIONS DENIED 15 $136,295 8 $65,999 63 $131,794 13 $22,909 3 $85,250 5 $77,378 APPLICATIONS WITHDRAWN 9 $135,596 4 $108,448 61 $139,402 5 $49,906 2 $45,400 3 $72,883 FILES CLOSED FOR INCOMPLETENESS 2 $191,815 1 $186,770 12 $116,297 2 $10,610 1 $81,500 1 $2,650
Aggregated Statistics For Year 2008(Based on 2 partial tracts) A) FHA, FSA/RHS & VA B) Conventional C) Refinancings D) Home Improvement Loans F) Non-occupant Loans on G) Loans On Manufactured Number Average Value Number Average Value Number Average Value Number Average Value Number Average Value Number Average Value
LOANS ORIGINATED 113 $135,785 88 $130,939 109 $125,852 30 $52,457 22 $67,264 2 $42,120 APPLICATIONS APPROVED, NOT ACCEPTED 5 $133,048 10 $108,456 21 $102,903 4 $23,888 2 $65,565 2 $79,590 APPLICATIONS DENIED 8 $131,588 10 $111,497 98 $115,488 31 $50,289 8 $84,022 4 $87,640 APPLICATIONS WITHDRAWN 9 $142,337 10 $150,256 37 $129,407 4 $141,082 1 $104,000 2 $97,100 FILES CLOSED FOR INCOMPLETENESS 0 $0 1 $114,080 7 $146,386 1 $8,860 0 $0 1 $32,740
Aggregated Statistics For Year 2007(Based on 2 partial tracts) A) FHA, FSA/RHS & VA B) Conventional C) Refinancings D) Home Improvement Loans E) Loans on Dwellings For 5+ Families F) Non-occupant Loans on G) Loans On Manufactured Number Average Value Number Average Value Number Average Value Number Average Value Number Average Value Number Average Value Number Average Value
LOANS ORIGINATED 54 $118,559 190 $103,122 108 $100,756 28 $57,794 1 $361,540 26 $70,268 11 $69,156 APPLICATIONS APPROVED, NOT ACCEPTED 2 $92,060 12 $117,805 18 $116,835 1 $17,720 0 $0 2 $179,080 2 $52,000 APPLICATIONS DENIED 4 $78,362 26 $91,185 148 $116,767 34 $38,644 0 $0 7 $91,947 8 $80,448 APPLICATIONS WITHDRAWN 3 $100,037 9 $112,534 64 $118,342 10 $56,314 0 $0 2 $176,425 2 $56,245 FILES CLOSED FOR INCOMPLETENESS 1 $101,880 4 $62,778 10 $126,836 1 $15,050 0 $0 0 $0 0 $0
Aggregated Statistics For Year 2006(Based on 2 partial tracts) A) FHA, FSA/RHS & VA B) Conventional C) Refinancings D) Home Improvement Loans F) Non-occupant Loans on G) Loans On Manufactured Number Average Value Number Average Value Number Average Value Number Average Value Number Average Value Number Average Value
LOANS ORIGINATED 38 $107,711 194 $92,233 111 $86,215 34 $33,468 27 $64,355 4 $82,838 APPLICATIONS APPROVED, NOT ACCEPTED 1 $205,170 23 $77,651 20 $112,859 6 $61,520 8 $66,546 5 $89,258 APPLICATIONS DENIED 4 $85,665 59 $70,406 125 $92,870 28 $41,718 8 $85,804 10 $72,608 APPLICATIONS WITHDRAWN 1 $84,160 28 $92,150 100 $108,812 11 $53,878 5 $87,542 0 $0 FILES CLOSED FOR INCOMPLETENESS 0 $0 11 $93,171 21 $112,968 1 $127,570 0 $0 0 $0
Aggregated Statistics For Year 2005(Based on 2 partial tracts) A) FHA, FSA/RHS & VA B) Conventional C) Refinancings D) Home Improvement Loans F) Non-occupant Loans on G) Loans On Manufactured Number Average Value Number Average Value Number Average Value Number Average Value Number Average Value Number Average Value
LOANS ORIGINATED 42 $105,497 161 $86,708 137 $91,397 36 $60,359 30 $80,204 10 $67,672 APPLICATIONS APPROVED, NOT ACCEPTED 2 $71,630 18 $81,313 31 $104,428 2 $42,590 4 $82,508 4 $74,032 APPLICATIONS DENIED 1 $87,550 54 $111,945 174 $90,380 35 $39,744 7 $54,671 18 $52,348 APPLICATIONS WITHDRAWN 1 $110,900 24 $107,447 150 $93,459 21 $87,983 4 $100,348 3 $87,060 FILES CLOSED FOR INCOMPLETENESS 1 $74,420 2 $99,110 19 $94,300 3 $24,733 1 $106,600 0 $0
Aggregated Statistics For Year 2004(Based on 2 partial tracts) A) FHA, FSA/RHS & VA B) Conventional C) Refinancings D) Home Improvement Loans E) Loans on Dwellings For 5+ Families F) Non-occupant Loans on G) Loans On Manufactured Number Average Value Number Average Value Number Average Value Number Average Value Number Average Value Number Average Value Number Average Value
LOANS ORIGINATED 21 $98,845 147 $90,696 182 $91,033 25 $45,166 1 $331,630 22 $73,327 8 $52,436 APPLICATIONS APPROVED, NOT ACCEPTED 2 $87,815 16 $87,098 46 $97,748 1 $19,630 0 $0 5 $96,436 4 $57,928 APPLICATIONS DENIED 5 $98,456 46 $73,905 166 $93,301 38 $28,385 0 $0 8 $96,266 22 $57,727 APPLICATIONS WITHDRAWN 7 $90,286 18 $76,581 98 $88,206 6 $38,568 0 $0 7 $78,357 1 $126,810 FILES CLOSED FOR INCOMPLETENESS 0 $0 3 $163,410 18 $106,564 2 $17,720 0 $0 0 $0 1 $142,200
Aggregated Statistics For Year 2003(Based on 2 partial tracts) A) FHA, FSA/RHS & VA B) Conventional C) Refinancings D) Home Improvement Loans F) Non-occupant Loans on Number Average Value Number Average Value Number Average Value Number Average Value Number Average Value
LOANS ORIGINATED 40 $89,831 103 $88,862 331 $86,504 18 $29,797 17 $69,907 APPLICATIONS APPROVED, NOT ACCEPTED 2 $80,385 16 $78,434 54 $83,330 2 $23,355 2 $82,815 APPLICATIONS DENIED 2 $124,605 42 $73,409 212 $87,768 14 $17,881 5 $103,926 APPLICATIONS WITHDRAWN 3 $81,940 15 $86,481 120 $91,471 4 $13,052 1 $61,130 FILES CLOSED FOR INCOMPLETENESS 1 $132,600 5 $82,714 13 $74,372 2 $31,340 0 $0
Aggregated Statistics For Year 2002(Based on 2 partial tracts) A) FHA, FSA/RHS & VA B) Conventional C) Refinancings D) Home Improvement Loans E) Loans on Dwellings For 5+ Families F) Non-occupant Loans on Number Average Value Number Average Value Number Average Value Number Average Value Number Average Value Number Average Value
LOANS ORIGINATED 47 $83,793 83 $89,071 242 $90,698 24 $35,707 1 $90,200 17 $96,493 APPLICATIONS APPROVED, NOT ACCEPTED 1 $102,540 16 $61,544 49 $79,030 4 $18,002 0 $0 2 $123,145 APPLICATIONS DENIED 7 $70,723 38 $76,315 126 $78,513 19 $10,643 0 $0 2 $81,180 APPLICATIONS WITHDRAWN 3 $74,477 13 $79,440 91 $87,621 3 $11,970 0 $0 1 $118,320 FILES CLOSED FOR INCOMPLETENESS 1 $88,590 5 $86,228 23 $79,081 0 $0 0 $0 2 $76,165
Aggregated Statistics For Year 2001(Based on 2 partial tracts) A) FHA, FSA/RHS & VA B) Conventional C) Refinancings D) Home Improvement Loans E) Loans on Dwellings For 5+ Families F) Non-occupant Loans on Number Average Value Number Average Value Number Average Value Number Average Value Number Average Value Number Average Value
LOANS ORIGINATED 69 $81,113 92 $83,436 198 $84,421 33 $22,912 1 $242,480 24 $51,993 APPLICATIONS APPROVED, NOT ACCEPTED 2 $113,650 19 $66,057 25 $76,037 3 $23,117 0 $0 3 $49,347 APPLICATIONS DENIED 3 $71,613 36 $63,541 142 $65,381 23 $15,549 0 $0 5 $94,640 APPLICATIONS WITHDRAWN 4 $97,838 9 $97,540 102 $72,427 8 $14,275 0 $0 2 $42,910 FILES CLOSED FOR INCOMPLETENESS 0 $0 1 $58,370 11 $86,500 0 $0 0 $0 1 $30,770
Aggregated Statistics For Year 2000(Based on 2 partial tracts) A) FHA, FSA/RHS & VA B) Conventional C) Refinancings D) Home Improvement Loans E) Loans on Dwellings For 5+ Families F) Non-occupant Loans on Number Average Value Number Average Value Number Average Value Number Average Value Number Average Value Number Average Value
LOANS ORIGINATED 42 $79,348 86 $76,723 78 $65,691 32 $22,038 1 $91,250 13 $51,181 APPLICATIONS APPROVED, NOT ACCEPTED 6 $84,183 23 $60,672 19 $53,964 10 $23,612 0 $0 0 $0 APPLICATIONS DENIED 3 $64,027 69 $51,941 70 $58,804 36 $15,276 0 $0 2 $31,570 APPLICATIONS WITHDRAWN 4 $87,878 11 $74,336 45 $66,689 2 $31,840 0 $0 1 $72,690 FILES CLOSED FOR INCOMPLETENESS 1 $59,360 10 $77,704 7 $62,767 0 $0 0 $0 1 $28,650
Aggregated Statistics For Year 1999(Based on 1 full and 1 partial tracts) A) FHA, FSA/RHS & VA B) Conventional C) Refinancings D) Home Improvement Loans F) Non-occupant Loans on Number Average Value Number Average Value Number Average Value Number Average Value Number Average Value
LOANS ORIGINATED 86 $74,448 101 $70,408 147 $68,065 33 $15,262 12 $42,138 APPLICATIONS APPROVED, NOT ACCEPTED 1 $85,360 28 $53,529 35 $57,548 12 $15,629 3 $31,507 APPLICATIONS DENIED 2 $70,965 91 $50,968 102 $52,984 41 $20,228 4 $46,455 APPLICATIONS WITHDRAWN 6 $72,605 22 $71,835 56 $61,406 4 $31,582 1 $24,740 FILES CLOSED FOR INCOMPLETENESS 4 $78,568 5 $73,054 19 $56,291 1 $28,780 0 $0
Detailed HMDA statistics for the following Tracts:
0077.01
, 0077.02
Private Mortgage Insurance Companies Aggregated Statistics For Year 2009(Based on 2 partial tracts) A) Conventional B) Refinancings C) Non-occupant Loans on Number Average Value Number Average Value Number Average Value
LOANS ORIGINATED 7 $215,447 11 $140,449 0 $0 APPLICATIONS APPROVED, NOT ACCEPTED 4 $143,768 2 $268,610 1 $31,890 APPLICATIONS DENIED 0 $0 1 $275,380 0 $0 APPLICATIONS WITHDRAWN 0 $0 2 $184,385 0 $0 FILES CLOSED FOR INCOMPLETENESS 0 $0 0 $0 0 $0
Aggregated Statistics For Year 2008(Based on 2 partial tracts) A) Conventional B) Refinancings C) Non-occupant Loans on Number Average Value Number Average Value Number Average Value
LOANS ORIGINATED 34 $157,509 14 $135,678 4 $88,000 APPLICATIONS APPROVED, NOT ACCEPTED 14 $137,893 6 $127,307 0 $0 APPLICATIONS DENIED 1 $288,740 2 $145,565 1 $248,150 APPLICATIONS WITHDRAWN 1 $43,510 0 $0 0 $0 FILES CLOSED FOR INCOMPLETENESS 1 $93,390 0 $0 0 $0
Aggregated Statistics For Year 2007(Based on 2 partial tracts) A) Conventional B) Refinancings C) Non-occupant Loans on Number Average Value Number Average Value Number Average Value
LOANS ORIGINATED 55 $133,001 19 $105,637 2 $88,940 APPLICATIONS APPROVED, NOT ACCEPTED 5 $125,390 2 $160,235 0 $0 APPLICATIONS DENIED 3 $102,937 0 $0 0 $0 APPLICATIONS WITHDRAWN 2 $133,065 1 $129,470 1 $40,860 FILES CLOSED FOR INCOMPLETENESS 1 $106,310 0 $0 0 $0
Aggregated Statistics For Year 2006(Based on 2 partial tracts) A) Conventional B) Refinancings C) Non-occupant Loans on Number Average Value Number Average Value Number Average Value
LOANS ORIGINATED 44 $113,608 11 $123,101 4 $64,287 APPLICATIONS APPROVED, NOT ACCEPTED 4 $143,680 4 $106,282 1 $65,560 APPLICATIONS DENIED 0 $0 0 $0 0 $0 APPLICATIONS WITHDRAWN 1 $33,430 2 $120,325 1 $65,560 FILES CLOSED FOR INCOMPLETENESS 0 $0 0 $0 0 $0
Aggregated Statistics For Year 2005(Based on 2 partial tracts) A) Conventional B) Refinancings C) Non-occupant Loans on Number Average Value Number Average Value Number Average Value
LOANS ORIGINATED 23 $107,999 16 $91,644 6 $82,672 APPLICATIONS APPROVED, NOT ACCEPTED 4 $84,598 4 $98,138 0 $0 APPLICATIONS DENIED 0 $0 0 $0 0 $0 APPLICATIONS WITHDRAWN 1 $141,800 1 $116,050 0 $0 FILES CLOSED FOR INCOMPLETENESS 0 $0 1 $111,620 0 $0
Aggregated Statistics For Year 2004(Based on 2 partial tracts) A) Conventional B) Refinancings C) Non-occupant Loans on D) Loans On Manufactured Number Average Value Number Average Value Number Average Value Number Average Value
LOANS ORIGINATED 33 $102,889 20 $90,088 2 $107,155 1 $51,470 APPLICATIONS APPROVED, NOT ACCEPTED 2 $96,110 8 $111,609 0 $0 0 $0 APPLICATIONS DENIED 0 $0 1 $114,610 0 $0 0 $0 APPLICATIONS WITHDRAWN 2 $138,140 1 $87,700 0 $0 0 $0 FILES CLOSED FOR INCOMPLETENESS 0 $0 0 $0 0 $0 0 $0
Aggregated Statistics For Year 2003(Based on 2 partial tracts) A) Conventional B) Refinancings C) Non-occupant Loans on Number Average Value Number Average Value Number Average Value
LOANS ORIGINATED 25 $101,032 59 $90,571 4 $62,815 APPLICATIONS APPROVED, NOT ACCEPTED 2 $63,820 15 $98,695 0 $0 APPLICATIONS DENIED 1 $37,140 1 $117,790 0 $0 APPLICATIONS WITHDRAWN 1 $59,360 6 $77,225 1 $14,860 FILES CLOSED FOR INCOMPLETENESS 1 $61,130 0 $0 0 $0
Aggregated Statistics For Year 2002(Based on 2 partial tracts) A) Conventional B) Refinancings C) Non-occupant Loans on Number Average Value Number Average Value Number Average Value
LOANS ORIGINATED 40 $101,018 45 $97,816 2 $65,265 APPLICATIONS APPROVED, NOT ACCEPTED 6 $97,123 11 $89,149 1 $58,900 APPLICATIONS DENIED 1 $23,880 1 $99,220 0 $0 APPLICATIONS WITHDRAWN 1 $98,690 7 $76,419 2 $53,060 FILES CLOSED FOR INCOMPLETENESS 0 $0 0 $0 0 $0
Aggregated Statistics For Year 2001(Based on 2 partial tracts) A) Conventional B) Refinancings C) Non-occupant Loans on Number Average Value Number Average Value Number Average Value
LOANS ORIGINATED 39 $110,804 26 $89,279 0 $0 APPLICATIONS APPROVED, NOT ACCEPTED 6 $97,007 8 $88,886 1 $43,410 APPLICATIONS DENIED 1 $36,080 4 $63,120 0 $0 APPLICATIONS WITHDRAWN 0 $0 1 $37,670 0 $0 FILES CLOSED FOR INCOMPLETENESS 1 $152,280 2 $104,060 0 $0
Aggregated Statistics For Year 2000(Based on 2 partial tracts) A) Conventional B) Refinancings C) Non-occupant Loans on Number Average Value Number Average Value Number Average Value
LOANS ORIGINATED 27 $92,368 11 $78,385 3 $48,097 APPLICATIONS APPROVED, NOT ACCEPTED 1 $41,920 1 $156,860 0 $0 APPLICATIONS DENIED 1 $45,630 0 $0 0 $0 APPLICATIONS WITHDRAWN 1 $79,730 1 $45,100 0 $0 FILES CLOSED FOR INCOMPLETENESS 0 $0 0 $0 0 $0
Aggregated Statistics For Year 1999(Based on 1 full and 1 partial tracts) A) Conventional B) Refinancings C) Non-occupant Loans on Number Average Value Number Average Value Number Average Value
LOANS ORIGINATED 28 $84,034 19 $82,072 1 $49,630 APPLICATIONS APPROVED, NOT ACCEPTED 0 $0 3 $73,950 0 $0 APPLICATIONS DENIED 0 $0 2 $86,760 0 $0 APPLICATIONS WITHDRAWN 1 $112,120 0 $0 0 $0 FILES CLOSED FOR INCOMPLETENESS 1 $59,550 1 $127,390 0 $0
Detailed PMIC statistics for the following Tracts:
0077.01
, 0077.02 Fire-safe hotels and motels in Glenpool, Oklahoma:
Best Western Glenpool/Tulsa Inn, 14831 S Casper St, Glenpool, Oklahoma 74033 Phone: (918) 322-5201, Fax: (918) 322-9604
Holiday Inn Express Glenpool, 12209 S Yukon Ave, Glenpool, Oklahoma 74033 Phone: (918) 296-7000
QUALITY INN, 14831 S CASPER St, Glenpool, Oklahoma 74033 Phone: (918) 322-5201, Fax: (918) 322-9604
All 3 fire-safe hotels and motels in Glenpool, Oklahoma
Most common first names in Glenpool, OK among deceased individuals Name Count Lived (average)
Mary 20 79.5 years James 16 68.9 years William 15 72.4 years Robert 14 72.4 years George 12 70.6 years Betty 9 73.4 years John 7 71.6 years Gladys 7 88.9 years Ruby 6 83.1 years Kenneth 6 66.5 years
Most common last names in Glenpool, OK among deceased individuals Last name Count Lived (average)
Smith 16 76.1 years Jones 14 67.2 years Bell 10 82.5 years Clark 8 73.2 years Taylor 7 66.3 years Covington 7 74.0 years Thomas 6 68.7 years Griffith 6 79.8 years Davis 6 61.0 years Phillips 6 80.5 years
Glenpool compared to Oklahoma state average:
Unemployed percentage significantly below state average. Median age below state average. Length of stay since moving in significantly above state average. House age significantly below state average.
#12 on the list of "Top 101 cities with the largest city-data.com crime index increase from 2002 to 2012 (population 5,000+)"
#16 on the list of "Top 101 cities with largest percentage of males in industries: broadcasting, internet publishing, and telecommunications services (population 5,000+)"
#16 on the list of "Top 101 cities with largest percentage of females in industries: broadcasting, internet publishing, and telecommunications services (population 5,000+)"
#16 on the list of "Top 101 cities with largest percentage of males in industries: wholesale electronic markets and agents and brokers (population 5,000+)"
#16 on the list of "Top 101 cities with largest percentage of females in industries: wholesale electronic markets and agents and brokers (population 5,000+)"
#100 (74033) on the list of "Top 101 zip codes with the largest percentage of Welsh first ancestries (pop 5,000+)"
#6 on the list of "Top 101 counties with the highest lead air pollution readings in 2012 (µg/m3 )"
#13 on the list of "Top 101 counties with the lowest percentage of residents relocating from foreign countries between 2010 and 2011 (pop. 50,000+)"
#20 on the list of "Top 101 counties with the most Evangelical Protestant adherents"
#22 on the list of "Top 101 counties with the most Evangelical Protestant congregations"
#24 on the list of "Top 101 counties with the lowest lead air pollution readings in 2012 (µg/m3 )"
Top Patent Applicants
David Z. Anderson (9)
Ray Young (5)
Damian Riddoch (2)
Jonathan Coulter (1)
Jeff William White (1)
Amy K. Paris (1)
Jerrod W. Latta (1)
Nathan G. Nelson (1)
Bradley R. Tate,nunn (1)
David Snell (1)
Total of 24 patent applications in 2008-2024.
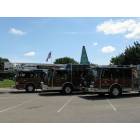
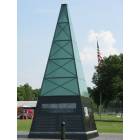
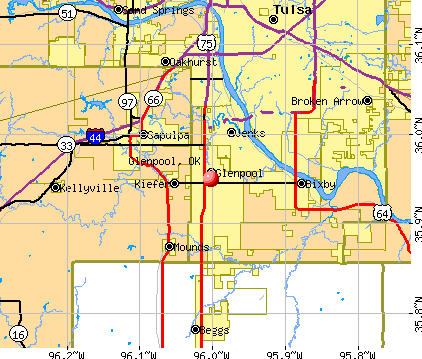


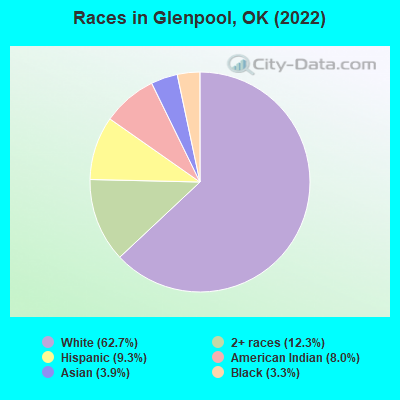
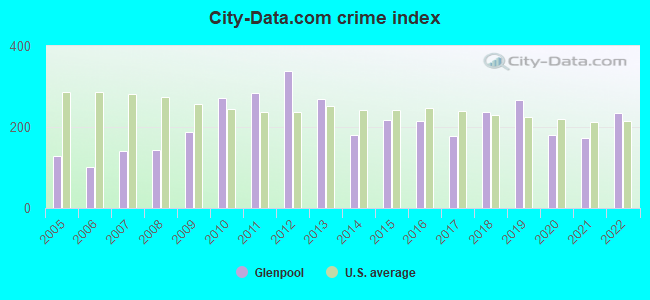
 Recent articles from our blog. Our writers, many of them Ph.D. graduates or candidates, create easy-to-read articles on a wide variety of topics.


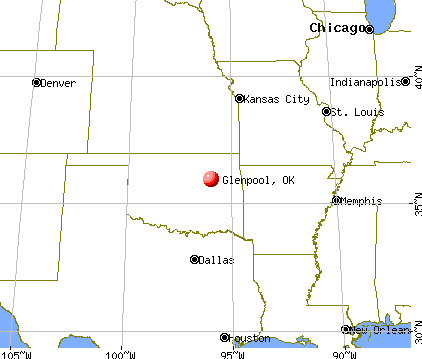
 (13.1 miles
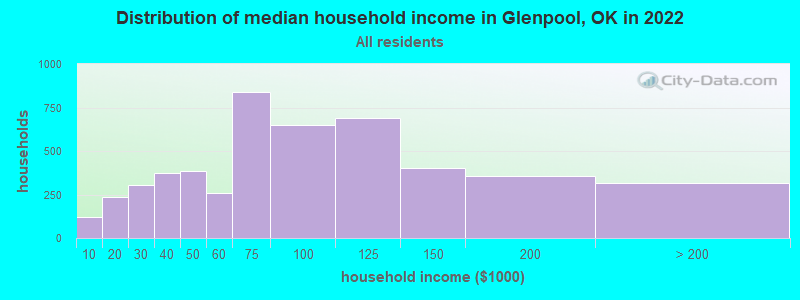
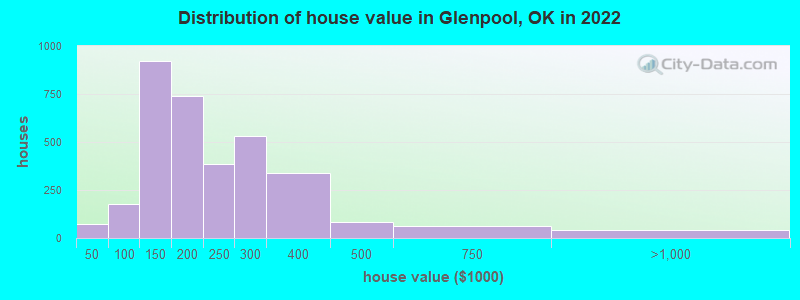

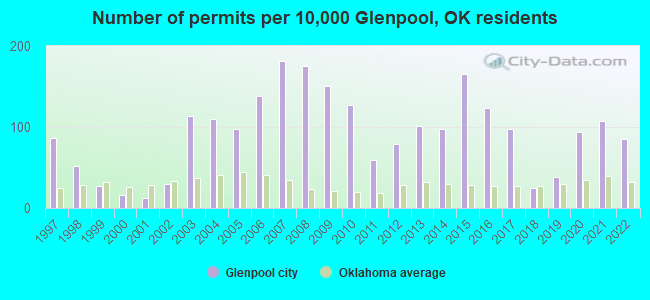
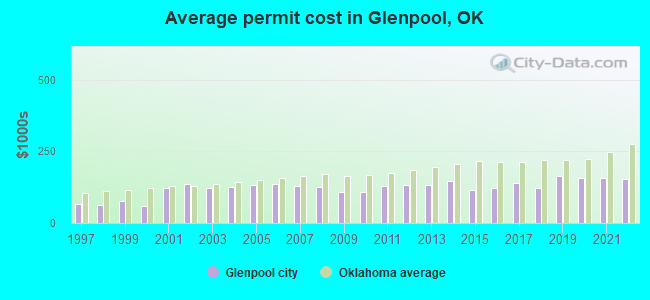
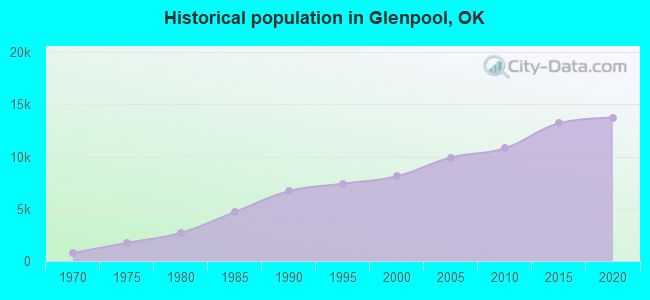
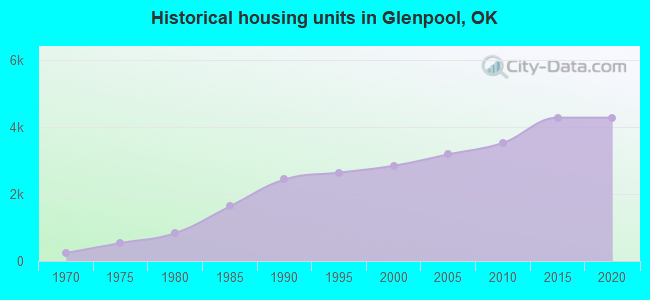
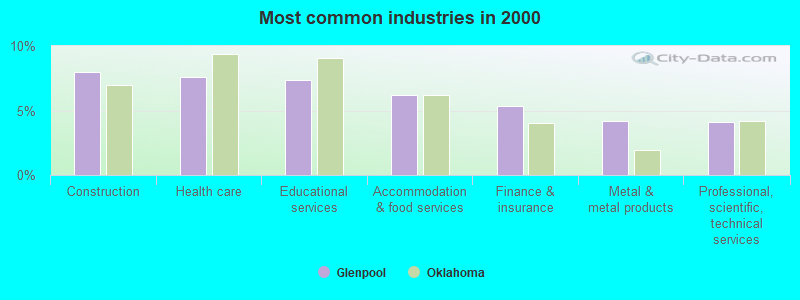
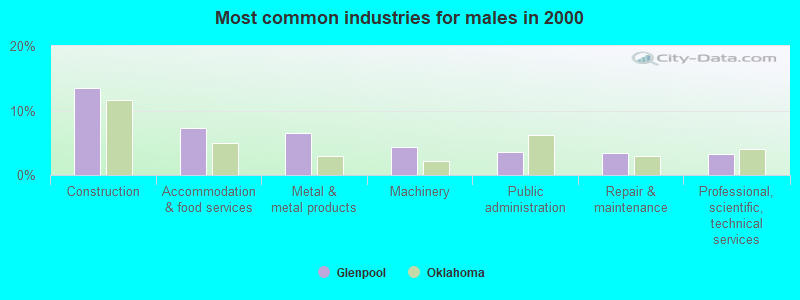
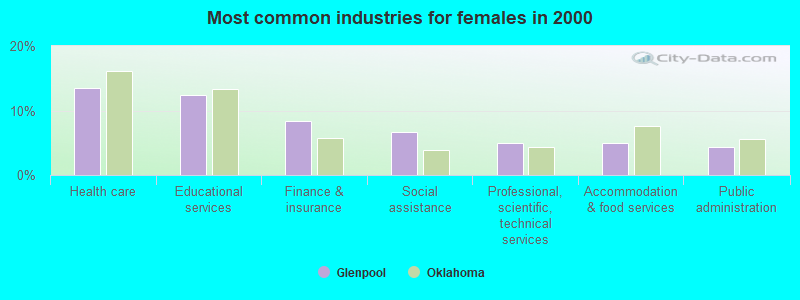
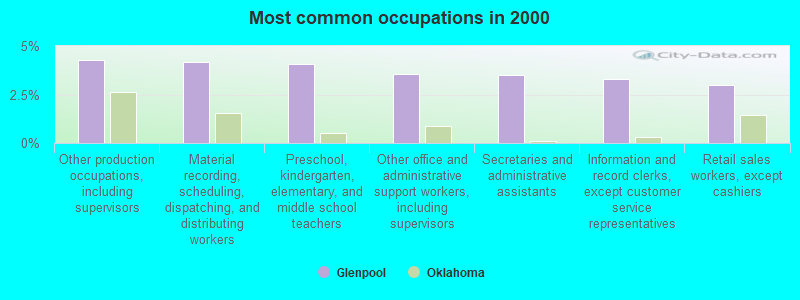
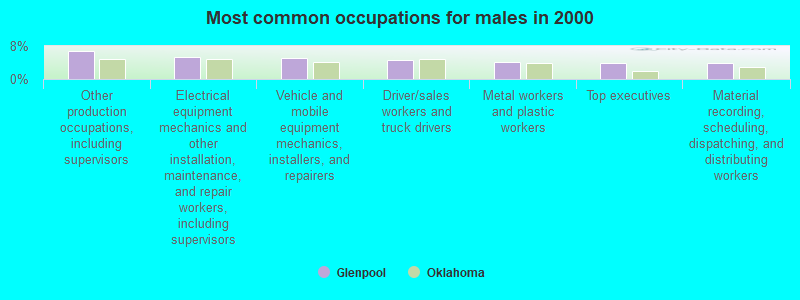
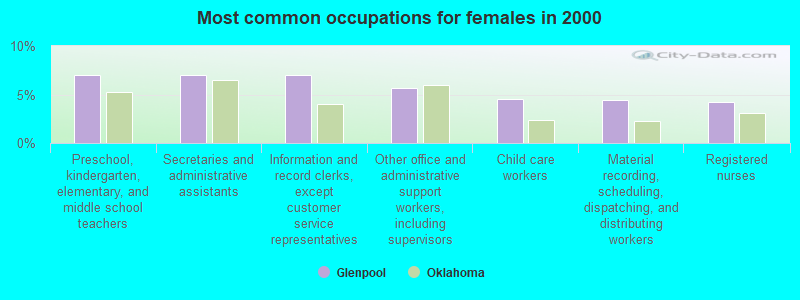
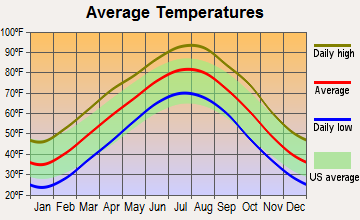
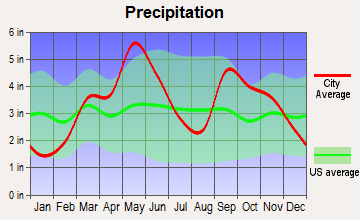
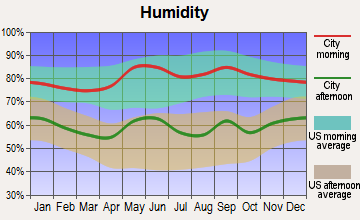
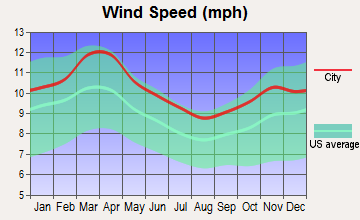
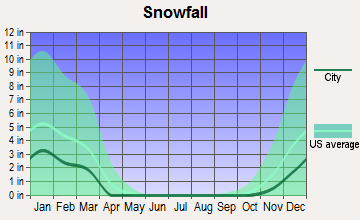
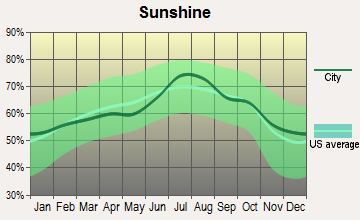
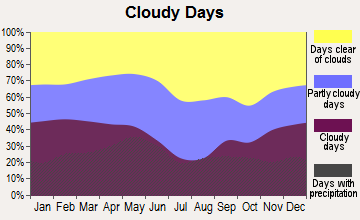
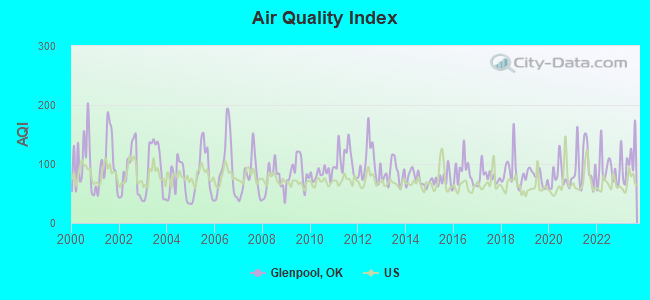
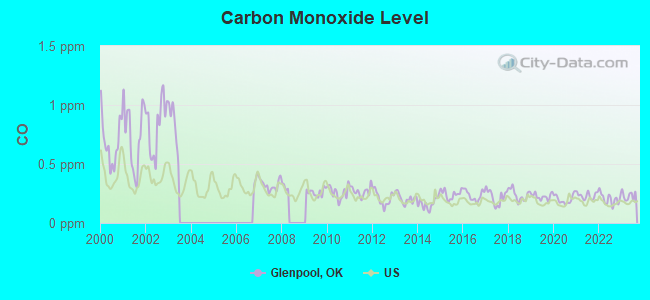
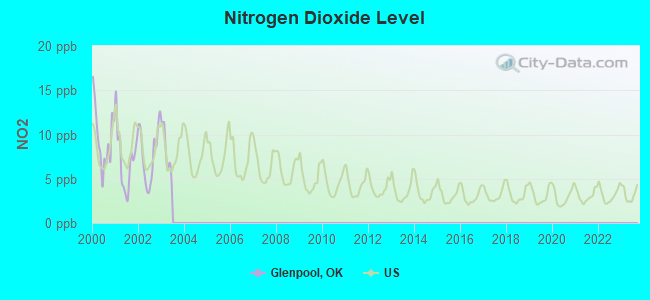
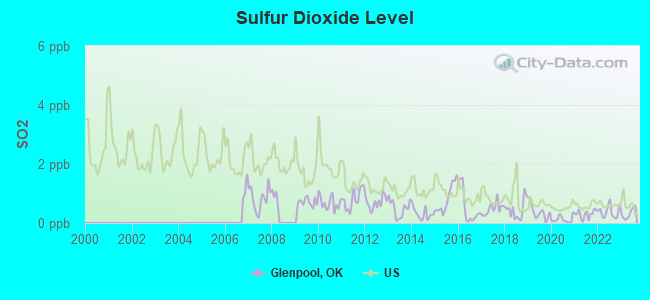
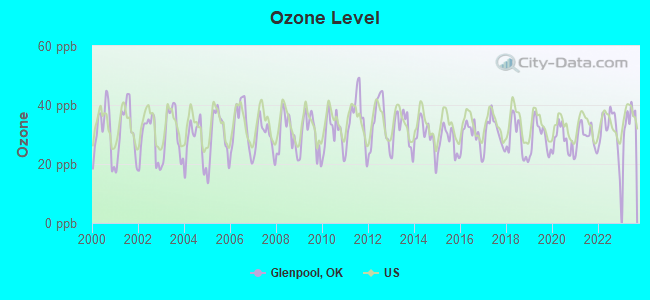
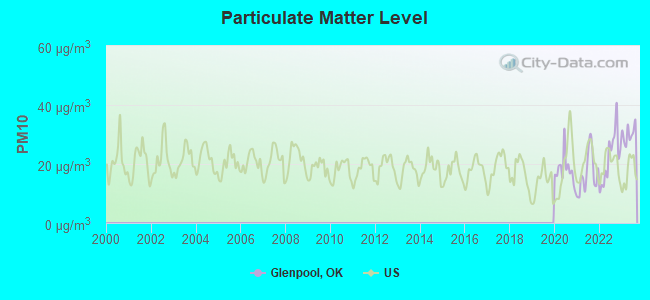
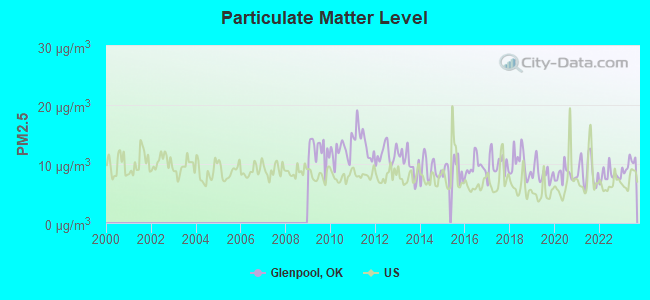
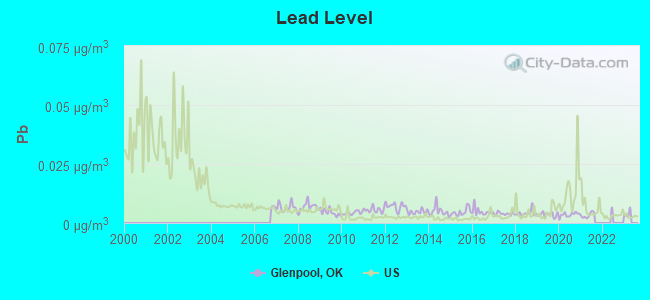

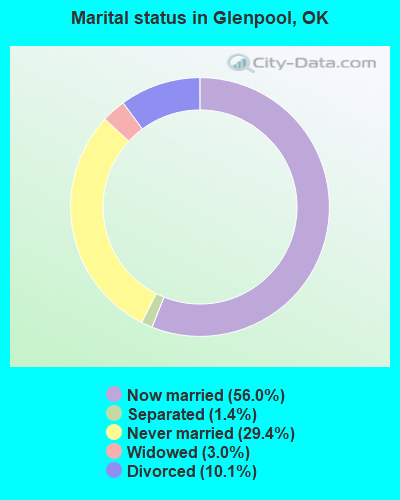
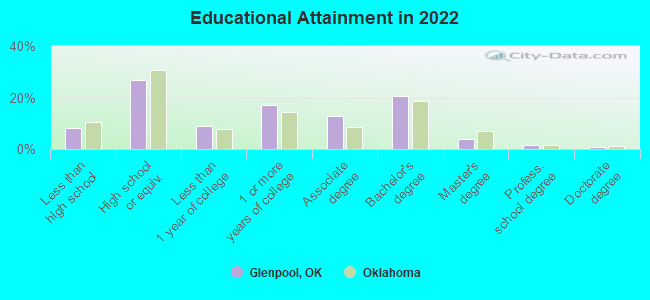
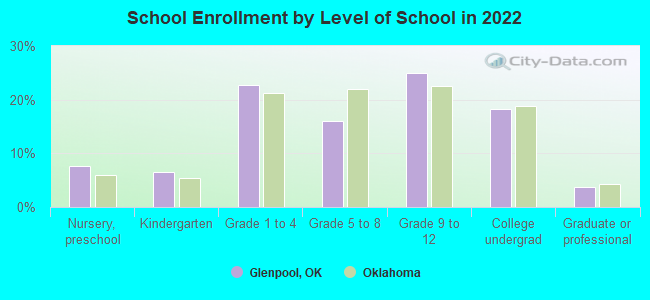
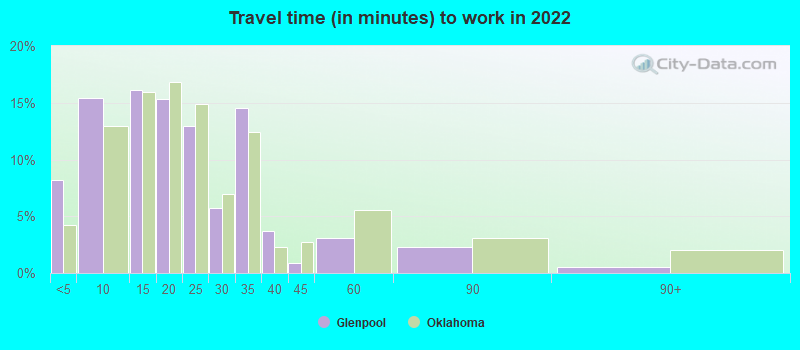
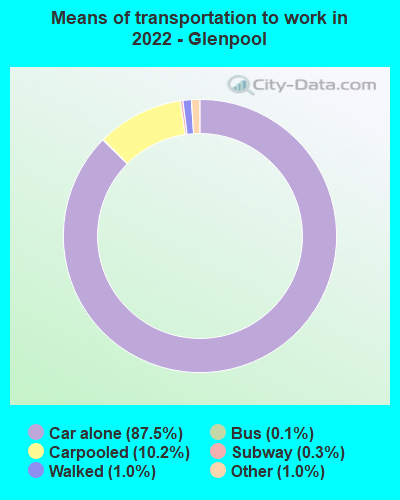
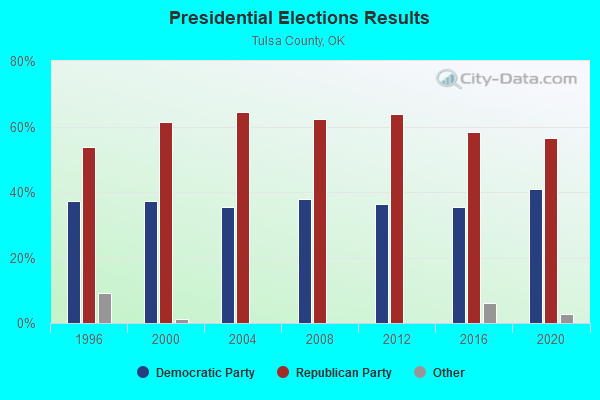
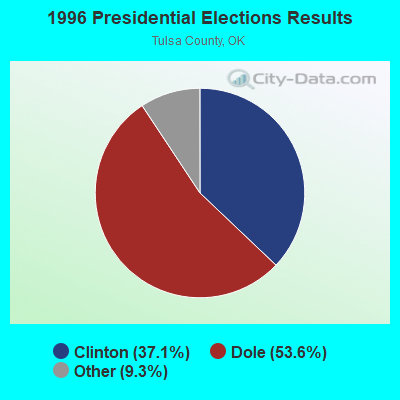
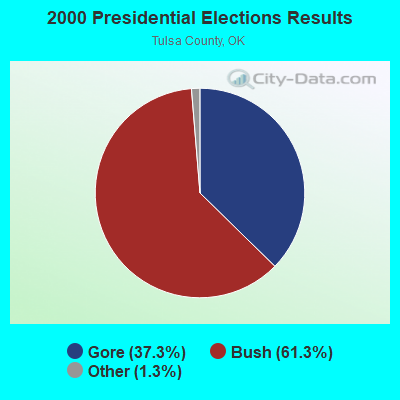

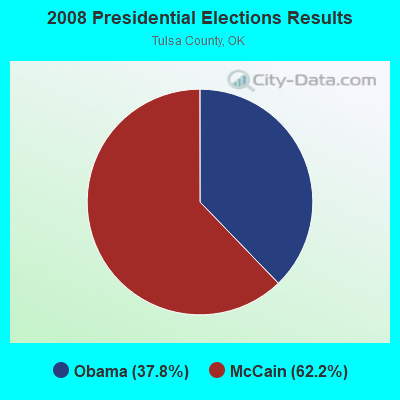
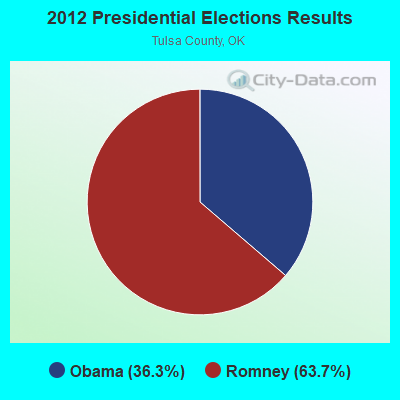
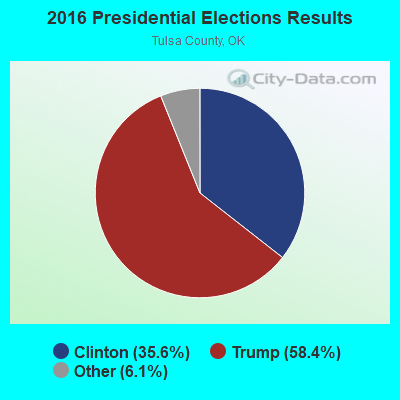
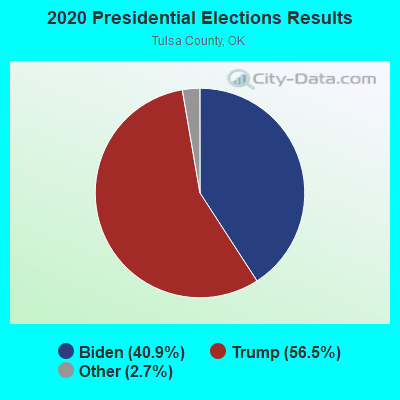
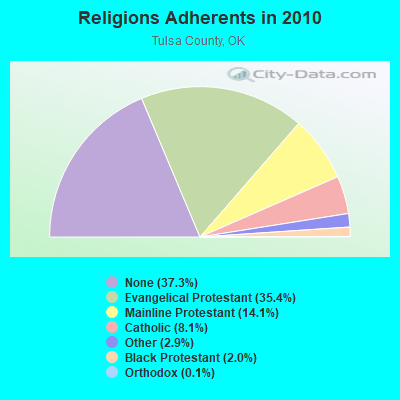
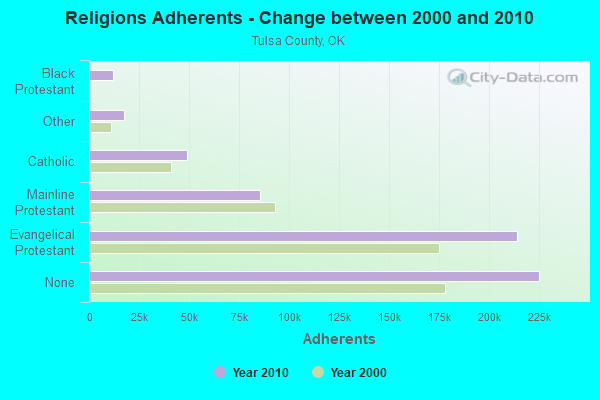
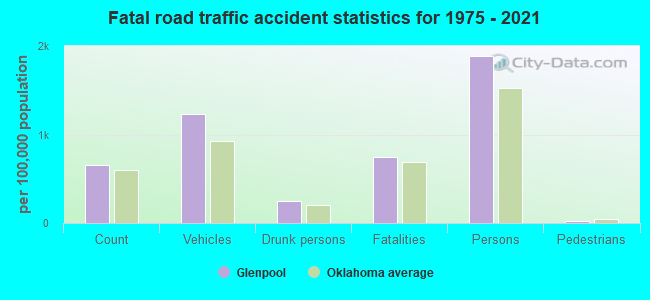
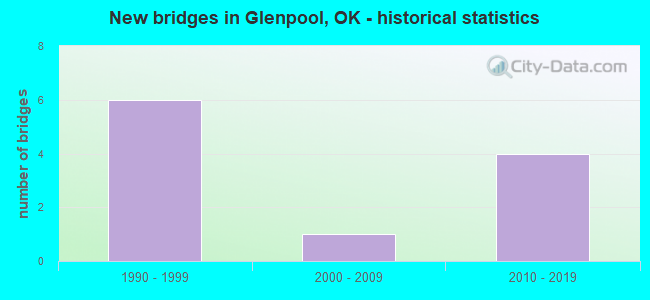
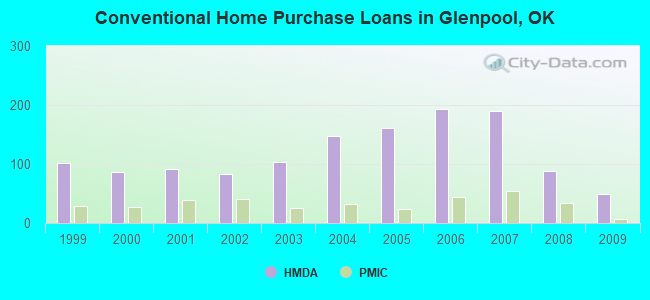
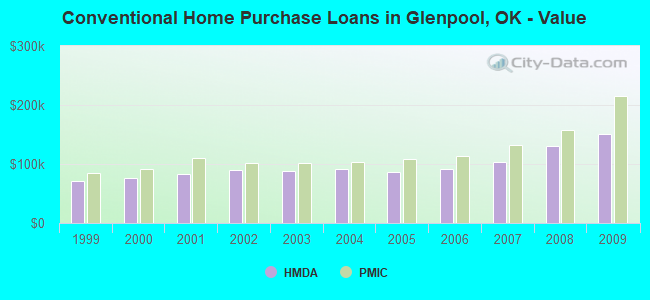
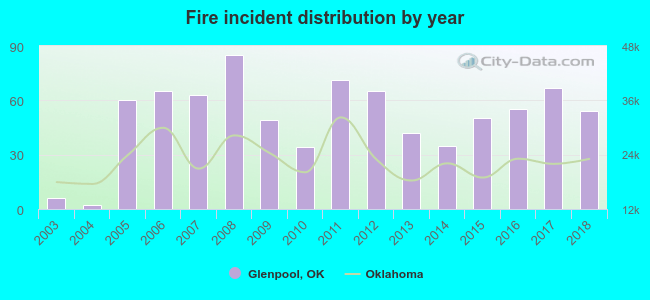 Based on the data from the years 2003 - 2018 the average number of fires per year is 50. The highest number of reported fires - 85 took place in 2008, and the least - 2 in 2004. The data has a rising trend.
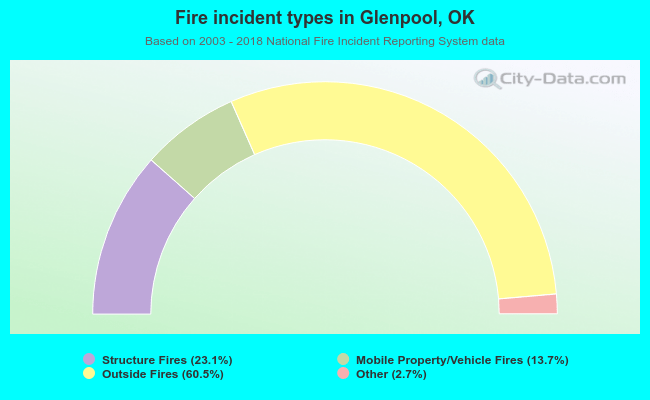 When looking into fire subcategories, the most reports belonged to: Outside Fires (60.5%), and Structure Fires (23.1%).