Estimated zip code population in 2022: 8,626 Zip code population in 2010: 7,172 Zip code population in 2000: 4,114
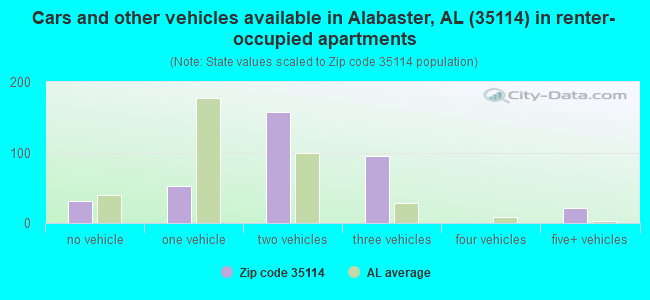
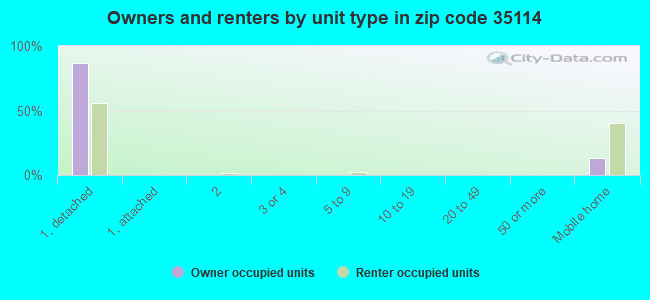
Houses and condos: 3,079 Renter-occupied apartments: 357
% of renters here:
12%
State:
30%
March 2022 cost of living index in zip code 35114: 87.9 (less than average, U.S. average is 100)
Land area: 12.4 sq. mi. Water area: 0.1 sq. mi.
Population density: 696 people per square mile
(low).
OSM Map
General Map
Google Map
MSN Map
OSM Map
General Map
Google Map
MSN Map
OSM Map
General Map
Google Map
MSN Map
OSM Map
General Map
Google Map
MSN Map
Please wait while loading the map...
Real estate property taxes paid for housing units in 2022:
This zip code:
0.4% ($1,219)
Alabama:
0.4% ($718)
Median real estate property taxes paid for housing units with mortgages in 2022: $1,304 (0.4%) Median real estate property taxes paid for housing units with no mortgage in 2022: $986 (0.4%)
Business Search- 14 Million verified businesses
Males: 4,398
(51.0%)
Females: 4,227
(49.0%)
For population 25 years and over in 35114:
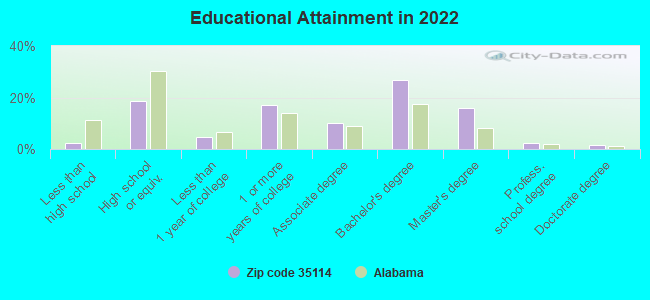
High school or higher: 99.2%
Bachelor's degree or higher: 47.8%
Graduate or professional degree: 20.3%
Unemployed: 2.0%
Mean travel time to work (commute): 34.1 minutes
For population 15 years and over in 35114:
Never married: 25.2%
Now married: 63.1%
Separated: 1.3%
Widowed: 3.9%
Divorced: 6.6%
Zip code 35114 compared to state average:
Median household income above state average.
Unemployed percentage below state average.
Foreign-born population percentage above state average.
Renting percentage significantly below state average.
Number of rooms per house above state average.
House age significantly below state average.
Percentage of population with a bachelor's degree or higher above state average.
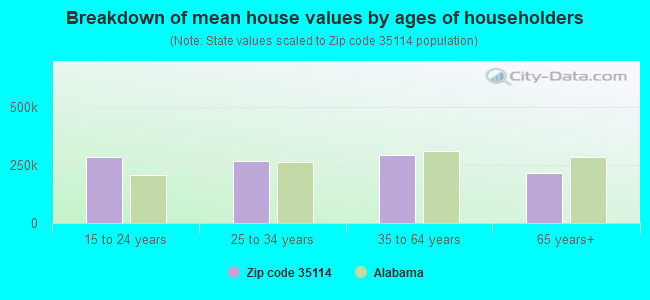
Estimated median house/condo value in 2022: $291,831
35114:
$291,831
Alabama:
$200,900
According to our research of Alabama and other state lists, there were 3 registered sex offenders living in 35114 zip code as of May 23, 2024. The ratio of all residents to sex offenders in zip code 35114 is 2,696 to 1. The ratio of registered sex offenders to all residents in this zip code is much lower than the state average.
Median resident age:
This zip code:
40.4 years
Alabama median age:
39.6 years
Average household size:
This zip code:
2.8 people
Alabama:
2.5 people
Averages for the 2020 tax year for zip code 35114, filed in 2021:
Average Adjusted Gross Income (AGI) in 2020: $69,353 (Individual Income Tax Returns)
Here:
$69,353
State:
$63,984
Salary/wage: $65,821 (reported on 82.7% of returns)
Here:
$65,821
State:
$52,834
(% of AGI for various income ranges: 1119.9% for AGIs below $25k, 3639.8% for AGIs $25k-50k, 6760.9% for AGIs $50k-75k, 9884.4% for AGIs $75k-100k, 20121.8% for AGIs $100k-200k, 54268.0% for AGIs over 200k)
Taxable interest for individuals: $671 (reported on 25.5% of returns)
This zip code:
$671
Alabama:
$1,615
(% of AGI for various income ranges: 6.6% for AGIs below $25k, 9.6% for AGIs $25k-50k, 30.3% for AGIs $50k-75k, 23.2% for AGIs $75k-100k, 58.7% for AGIs $100k-200k, 164.0% for AGIs over 200k)
Ordinary dividends: $2,417 (reported on 14.0% of returns)
Here:
$2,417
State:
$7,660
(% of AGI for various income ranges: 11.4% for AGIs below $25k, 19.2% for AGIs $25k-50k, 37.3% for AGIs $50k-75k, 56.4% for AGIs $75k-100k, 118.2% for AGIs $100k-200k, 418.0% for AGIs over 200k)
Net capital gain/loss in AGI: +$5,771 (reported on 12.5% of returns)
Here:
+$5,771
State:
+$23,528
(% of AGI for various income ranges: 5.9% for AGIs below $25k, 31.2% for AGIs $25k-50k, 28.8% for AGIs $50k-75k, 89.2% for AGIs $75k-100k, 277.4% for AGIs $100k-200k, 1532.0% for AGIs over 200k)
Profit/loss from business: +$11,772 (reported on 20.4% of returns)
Here:
+$11,772
State:
+$9,534
(% of AGI for various income ranges: 192.7% for AGIs below $25k, 332.2% for AGIs $25k-50k, 108.5% for AGIs $50k-75k, 275.2% for AGIs $75k-100k, 623.6% for AGIs $100k-200k, 2732.0% for AGIs over 200k)
Taxable individual retirement arrangement distribution: $20,664 (reported on 8.5% of returns)
35114:
$20,664
Alabama:
$19,004
(% of AGI for various income ranges: 62.7% for AGIs below $25k, 91.2% for AGIs $25k-50k, 258.2% for AGIs $50k-75k, 385.2% for AGIs $75k-100k, 786.4% for AGIs $100k-200k)
Total itemized deductions: $29,809 (reported on 10.0% of returns)
Here:
$29,809
State:
$37,338
(% of AGI for various income ranges: 140.0% for AGIs $25k-50k, 385.8% for AGIs $50k-75k, 544.4% for AGIs $75k-100k, 1169.0% for AGIs $100k-200k, 3860.0% for AGIs over 200k)
Charity contributions: $11,500 (reported on 9.7% of returns)
Here:
$11,500
State:
$18,005
(% of AGI for various income ranges: 23.5% for AGIs $25k-50k, 117.0% for AGIs $50k-75k, 163.2% for AGIs $75k-100k, 495.6% for AGIs $100k-200k, 1666.0% for AGIs over 200k)
Taxes paid: $6,703 (reported on 10.0% of returns)
35114:
$6,703
State:
$6,484
(% of AGI for various income ranges: 17.1% for AGIs $25k-50k, 75.2% for AGIs $50k-75k, 112.8% for AGIs $75k-100k, 282.1% for AGIs $100k-200k, 990.0% for AGIs over 200k)
Earned income credit: $2,409 (reported on 14.0% of returns)
Here:
$2,409
State:
$2,628
(% of AGI for various income ranges: 94.1% for AGIs below $25k, 88.0% for AGIs $25k-50k)
Percentage of individuals using paid preparers for their 2020 taxes: 93.9%
Here:
94%
State:
93%
(% for various income ranges: 90.8% for AGIs below $25k, 95.6% for AGIs $25k-50k, 95.6% for AGIs $50k-75k, 97.1% for AGIs $75k-100k, 94.3% for AGIs $100k-200k, 92.3% for AGIs over 200k)
Averages for the 2012 tax year for zip code 35114, filed in 2013:
Average Adjusted Gross Income (AGI) in 2012: $62,813 (Individual Income Tax Returns)
Here:
$62,813
State:
$52,001
Salary/wage: $58,432 (reported on 87.6% of returns)
Here:
$58,432
State:
$43,822
(% of AGI for various income ranges: 75.8% for AGIs below $25k, 82.2% for AGIs $25k-50k, 82.9% for AGIs $50k-75k, 84.0% for AGIs $75k-100k, 86.6% for AGIs $100k-200k, 61.8% for AGIs over 200k)
Taxable interest for individuals: $571 (reported on 29.8% of returns)
This zip code:
$571
Alabama:
$1,592
(% of AGI for various income ranges: 0.6% for AGIs below $25k, 0.3% for AGIs $25k-50k, 0.4% for AGIs $50k-75k, 0.2% for AGIs $75k-100k, 0.2% for AGIs $100k-200k, 0.2% for AGIs over 200k)
Ordinary dividends: $1,622 (reported on 16.0% of returns)
Here:
$1,622
State:
$5,697
(% of AGI for various income ranges: 0.5% for AGIs below $25k, 0.6% for AGIs $25k-50k, 0.5% for AGIs $50k-75k, 0.3% for AGIs $75k-100k, 0.4% for AGIs $100k-200k, 0.4% for AGIs over 200k)
Net capital gain/loss in AGI: +$1,463 (reported on 10.6% of returns)
Here:
+$1,463
State:
+$13,286
(% of AGI for various income ranges: 0.6% for AGIs $100k-200k, 0.4% for AGIs over 200k)
Profit/loss from business: +$12,425 (reported on 15.6% of returns)
Here:
+$12,425
State:
+$9,151
(% of AGI for various income ranges: 9.3% for AGIs below $25k, 4.0% for AGIs $25k-50k, 2.4% for AGIs $50k-75k, 2.2% for AGIs $75k-100k, 3.5% for AGIs $100k-200k)
Taxable individual retirement arrangement distribution: $18,984 (reported on 8.9% of returns)
35114:
$18,984
Alabama:
$14,992
(% of AGI for various income ranges: 3.0% for AGIs below $25k, 3.0% for AGIs $25k-50k, 2.1% for AGIs $50k-75k, 2.9% for AGIs $75k-100k, 3.5% for AGIs $100k-200k)
Total itemized deductions: $20,428 (21% of AGI, reported on 46.8% of returns)
Here:
$20,428
State:
$21,388
Here:
20.9% of AGI
State:
20.1% of AGI
(% of AGI for various income ranges: 10.7% for AGIs below $25k, 14.6% for AGIs $25k-50k, 16.5% for AGIs $50k-75k, 16.9% for AGIs $75k-100k, 16.0% for AGIs $100k-200k, 11.5% for AGIs over 200k)
Charity contributions: $4,723 (reported on 41.5% of returns)
Here:
$4,723
State:
$5,925
(% of AGI for various income ranges: 1.1% for AGIs below $25k, 2.9% for AGIs $25k-50k, 2.9% for AGIs $50k-75k, 3.2% for AGIs $75k-100k, 3.5% for AGIs $100k-200k, 3.4% for AGIs over 200k)
Taxes paid: $5,095 (reported on 46.8% of returns)
35114:
$5,095
State:
$5,272
(% of AGI for various income ranges: 1.1% for AGIs below $25k, 2.3% for AGIs $25k-50k, 3.5% for AGIs $50k-75k, 4.2% for AGIs $75k-100k, 4.6% for AGIs $100k-200k, 3.9% for AGIs over 200k)
Earned income credit: $2,300 (reported on 13.8% of returns)
Here:
$2,300
State:
$2,646
(% of AGI for various income ranges: 5.9% for AGIs below $25k, 1.4% for AGIs $25k-50k)
Percentage of individuals using paid preparers for their 2012 taxes: 50.0%
Here:
50%
State:
60%
(% for various income ranges: 47.3% for AGIs below $25k, 51.9% for AGIs $25k-50k, 53.3% for AGIs $50k-75k, 44.1% for AGIs $75k-100k, 51.9% for AGIs $100k-200k, 66.7% for AGIs over 200k)
Averages for the 2004 tax year for zip code 35114, filed in 2005:
Average Adjusted Gross Income (AGI) in 2004: $53,523 (Individual Income Tax Returns)
Here:
$53,523
State:
$42,302
Salary/wage: $52,676 (reported on 89.4% of returns)
Here:
$52,676
State:
$36,626
(% of AGI for various income ranges: 105.4% for AGIs below $10k, 80.4% for AGIs $10k-25k, 86.7% for AGIs $25k-50k, 88.0% for AGIs $50k-75k, 91.7% for AGIs $75k-100k, 86.4% for AGIs over 100k)
Taxable interest for individuals: $511 (reported on 37.5% of returns)
This zip code:
$511
Alabama:
$1,827
(% of AGI for various income ranges: 2.0% for AGIs below $10k, 1.2% for AGIs $10k-25k, 0.5% for AGIs $25k-50k, 0.4% for AGIs $50k-75k, 0.2% for AGIs $75k-100k, 0.2% for AGIs over 100k)
Taxable dividends: $689 (reported on 20.4% of returns)
Here:
$689
State:
$4,206
(% of AGI for various income ranges: 1.0% for AGIs below $10k, 0.3% for AGIs $10k-25k, 0.4% for AGIs $25k-50k, 0.2% for AGIs $50k-75k, 0.2% for AGIs $75k-100k, 0.3% for AGIs over 100k)
Net capital gain/loss: +$2,173 (reported on 14.1% of returns)
Here:
+$2,173
State:
+$13,031
(% of AGI for various income ranges: -1.1% for AGIs below $10k, -0.3% for AGIs $10k-25k, 0.3% for AGIs $25k-50k, 0.3% for AGIs $50k-75k, -0.2% for AGIs $75k-100k, 1.6% for AGIs over 100k)
Profit/loss from business: +$9,485 (reported on 15.5% of returns)
Here:
+$9,485
State:
+$8,302
(% of AGI for various income ranges: 15.2% for AGIs below $10k, 5.9% for AGIs $10k-25k, 3.8% for AGIs $25k-50k, 1.6% for AGIs $50k-75k, 2.6% for AGIs $75k-100k, 2.1% for AGIs over 100k)
IRA payment deduction: $2,788 (reported on 1.6% of returns)
35114:
$2,788
Alabama:
$3,006
Total itemized deductions: $17,524 (22% of AGI, reported on 53.2% of returns)
Here:
$17,524
State:
$17,623
Here:
22.2% of AGI
State:
20.8% of AGI
(% of AGI for various income ranges: 11.7% for AGIs below $10k, 14.6% for AGIs $10k-25k, 15.8% for AGIs $25k-50k, 19.0% for AGIs $50k-75k, 19.4% for AGIs $75k-100k, 16.4% for AGIs over 100k)
Charity contributions deductions: $3,489 (4% of AGI, reported on 47.9% of returns)
Here:
$3,489
State:
$4,768
Here:
4.3% of AGI
State:
5.4% of AGI
(% of AGI for various income ranges: 1.5% for AGIs below $10k, 1.9% for AGIs $10k-25k, 2.5% for AGIs $25k-50k, 2.6% for AGIs $50k-75k, 3.5% for AGIs $75k-100k, 3.7% for AGIs over 100k)
Total tax: $6,819 (reported on 79.7% of returns)
35114:
$6,819
State:
$6,905
(% of AGI for various income ranges: 3.7% for AGIs below $10k, 4.2% for AGIs $10k-25k, 6.3% for AGIs $25k-50k, 8.0% for AGIs $50k-75k, 9.7% for AGIs $75k-100k, 14.8% for AGIs over 100k)
Earned income credit: $1,631 (reported on 12.8% of returns)
Here:
$1,631
State:
$2,048
Percentage of individuals using paid preparers for their 2004 taxes: 54.2%
Here:
54%
State:
65%
(% for various income ranges: 48.3% for AGIs below $10k, 57.7% for AGIs $10k-25k, 57.5% for AGIs $25k-50k, 56.0% for AGIs $50k-75k, 49.7% for AGIs $75k-100k, 53.5% for AGIs over 100k)
Household received Food Stamps/SNAP in the past 12 months: 67 Household did not receive Food Stamps/SNAP in the past 12 months: 2,956
Women who had a birth in the past 12 months: 29 (33 now married, 0 unmarried) Women who did not have a birth in the past 12 months: 2,447 (1,328 now married, 1,116 unmarried)
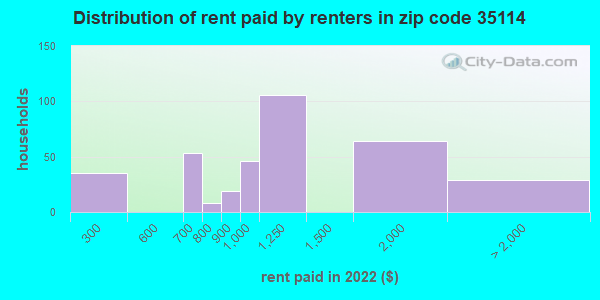
Housing units in zip code 35114 with a mortgage: 2,004 (185 second mortgage, 141 both second mortgage and home equity loan) Median monthly owner costs for units with a mortgage: $1,615 Median monthly owner costs for units without a mortgage: $440
Residents with income below the poverty level in 2022:
This zip code:
4.1%
Whole state:
16.2%
Residents with income below 50% of the poverty level in 2022:
This zip code:
1.8%
Whole state:
8.6%
Median number of rooms in houses and condos:
Here:
7.5
State:
6.5
Median number of rooms in apartments:
Here:
5.7
State:
4.7
Notable locations in this zip code not listed on our city pages
In group quarters: 3 (-1 institutionalized population)
Size of family households: 918 2-persons, 741 3-persons, 480 4-persons, 228 5-persons, 74 6-persons, 26 7-or-more-persons
Size of nonfamily households: 515 1-person, 63 2-persons
1,798 married couples with children.
326 single-parent households (22 men, 304 women).
91.3% of residents of 35114 zip code speak English at home.
6.4% of residents speak Spanish at home (64% very well, 16% well, 20% not well).
2.1% of residents speak other Indo-European language at home (39% very well, 61% well).
Foreign born population: 600 (7.0%) (46.0% of them are naturalized citizens)
This zip code:
7.0%
Whole state:
3.8%
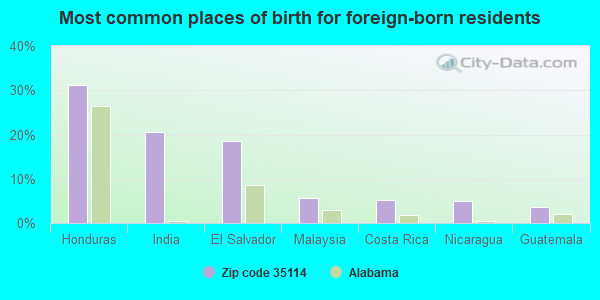
31%Honduras
21%India
18%El Salvador
6%Malaysia
5%Costa Rica
5%Nicaragua
4%Guatemala
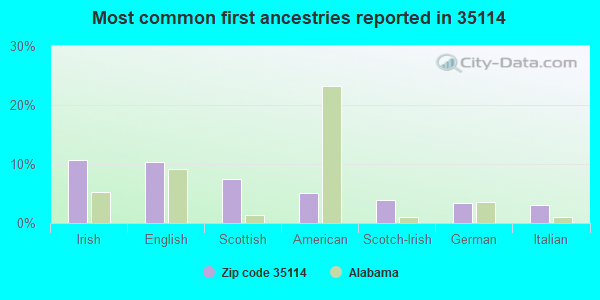
11%Irish
10%English
7%Scottish
5%American
4%Scotch-Irish
3%German
3%Italian
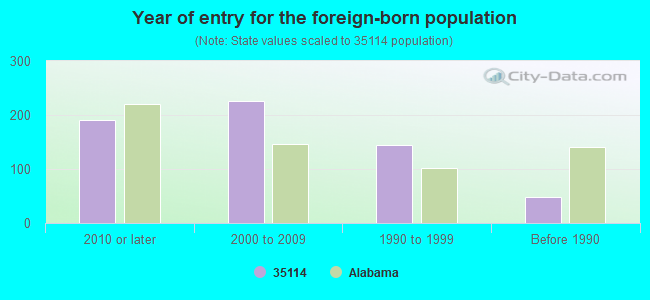
Year of entry for the foreign-born population
1902010 or later
2262000 to 2009
1451990 to 1999
48Before 1990
Public elementary/middle school in in zip code 35114 not listed on the city page:
Facilities with environmental interests located in this zip code:
MAYLENE QUARRY (MARTIN MARIETTA AGGREGATES in MAYLENE, AL)
National Pollutant Discharge Elimination System NON-MAJOR (Tracking pollutant discharge elimination systems) - permit Business SIC classification: CRUSHED AND BROKEN LIMESTONE Alternative names: MARTIN MARIETTA AGGREGATES, MARTIN MARIETTA MAYLENE QUARRY
MINE 1 (TACOA MINERALS LLC in MAYLENE, AL)
National Pollutant Discharge Elimination System NON-MAJOR (Tracking pollutant discharge elimination systems) - permit Business SIC classification: BITUMINOUS COAL AND LIGNITE SURFACE MINING Alternative names: GHOLSON MINE, NEW CENTURY MINING INCORP, NEW CENTURY MINING INC MINE 1
CHINABERRY PHASE ONE (STAN PARKER DEVELOPMENT LLC in MAYLENE, AL)
National Pollutant Discharge Elimination System NON-MAJOR (Tracking pollutant discharge elimination systems) - permit Business SIC classification: HIGHWAY AND STREET CONSTRUCTION, EXCEPT ELEVATED HIGHWAYS Alternative names: STAN PARKER DEV CHINABERRY PH1
OAK MOUNTAIN ENERGY, LLC (8320 HWY 270 GURNEE MINE JUNCT in MAYLENE, AL)
AIR MINOR (AIRS/AFS) Business SIC classification: COAL MINING SERVICES
MARTIN MARIETTA AGGREGATES (CR 17 in MAYLENE, AL)
AIR SYNTHETIC MINOR (AIRS/AFS) CRITERIA AND HAZARDOUS AIR POLLUTANT INVENTORY (Inventory of air pollution sources) Business SIC classification: CRUSHED AND BROKEN LIMESTONE; MINERALS AND EARTHS, GROUND OR OTHERWISE TREATED Business NAICS classification: CRUSHED AND BROKEN LIMESTONE MINING AND QUARRYING.
Housing units lacking complete plumbing facilities: 1.5% Housing units lacking complete kitchen facilities: 0.6%
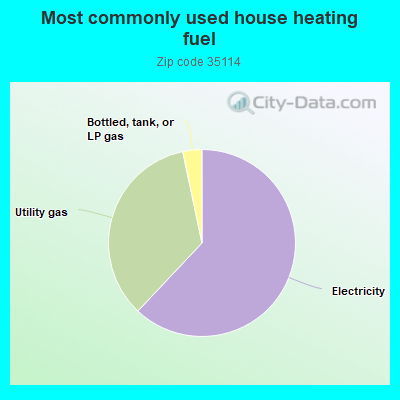
62.1%Electricity
34.7%Utility gas
3.3%Bottled, tank, or LP gas
Population in 1990: 3,727. Population change in the 1990s: +387 (+10.4%).
Place of birth for U.S.-born residents:
This state: 5,467
Northeast: 247
Midwest: 493
South: 1,481
West: 347
39% of the 35114 zip code residents lived in the same house 5 years ago. Out of people who lived in different houses, 42% lived in this county. Out of people who lived in different counties, 50% lived in Alabama.
91% of the 35114 zip code residents lived in the same house 1 year ago. Out of people who lived in different houses, 59% moved from this county. Out of people who lived in different houses, 24% moved from different county within same state. Out of people who lived in different houses, 15% moved from different state.
Private vs. public school enrollment:
Students in private schools in grades 1 to 8 (elementary and middle school): 110
Here:
12.8%
Alabama:
14.7%
Students in private schools in grades 9 to 12 (high school): 33
Here:
4.2%
Alabama:
16.3%
Students in private undergraduate colleges: 49
Here:
12.0%
Alabama:
14.6%
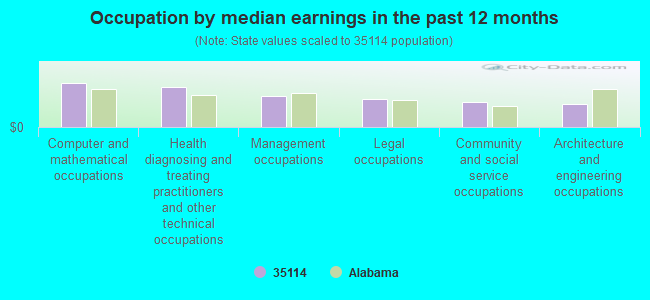
Occupation by median earnings in the past 12 months ($)
119,896Computer and mathematical occupations
109,947Health diagnosing and treating practitioners and other technical occupations
83,429Management occupations
75,338Legal occupations
68,277Community and social service occupations
62,394Architecture and engineering occupations
Top industries in this zip code by the number of employees in 2005:
Construction: New Single-Family Housing Construction (except Operative Builders) (5-9: 1, 1-4: 2)
Administrative and Support and Waste Management and Remediation Services: Landscaping Services (5-9: 1, 1-4: 2)
Accommodation and Food Services: Limited-Service Restaurants (5-9: 1, 1-4: 1)
Other Services (except Public Administration): Religious Organizations (1-4: 3)
Other Services (except Public Administration): Commercial and Industrial Machinery and Equipment (except Automotive and Electronic) Repair and Maintenance (1-4: 2)
Management of Companies and Enterprises: Corporate, Subsidiary, and Regional Managing Offices (1-4: 2)
People in group quarters in 2010:
3 people in group homes intended for adults
Fatal accident statistics in 2013:
Fatal accident count: 1
Vehicles involved in fatal accidents: 1
Fatal accidents caused by drunken drivers: 0
Fatalities: 1
Persons involved in fatal accidents: 1
Pedestrians involved in fatal accidents: 0
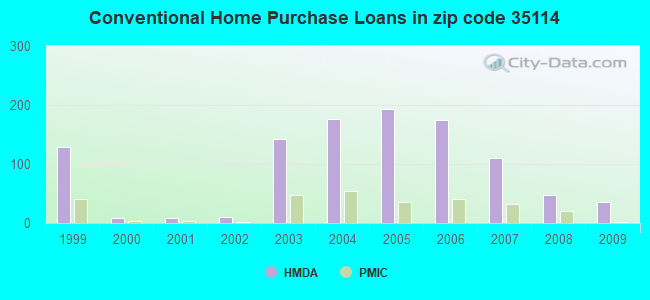
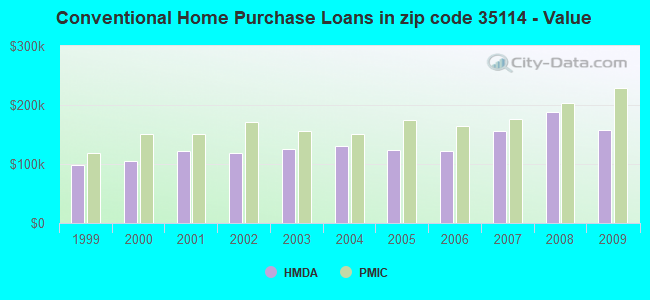
Home Mortgage Disclosure Act Aggregated Statistics For Year 2009 (Based on 2 partial tracts)
A) FHA, FSA/RHS & VA Home Purchase Loans
B) Conventional Home Purchase Loans
C) Refinancings
D) Home Improvement Loans
F) Non-occupant Loans on < 5 Family Dwellings (A B C & D)
G) Loans On Manufactured Home Dwelling (A B C & D)
Number
Average Value
Number
Average Value
Number
Average Value
Number
Average Value
Number
Average Value
Number
Average Value
LOANS ORIGINATED
48
$165,593
35
$157,145
154
$163,041
5
$86,024
4
$116,978
0
$0
APPLICATIONS APPROVED, NOT ACCEPTED
1
$220,990
1
$148,740
13
$167,035
0
$0
0
$0
0
$0
APPLICATIONS DENIED
3
$246,270
5
$116,322
61
$165,040
5
$100,244
3
$148,233
4
$78,832
APPLICATIONS WITHDRAWN
8
$165,620
4
$163,728
55
$177,264
0
$0
0
$0
0
$0
FILES CLOSED FOR INCOMPLETENESS
1
$130,790
0
$0
4
$158,045
0
$0
0
$0
0
$0
Aggregated Statistics For Year 2008 (Based on 2 partial tracts)
A) FHA, FSA/RHS & VA Home Purchase Loans
B) Conventional Home Purchase Loans
C) Refinancings
D) Home Improvement Loans
F) Non-occupant Loans on < 5 Family Dwellings (A B C & D)
G) Loans On Manufactured Home Dwelling (A B C & D)
Number
Average Value
Number
Average Value
Number
Average Value
Number
Average Value
Number
Average Value
Number
Average Value
LOANS ORIGINATED
43
$165,305
48
$187,950
93
$164,196
11
$70,586
4
$130,548
1
$19,630
APPLICATIONS APPROVED, NOT ACCEPTED
2
$166,570
4
$103,790
15
$154,073
1
$106,170
0
$0
1
$39,070
APPLICATIONS DENIED
7
$184,001
14
$78,671
71
$161,928
15
$69,369
1
$115,420
13
$57,359
APPLICATIONS WITHDRAWN
4
$175,780
10
$199,729
44
$159,905
1
$61,520
3
$112,957
0
$0
FILES CLOSED FOR INCOMPLETENESS
0
$0
3
$189,413
12
$145,085
0
$0
1
$228,670
0
$0
Aggregated Statistics For Year 2007 (Based on 2 partial tracts)
A) FHA, FSA/RHS & VA Home Purchase Loans
B) Conventional Home Purchase Loans
C) Refinancings
D) Home Improvement Loans
F) Non-occupant Loans on < 5 Family Dwellings (A B C & D)
G) Loans On Manufactured Home Dwelling (A B C & D)
Number
Average Value
Number
Average Value
Number
Average Value
Number
Average Value
Number
Average Value
Number
Average Value
LOANS ORIGINATED
13
$148,723
110
$156,173
104
$150,009
17
$66,289
13
$107,182
1
$11,310
APPLICATIONS APPROVED, NOT ACCEPTED
1
$169,740
8
$59,765
25
$123,732
1
$8,290
0
$0
0
$0
APPLICATIONS DENIED
3
$84,080
15
$145,974
71
$151,422
25
$82,688
2
$125,300
3
$29,327
APPLICATIONS WITHDRAWN
2
$143,065
17
$161,628
54
$129,857
4
$169,070
2
$169,560
0
$0
FILES CLOSED FOR INCOMPLETENESS
0
$0
4
$133,130
20
$146,686
0
$0
1
$189,390
0
$0
Aggregated Statistics For Year 2006 (Based on 2 partial tracts)
A) FHA, FSA/RHS & VA Home Purchase Loans
B) Conventional Home Purchase Loans
C) Refinancings
D) Home Improvement Loans
F) Non-occupant Loans on < 5 Family Dwellings (A B C & D)
G) Loans On Manufactured Home Dwelling (A B C & D)
Number
Average Value
Number
Average Value
Number
Average Value
Number
Average Value
Number
Average Value
Number
Average Value
LOANS ORIGINATED
7
$153,487
175
$122,674
119
$124,325
19
$52,794
14
$81,388
3
$38,930
APPLICATIONS APPROVED, NOT ACCEPTED
0
$0
19
$93,606
19
$118,984
3
$28,560
0
$0
7
$40,933
APPLICATIONS DENIED
2
$166,385
24
$79,685
80
$142,609
14
$54,606
6
$76,077
12
$42,408
APPLICATIONS WITHDRAWN
0
$0
16
$129,484
54
$152,339
6
$66,480
0
$0
0
$0
FILES CLOSED FOR INCOMPLETENESS
2
$87,905
6
$87,298
22
$151,284
0
$0
0
$0
0
$0
Aggregated Statistics For Year 2005 (Based on 2 partial tracts)
A) FHA, FSA/RHS & VA Home Purchase Loans
B) Conventional Home Purchase Loans
C) Refinancings
D) Home Improvement Loans
F) Non-occupant Loans on < 5 Family Dwellings (A B C & D)
G) Loans On Manufactured Home Dwelling (A B C & D)
Number
Average Value
Number
Average Value
Number
Average Value
Number
Average Value
Number
Average Value
Number
Average Value
LOANS ORIGINATED
10
$138,604
193
$124,355
147
$118,855
21
$51,777
14
$93,089
3
$21,947
APPLICATIONS APPROVED, NOT ACCEPTED
0
$0
17
$103,322
25
$110,090
4
$40,315
2
$141,835
5
$41,542
APPLICATIONS DENIED
3
$115,130
39
$82,954
71
$124,352
18
$36,010
5
$58,858
16
$38,848
APPLICATIONS WITHDRAWN
0
$0
15
$134,304
54
$124,741
8
$52,042
1
$44,700
2
$32,275
FILES CLOSED FOR INCOMPLETENESS
0
$0
7
$164,244
24
$141,417
1
$47,310
2
$93,425
0
$0
Aggregated Statistics For Year 2004 (Based on 2 partial tracts)
A) FHA, FSA/RHS & VA Home Purchase Loans
B) Conventional Home Purchase Loans
C) Refinancings
D) Home Improvement Loans
F) Non-occupant Loans on < 5 Family Dwellings (A B C & D)
G) Loans On Manufactured Home Dwelling (A B C & D)
Number
Average Value
Number
Average Value
Number
Average Value
Number
Average Value
Number
Average Value
Number
Average Value
LOANS ORIGINATED
15
$125,599
177
$130,743
145
$122,432
9
$30,886
7
$118,827
5
$25,730
APPLICATIONS APPROVED, NOT ACCEPTED
0
$0
14
$134,315
28
$126,228
1
$41,510
1
$88,330
2
$55,805
APPLICATIONS DENIED
2
$87,665
26
$91,504
95
$124,151
22
$27,643
1
$56,960
10
$22,586
APPLICATIONS WITHDRAWN
0
$0
12
$131,582
43
$127,552
9
$41,707
3
$63,980
0
$0
FILES CLOSED FOR INCOMPLETENESS
0
$0
6
$132,585
33
$125,901
1
$92,190
4
$75,715
0
$0
Aggregated Statistics For Year 2003 (Based on 2 partial tracts)
A) FHA, FSA/RHS & VA Home Purchase Loans
B) Conventional Home Purchase Loans
C) Refinancings
D) Home Improvement Loans
F) Non-occupant Loans on < 5 Family Dwellings (A B C & D)
Number
Average Value
Number
Average Value
Number
Average Value
Number
Average Value
Number
Average Value
LOANS ORIGINATED
21
$134,063
143
$126,168
294
$123,131
8
$28,105
9
$83,399
APPLICATIONS APPROVED, NOT ACCEPTED
1
$153,330
8
$109,412
44
$113,670
3
$15,997
0
$0
APPLICATIONS DENIED
2
$108,710
18
$77,182
90
$111,813
10
$37,980
2
$12,740
APPLICATIONS WITHDRAWN
1
$211,130
12
$120,778
47
$120,510
5
$22,892
1
$174,960
FILES CLOSED FOR INCOMPLETENESS
0
$0
4
$98,625
14
$134,025
1
$65,400
0
$0
Aggregated Statistics For Year 2002 (Based on 1 partial tract)
A) FHA, FSA/RHS & VA Home Purchase Loans
B) Conventional Home Purchase Loans
C) Refinancings
D) Home Improvement Loans
F) Non-occupant Loans on < 5 Family Dwellings (A B C & D)
Number
Average Value
Number
Average Value
Number
Average Value
Number
Average Value
Number
Average Value
LOANS ORIGINATED
2
$122,010
10
$118,608
25
$127,472
1
$32,220
1
$57,080
APPLICATIONS APPROVED, NOT ACCEPTED
0
$0
1
$111,500
3
$111,467
0
$0
0
$0
APPLICATIONS DENIED
0
$0
1
$69,460
7
$109,870
1
$23,470
0
$0
APPLICATIONS WITHDRAWN
0
$0
1
$87,170
5
$125,288
1
$44,600
0
$0
FILES CLOSED FOR INCOMPLETENESS
0
$0
0
$0
2
$111,555
0
$0
0
$0
Aggregated Statistics For Year 2001 (Based on 1 partial tract)
A) FHA, FSA/RHS & VA Home Purchase Loans
B) Conventional Home Purchase Loans
C) Refinancings
D) Home Improvement Loans
F) Non-occupant Loans on < 5 Family Dwellings (A B C & D)
Number
Average Value
Number
Average Value
Number
Average Value
Number
Average Value
Number
Average Value
LOANS ORIGINATED
3
$107,660
9
$122,384
19
$120,571
1
$30,840
1
$65,830
APPLICATIONS APPROVED, NOT ACCEPTED
0
$0
1
$60,390
2
$107,340
0
$0
0
$0
APPLICATIONS DENIED
0
$0
2
$53,935
5
$99,722
0
$0
0
$0
APPLICATIONS WITHDRAWN
0
$0
0
$0
5
$105,142
0
$0
0
$0
FILES CLOSED FOR INCOMPLETENESS
0
$0
0
$0
1
$160,370
0
$0
0
$0
Aggregated Statistics For Year 2000 (Based on 1 partial tract)
A) FHA, FSA/RHS & VA Home Purchase Loans
B) Conventional Home Purchase Loans
C) Refinancings
D) Home Improvement Loans
Number
Average Value
Number
Average Value
Number
Average Value
Number
Average Value
LOANS ORIGINATED
2
$136,310
9
$104,743
5
$72,086
1
$16,540
APPLICATIONS APPROVED, NOT ACCEPTED
0
$0
1
$24,540
1
$21,550
0
$0
APPLICATIONS DENIED
0
$0
4
$55,485
4
$91,815
1
$9,820
APPLICATIONS WITHDRAWN
0
$0
1
$46,730
1
$105,850
0
$0
FILES CLOSED FOR INCOMPLETENESS
0
$0
0
$0
1
$74,690
0
$0
Aggregated Statistics For Year 1999 (Based on 2 partial tracts)
A) FHA, FSA/RHS & VA Home Purchase Loans
B) Conventional Home Purchase Loans
C) Refinancings
D) Home Improvement Loans
F) Non-occupant Loans on < 5 Family Dwellings (A B C & D)


 Nearest zip codes: 35080, 35007, 35115, 35244, 35022, 35187.


 (Students: 992, Location: 8568 HIGHWAY 17, Grades: KG-3)