Helena, Alabama Submit your own pictures of this city and show them to the world
OSM Map
General Map
Google Map
MSN Map
OSM Map
General Map
Google Map
MSN Map
OSM Map
General Map
Google Map
MSN Map
OSM Map
General Map
Google Map
MSN Map
Please wait while loading the map...
Population in 2022: 21,862 (91% urban, 9% rural). Population change since 2000: +112.3%Males: 10,432 Females: 11,430
March 2022 cost of living index in Helena: 88.0 (less than average, U.S. average is 100) Percentage of residents living in poverty in 2022: 3.5%for White Non-Hispanic residents , 3.5% for Black residents , 12.4% for Hispanic or Latino residents , 19.3% for other race residents , 4.6% for two or more races residents )
Profiles of local businesses
Business Search - 14 Million verified businesses
Data:
Median household income ($)
Median household income (% change since 2000)
Household income diversity
Ratio of average income to average house value (%)
Ratio of average income to average rent
Median household income ($) - White
Median household income ($) - Black or African American
Median household income ($) - Asian
Median household income ($) - Hispanic or Latino
Median household income ($) - American Indian and Alaska Native
Median household income ($) - Multirace
Median household income ($) - Other Race
Median household income for houses/condos with a mortgage ($)
Median household income for apartments without a mortgage ($)
Races - White alone (%)
Races - White alone (% change since 2000)
Races - Black alone (%)
Races - Black alone (% change since 2000)
Races - American Indian alone (%)
Races - American Indian alone (% change since 2000)
Races - Asian alone (%)
Races - Asian alone (% change since 2000)
Races - Hispanic (%)
Races - Hispanic (% change since 2000)
Races - Native Hawaiian and Other Pacific Islander alone (%)
Races - Native Hawaiian and Other Pacific Islander alone (% change since 2000)
Races - Two or more races (%)
Races - Two or more races (% change since 2000)
Races - Other race alone (%)
Races - Other race alone (% change since 2000)
Racial diversity
Unemployment (%)
Unemployment (% change since 2000)
Unemployment (%) - White
Unemployment (%) - Black or African American
Unemployment (%) - Asian
Unemployment (%) - Hispanic or Latino
Unemployment (%) - American Indian and Alaska Native
Unemployment (%) - Multirace
Unemployment (%) - Other Race
Population density (people per square mile)
Population - Males (%)
Population - Females (%)
Population - Males (%) - White
Population - Males (%) - Black or African American
Population - Males (%) - Asian
Population - Males (%) - Hispanic or Latino
Population - Males (%) - American Indian and Alaska Native
Population - Males (%) - Multirace
Population - Males (%) - Other Race
Population - Females (%) - White
Population - Females (%) - Black or African American
Population - Females (%) - Asian
Population - Females (%) - Hispanic or Latino
Population - Females (%) - American Indian and Alaska Native
Population - Females (%) - Multirace
Population - Females (%) - Other Race
Coronavirus confirmed cases (May 12, 2024)
Deaths caused by coronavirus (May 12, 2024)
Coronavirus confirmed cases (per 100k population) (May 12, 2024)
Deaths caused by coronavirus (per 100k population) (May 12, 2024)
Daily increase in number of cases (May 12, 2024)
Weekly increase in number of cases (May 12, 2024)
Cases doubled (in days) (May 12, 2024)
Hospitalized patients (Apr 18, 2022)
Negative test results (Apr 18, 2022)
Total test results (Apr 18, 2022)
COVID Vaccine doses distributed (per 100k population) (Sep 19, 2023)
COVID Vaccine doses administered (per 100k population) (Sep 19, 2023)
COVID Vaccine doses distributed (Sep 19, 2023)
COVID Vaccine doses administered (Sep 19, 2023)
Likely homosexual households (%)
Likely homosexual households (% change since 2000)
Likely homosexual households - Lesbian couples (%)
Likely homosexual households - Lesbian couples (% change since 2000)
Likely homosexual households - Gay men (%)
Likely homosexual households - Gay men (% change since 2000)
Cost of living index
Median gross rent ($)
Median contract rent ($)
Median monthly housing costs ($)
Median house or condo value ($)
Median house or condo value ($ change since 2000)
Mean house or condo value by units in structure - 1, detached ($)
Mean house or condo value by units in structure - 1, attached ($)
Mean house or condo value by units in structure - 2 ($)
Mean house or condo value by units in structure by units in structure - 3 or 4 ($)
Mean house or condo value by units in structure - 5 or more ($)
Mean house or condo value by units in structure - Boat, RV, van, etc. ($)
Mean house or condo value by units in structure - Mobile home ($)
Median house or condo value ($) - White
Median house or condo value ($) - Black or African American
Median house or condo value ($) - Asian
Median house or condo value ($) - Hispanic or Latino
Median house or condo value ($) - American Indian and Alaska Native
Median house or condo value ($) - Multirace
Median house or condo value ($) - Other Race
Median resident age
Resident age diversity
Median resident age - Males
Median resident age - Females
Median resident age - White
Median resident age - Black or African American
Median resident age - Asian
Median resident age - Hispanic or Latino
Median resident age - American Indian and Alaska Native
Median resident age - Multirace
Median resident age - Other Race
Median resident age - Males - White
Median resident age - Males - Black or African American
Median resident age - Males - Asian
Median resident age - Males - Hispanic or Latino
Median resident age - Males - American Indian and Alaska Native
Median resident age - Males - Multirace
Median resident age - Males - Other Race
Median resident age - Females - White
Median resident age - Females - Black or African American
Median resident age - Females - Asian
Median resident age - Females - Hispanic or Latino
Median resident age - Females - American Indian and Alaska Native
Median resident age - Females - Multirace
Median resident age - Females - Other Race
Commute - mean travel time to work (minutes)
Travel time to work - Less than 5 minutes (%)
Travel time to work - Less than 5 minutes (% change since 2000)
Travel time to work - 5 to 9 minutes (%)
Travel time to work - 5 to 9 minutes (% change since 2000)
Travel time to work - 10 to 19 minutes (%)
Travel time to work - 10 to 19 minutes (% change since 2000)
Travel time to work - 20 to 29 minutes (%)
Travel time to work - 20 to 29 minutes (% change since 2000)
Travel time to work - 30 to 39 minutes (%)
Travel time to work - 30 to 39 minutes (% change since 2000)
Travel time to work - 40 to 59 minutes (%)
Travel time to work - 40 to 59 minutes (% change since 2000)
Travel time to work - 60 to 89 minutes (%)
Travel time to work - 60 to 89 minutes (% change since 2000)
Travel time to work - 90 or more minutes (%)
Travel time to work - 90 or more minutes (% change since 2000)
Marital status - Never married (%)
Marital status - Now married (%)
Marital status - Separated (%)
Marital status - Widowed (%)
Marital status - Divorced (%)
Median family income ($)
Median family income (% change since 2000)
Median non-family income ($)
Median non-family income (% change since 2000)
Median per capita income ($)
Median per capita income (% change since 2000)
Median family income ($) - White
Median family income ($) - Black or African American
Median family income ($) - Asian
Median family income ($) - Hispanic or Latino
Median family income ($) - American Indian and Alaska Native
Median family income ($) - Multirace
Median family income ($) - Other Race
Median year house/condo built
Median year apartment built
Year house built - Built 2005 or later (%)
Year house built - Built 2000 to 2004 (%)
Year house built - Built 1990 to 1999 (%)
Year house built - Built 1980 to 1989 (%)
Year house built - Built 1970 to 1979 (%)
Year house built - Built 1960 to 1969 (%)
Year house built - Built 1950 to 1959 (%)
Year house built - Built 1940 to 1949 (%)
Year house built - Built 1939 or earlier (%)
Average household size
Household density (households per square mile)
Average household size - White
Average household size - Black or African American
Average household size - Asian
Average household size - Hispanic or Latino
Average household size - American Indian and Alaska Native
Average household size - Multirace
Average household size - Other Race
Occupied housing units (%)
Vacant housing units (%)
Owner occupied housing units (%)
Renter occupied housing units (%)
Vacancy status - For rent (%)
Vacancy status - For sale only (%)
Vacancy status - Rented or sold, not occupied (%)
Vacancy status - For seasonal, recreational, or occasional use (%)
Vacancy status - For migrant workers (%)
Vacancy status - Other vacant (%)
Residents with income below the poverty level (%)
Residents with income below 50% of the poverty level (%)
Children below poverty level (%)
Poor families by family type - Married-couple family (%)
Poor families by family type - Male, no wife present (%)
Poor families by family type - Female, no husband present (%)
Poverty status for native-born residents (%)
Poverty status for foreign-born residents (%)
Poverty among high school graduates not in families (%)
Poverty among people who did not graduate high school not in families (%)
Residents with income below the poverty level (%) - White
Residents with income below the poverty level (%) - Black or African American
Residents with income below the poverty level (%) - Asian
Residents with income below the poverty level (%) - Hispanic or Latino
Residents with income below the poverty level (%) - American Indian and Alaska Native
Residents with income below the poverty level (%) - Multirace
Residents with income below the poverty level (%) - Other Race
Air pollution - Air Quality Index (AQI)
Air pollution - CO
Air pollution - NO2
Air pollution - SO2
Air pollution - Ozone
Air pollution - PM10
Air pollution - PM25
Air pollution - Pb
Crime - Murders per 100,000 population
Crime - Rapes per 100,000 population
Crime - Robberies per 100,000 population
Crime - Assaults per 100,000 population
Crime - Burglaries per 100,000 population
Crime - Thefts per 100,000 population
Crime - Auto thefts per 100,000 population
Crime - Arson per 100,000 population
Crime - City-data.com crime index
Crime - Violent crime index
Crime - Property crime index
Crime - Murders per 100,000 population (5 year average)
Crime - Rapes per 100,000 population (5 year average)
Crime - Robberies per 100,000 population (5 year average)
Crime - Assaults per 100,000 population (5 year average)
Crime - Burglaries per 100,000 population (5 year average)
Crime - Thefts per 100,000 population (5 year average)
Crime - Auto thefts per 100,000 population (5 year average)
Crime - Arson per 100,000 population (5 year average)
Crime - City-data.com crime index (5 year average)
Crime - Violent crime index (5 year average)
Crime - Property crime index (5 year average)
1996 Presidential Elections Results (%) - Democratic Party (Clinton)
1996 Presidential Elections Results (%) - Republican Party (Dole)
1996 Presidential Elections Results (%) - Other
2000 Presidential Elections Results (%) - Democratic Party (Gore)
2000 Presidential Elections Results (%) - Republican Party (Bush)
2000 Presidential Elections Results (%) - Other
2004 Presidential Elections Results (%) - Democratic Party (Kerry)
2004 Presidential Elections Results (%) - Republican Party (Bush)
2004 Presidential Elections Results (%) - Other
2008 Presidential Elections Results (%) - Democratic Party (Obama)
2008 Presidential Elections Results (%) - Republican Party (McCain)
2008 Presidential Elections Results (%) - Other
2012 Presidential Elections Results (%) - Democratic Party (Obama)
2012 Presidential Elections Results (%) - Republican Party (Romney)
2012 Presidential Elections Results (%) - Other
2016 Presidential Elections Results (%) - Democratic Party (Clinton)
2016 Presidential Elections Results (%) - Republican Party (Trump)
2016 Presidential Elections Results (%) - Other
2020 Presidential Elections Results (%) - Democratic Party (Biden)
2020 Presidential Elections Results (%) - Republican Party (Trump)
2020 Presidential Elections Results (%) - Other
Ancestries Reported - Arab (%)
Ancestries Reported - Czech (%)
Ancestries Reported - Danish (%)
Ancestries Reported - Dutch (%)
Ancestries Reported - English (%)
Ancestries Reported - French (%)
Ancestries Reported - French Canadian (%)
Ancestries Reported - German (%)
Ancestries Reported - Greek (%)
Ancestries Reported - Hungarian (%)
Ancestries Reported - Irish (%)
Ancestries Reported - Italian (%)
Ancestries Reported - Lithuanian (%)
Ancestries Reported - Norwegian (%)
Ancestries Reported - Polish (%)
Ancestries Reported - Portuguese (%)
Ancestries Reported - Russian (%)
Ancestries Reported - Scotch-Irish (%)
Ancestries Reported - Scottish (%)
Ancestries Reported - Slovak (%)
Ancestries Reported - Subsaharan African (%)
Ancestries Reported - Swedish (%)
Ancestries Reported - Swiss (%)
Ancestries Reported - Ukrainian (%)
Ancestries Reported - United States (%)
Ancestries Reported - Welsh (%)
Ancestries Reported - West Indian (%)
Ancestries Reported - Other (%)
Educational Attainment - No schooling completed (%)
Educational Attainment - Less than high school (%)
Educational Attainment - High school or equivalent (%)
Educational Attainment - Less than 1 year of college (%)
Educational Attainment - 1 or more years of college (%)
Educational Attainment - Associate degree (%)
Educational Attainment - Bachelor's degree (%)
Educational Attainment - Master's degree (%)
Educational Attainment - Professional school degree (%)
Educational Attainment - Doctorate degree (%)
School Enrollment - Nursery, preschool (%)
School Enrollment - Kindergarten (%)
School Enrollment - Grade 1 to 4 (%)
School Enrollment - Grade 5 to 8 (%)
School Enrollment - Grade 9 to 12 (%)
School Enrollment - College undergrad (%)
School Enrollment - Graduate or professional (%)
School Enrollment - Not enrolled in school (%)
School enrollment - Public schools (%)
School enrollment - Private schools (%)
School enrollment - Not enrolled (%)
Median number of rooms in houses and condos
Median number of rooms in apartments
Housing units lacking complete plumbing facilities (%)
Housing units lacking complete kitchen facilities (%)
Density of houses
Urban houses (%)
Rural houses (%)
Households with people 60 years and over (%)
Households with people 65 years and over (%)
Households with people 75 years and over (%)
Households with one or more nonrelatives (%)
Households with no nonrelatives (%)
Population in households (%)
Family households (%)
Nonfamily households (%)
Population in families (%)
Family households with own children (%)
Median number of bedrooms in owner occupied houses
Mean number of bedrooms in owner occupied houses
Median number of bedrooms in renter occupied houses
Mean number of bedrooms in renter occupied houses
Median number of vehichles in owner occupied houses
Mean number of vehichles in owner occupied houses
Median number of vehichles in renter occupied houses
Mean number of vehichles in renter occupied houses
Mortgage status - with mortgage (%)
Mortgage status - with second mortgage (%)
Mortgage status - with home equity loan (%)
Mortgage status - with both second mortgage and home equity loan (%)
Mortgage status - without a mortgage (%)
Average family size
Average family size - White
Average family size - Black or African American
Average family size - Asian
Average family size - Hispanic or Latino
Average family size - American Indian and Alaska Native
Average family size - Multirace
Average family size - Other Race
Geographical mobility - Same house 1 year ago (%)
Geographical mobility - Moved within same county (%)
Geographical mobility - Moved from different county within same state (%)
Geographical mobility - Moved from different state (%)
Geographical mobility - Moved from abroad (%)
Place of birth - Born in state of residence (%)
Place of birth - Born in other state (%)
Place of birth - Native, outside of US (%)
Place of birth - Foreign born (%)
Housing units in structures - 1, detached (%)
Housing units in structures - 1, attached (%)
Housing units in structures - 2 (%)
Housing units in structures - 3 or 4 (%)
Housing units in structures - 5 to 9 (%)
Housing units in structures - 10 to 19 (%)
Housing units in structures - 20 to 49 (%)
Housing units in structures - 50 or more (%)
Housing units in structures - Mobile home (%)
Housing units in structures - Boat, RV, van, etc. (%)
House/condo owner moved in on average (years ago)
Renter moved in on average (years ago)
Year householder moved into unit - Moved in 1999 to March 2000 (%)
Year householder moved into unit - Moved in 1995 to 1998 (%)
Year householder moved into unit - Moved in 1990 to 1994 (%)
Year householder moved into unit - Moved in 1980 to 1989 (%)
Year householder moved into unit - Moved in 1970 to 1979 (%)
Year householder moved into unit - Moved in 1969 or earlier (%)
Means of transportation to work - Drove car alone (%)
Means of transportation to work - Carpooled (%)
Means of transportation to work - Public transportation (%)
Means of transportation to work - Bus or trolley bus (%)
Means of transportation to work - Streetcar or trolley car (%)
Means of transportation to work - Subway or elevated (%)
Means of transportation to work - Railroad (%)
Means of transportation to work - Ferryboat (%)
Means of transportation to work - Taxicab (%)
Means of transportation to work - Motorcycle (%)
Means of transportation to work - Bicycle (%)
Means of transportation to work - Walked (%)
Means of transportation to work - Other means (%)
Working at home (%)
Industry diversity
Most Common Industries - Agriculture, forestry, fishing and hunting, and mining (%)
Most Common Industries - Agriculture, forestry, fishing and hunting (%)
Most Common Industries - Mining, quarrying, and oil and gas extraction (%)
Most Common Industries - Construction (%)
Most Common Industries - Manufacturing (%)
Most Common Industries - Wholesale trade (%)
Most Common Industries - Retail trade (%)
Most Common Industries - Transportation and warehousing, and utilities (%)
Most Common Industries - Transportation and warehousing (%)
Most Common Industries - Utilities (%)
Most Common Industries - Information (%)
Most Common Industries - Finance and insurance, and real estate and rental and leasing (%)
Most Common Industries - Finance and insurance (%)
Most Common Industries - Real estate and rental and leasing (%)
Most Common Industries - Professional, scientific, and management, and administrative and waste management services (%)
Most Common Industries - Professional, scientific, and technical services (%)
Most Common Industries - Management of companies and enterprises (%)
Most Common Industries - Administrative and support and waste management services (%)
Most Common Industries - Educational services, and health care and social assistance (%)
Most Common Industries - Educational services (%)
Most Common Industries - Health care and social assistance (%)
Most Common Industries - Arts, entertainment, and recreation, and accommodation and food services (%)
Most Common Industries - Arts, entertainment, and recreation (%)
Most Common Industries - Accommodation and food services (%)
Most Common Industries - Other services, except public administration (%)
Most Common Industries - Public administration (%)
Occupation diversity
Most Common Occupations - Management, business, science, and arts occupations (%)
Most Common Occupations - Management, business, and financial occupations (%)
Most Common Occupations - Management occupations (%)
Most Common Occupations - Business and financial operations occupations (%)
Most Common Occupations - Computer, engineering, and science occupations (%)
Most Common Occupations - Computer and mathematical occupations (%)
Most Common Occupations - Architecture and engineering occupations (%)
Most Common Occupations - Life, physical, and social science occupations (%)
Most Common Occupations - Education, legal, community service, arts, and media occupations (%)
Most Common Occupations - Community and social service occupations (%)
Most Common Occupations - Legal occupations (%)
Most Common Occupations - Education, training, and library occupations (%)
Most Common Occupations - Arts, design, entertainment, sports, and media occupations (%)
Most Common Occupations - Healthcare practitioners and technical occupations (%)
Most Common Occupations - Health diagnosing and treating practitioners and other technical occupations (%)
Most Common Occupations - Health technologists and technicians (%)
Most Common Occupations - Service occupations (%)
Most Common Occupations - Healthcare support occupations (%)
Most Common Occupations - Protective service occupations (%)
Most Common Occupations - Fire fighting and prevention, and other protective service workers including supervisors (%)
Most Common Occupations - Law enforcement workers including supervisors (%)
Most Common Occupations - Food preparation and serving related occupations (%)
Most Common Occupations - Building and grounds cleaning and maintenance occupations (%)
Most Common Occupations - Personal care and service occupations (%)
Most Common Occupations - Sales and office occupations (%)
Most Common Occupations - Sales and related occupations (%)
Most Common Occupations - Office and administrative support occupations (%)
Most Common Occupations - Natural resources, construction, and maintenance occupations (%)
Most Common Occupations - Farming, fishing, and forestry occupations (%)
Most Common Occupations - Construction and extraction occupations (%)
Most Common Occupations - Installation, maintenance, and repair occupations (%)
Most Common Occupations - Production, transportation, and material moving occupations (%)
Most Common Occupations - Production occupations (%)
Most Common Occupations - Transportation occupations (%)
Most Common Occupations - Material moving occupations (%)
People in Group quarters - Institutionalized population (%)
People in Group quarters - Correctional institutions (%)
People in Group quarters - Federal prisons and detention centers (%)
People in Group quarters - Halfway houses (%)
People in Group quarters - Local jails and other confinement facilities (including police lockups) (%)
People in Group quarters - Military disciplinary barracks (%)
People in Group quarters - State prisons (%)
People in Group quarters - Other types of correctional institutions (%)
People in Group quarters - Nursing homes (%)
People in Group quarters - Hospitals/wards, hospices, and schools for the handicapped (%)
People in Group quarters - Hospitals/wards and hospices for chronically ill (%)
People in Group quarters - Hospices or homes for chronically ill (%)
People in Group quarters - Military hospitals or wards for chronically ill (%)
People in Group quarters - Other hospitals or wards for chronically ill (%)
People in Group quarters - Hospitals or wards for drug/alcohol abuse (%)
People in Group quarters - Mental (Psychiatric) hospitals or wards (%)
People in Group quarters - Schools, hospitals, or wards for the mentally retarded (%)
People in Group quarters - Schools, hospitals, or wards for the physically handicapped (%)
People in Group quarters - Institutions for the deaf (%)
People in Group quarters - Institutions for the blind (%)
People in Group quarters - Orthopedic wards and institutions for the physically handicapped (%)
People in Group quarters - Wards in general hospitals for patients who have no usual home elsewhere (%)
People in Group quarters - Wards in military hospitals for patients who have no usual home elsewhere (%)
People in Group quarters - Juvenile institutions (%)
People in Group quarters - Long-term care (%)
People in Group quarters - Homes for abused, dependent, and neglected children (%)
People in Group quarters - Residential treatment centers for emotionally disturbed children (%)
People in Group quarters - Training schools for juvenile delinquents (%)
People in Group quarters - Short-term care, detention or diagnostic centers for delinquent children (%)
People in Group quarters - Type of juvenile institution unknown (%)
People in Group quarters - Noninstitutionalized population (%)
People in Group quarters - College dormitories (includes college quarters off campus) (%)
People in Group quarters - Military quarters (%)
People in Group quarters - On base (%)
People in Group quarters - Barracks, unaccompanied personnel housing (UPH), (Enlisted/Officer), ;and similar group living quarters for military personnel (%)
People in Group quarters - Transient quarters for temporary residents (%)
People in Group quarters - Military ships (%)
People in Group quarters - Group homes (%)
People in Group quarters - Homes or halfway houses for drug/alcohol abuse (%)
People in Group quarters - Homes for the mentally ill (%)
People in Group quarters - Homes for the mentally retarded (%)
People in Group quarters - Homes for the physically handicapped (%)
People in Group quarters - Other group homes (%)
People in Group quarters - Religious group quarters (%)
People in Group quarters - Dormitories (%)
People in Group quarters - Agriculture workers' dormitories on farms (%)
People in Group quarters - Job Corps and vocational training facilities (%)
People in Group quarters - Other workers' dormitories (%)
People in Group quarters - Crews of maritime vessels (%)
People in Group quarters - Other nonhousehold living situations (%)
People in Group quarters - Other noninstitutional group quarters (%)
Residents speaking English at home (%)
Residents speaking English at home - Born in the United States (%)
Residents speaking English at home - Native, born elsewhere (%)
Residents speaking English at home - Foreign born (%)
Residents speaking Spanish at home (%)
Residents speaking Spanish at home - Born in the United States (%)
Residents speaking Spanish at home - Native, born elsewhere (%)
Residents speaking Spanish at home - Foreign born (%)
Residents speaking other language at home (%)
Residents speaking other language at home - Born in the United States (%)
Residents speaking other language at home - Native, born elsewhere (%)
Residents speaking other language at home - Foreign born (%)
Class of Workers - Employee of private company (%)
Class of Workers - Self-employed in own incorporated business (%)
Class of Workers - Private not-for-profit wage and salary workers (%)
Class of Workers - Local government workers (%)
Class of Workers - State government workers (%)
Class of Workers - Federal government workers (%)
Class of Workers - Self-employed workers in own not incorporated business and Unpaid family workers (%)
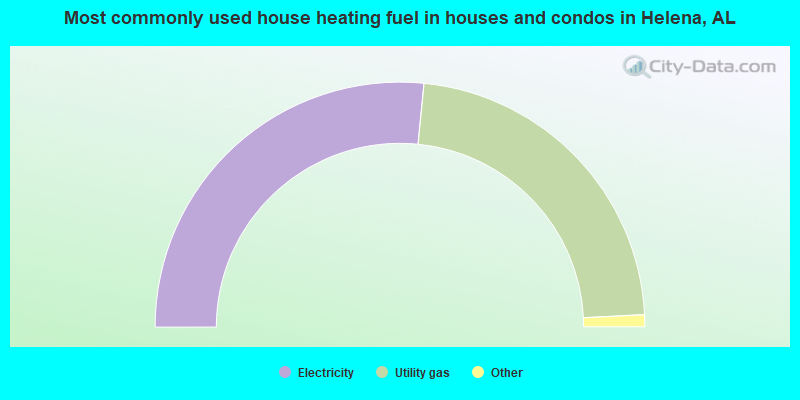
House heating fuel used in houses and condos - Utility gas (%)
House heating fuel used in houses and condos - Bottled, tank, or LP gas (%)
House heating fuel used in houses and condos - Electricity (%)
House heating fuel used in houses and condos - Fuel oil, kerosene, etc. (%)
House heating fuel used in houses and condos - Coal or coke (%)
House heating fuel used in houses and condos - Wood (%)
House heating fuel used in houses and condos - Solar energy (%)
House heating fuel used in houses and condos - Other fuel (%)
House heating fuel used in houses and condos - No fuel used (%)
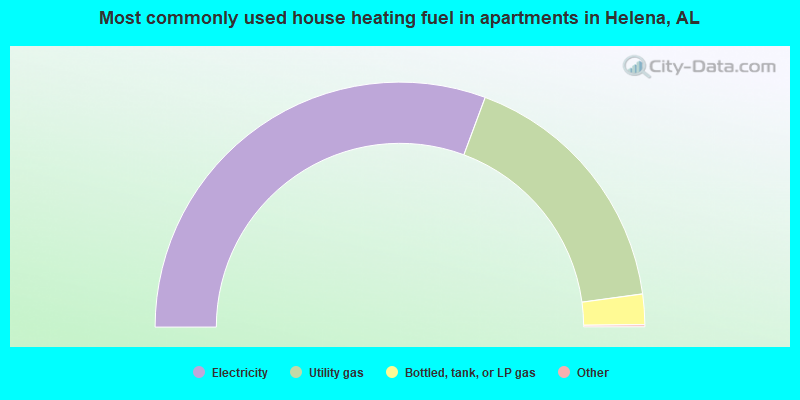
House heating fuel used in apartments - Utility gas (%)
House heating fuel used in apartments - Bottled, tank, or LP gas (%)
House heating fuel used in apartments - Electricity (%)
House heating fuel used in apartments - Fuel oil, kerosene, etc. (%)
House heating fuel used in apartments - Coal or coke (%)
House heating fuel used in apartments - Wood (%)
House heating fuel used in apartments - Solar energy (%)
House heating fuel used in apartments - Other fuel (%)
House heating fuel used in apartments - No fuel used (%)
Armed forces status - In Armed Forces (%)
Armed forces status - Civilian (%)
Armed forces status - Civilian - Veteran (%)
Armed forces status - Civilian - Nonveteran (%)
Fatal accidents locations in years 2005-2021
Fatal accidents locations in 2005
Fatal accidents locations in 2006
Fatal accidents locations in 2007
Fatal accidents locations in 2008
Fatal accidents locations in 2009
Fatal accidents locations in 2010
Fatal accidents locations in 2011
Fatal accidents locations in 2012
Fatal accidents locations in 2013
Fatal accidents locations in 2014
Fatal accidents locations in 2015
Fatal accidents locations in 2016
Fatal accidents locations in 2017
Fatal accidents locations in 2018
Fatal accidents locations in 2019
Fatal accidents locations in 2020
Fatal accidents locations in 2021
Alcohol use - People drinking some alcohol every month (%)
Alcohol use - People not drinking at all (%)
Alcohol use - Average days/month drinking alcohol
Alcohol use - Average drinks/week
Alcohol use - Average days/year people drink much
Audiometry - Average condition of hearing (%)
Audiometry - People that can hear a whisper from across a quiet room (%)
Audiometry - People that can hear normal voice from across a quiet room (%)
Audiometry - Ears ringing, roaring, buzzing (%)
Audiometry - Had a job exposure to loud noise (%)
Audiometry - Had off-work exposure to loud noise (%)
Blood Pressure & Cholesterol - Has high blood pressure (%)
Blood Pressure & Cholesterol - Checking blood pressure at home (%)
Blood Pressure & Cholesterol - Frequently checking blood cholesterol (%)
Blood Pressure & Cholesterol - Has high cholesterol level (%)
Consumer Behavior - Money monthly spent on food at supermarket/grocery store
Consumer Behavior - Money monthly spent on food at other stores
Consumer Behavior - Money monthly spent on eating out
Consumer Behavior - Money monthly spent on carryout/delivered foods
Consumer Behavior - Income spent on food at supermarket/grocery store (%)
Consumer Behavior - Income spent on food at other stores (%)
Consumer Behavior - Income spent on eating out (%)
Consumer Behavior - Income spent on carryout/delivered foods (%)
Current Health Status - General health condition (%)
Current Health Status - Blood donors (%)
Current Health Status - Has blood ever tested for HIV virus (%)
Current Health Status - Left-handed people (%)
Dermatology - People using sunscreen (%)
Diabetes - Diabetics (%)
Diabetes - Had a blood test for high blood sugar (%)
Diabetes - People taking insulin (%)
Diet Behavior & Nutrition - Diet health (%)
Diet Behavior & Nutrition - Milk product consumption (# of products/month)
Diet Behavior & Nutrition - Meals not home prepared (#/week)
Diet Behavior & Nutrition - Meals from fast food or pizza place (#/week)
Diet Behavior & Nutrition - Ready-to-eat foods (#/month)
Diet Behavior & Nutrition - Frozen meals/pizza (#/month)
Drug Use - People that ever used marijuana or hashish (%)
Drug Use - Ever used hard drugs (%)
Drug Use - Ever used any form of cocaine (%)
Drug Use - Ever used heroin (%)
Drug Use - Ever used methamphetamine (%)
Health Insurance - People covered by health insurance (%)
Kidney Conditions-Urology - Avg. # of times urinating at night
Medical Conditions - People with asthma (%)
Medical Conditions - People with anemia (%)
Medical Conditions - People with psoriasis (%)
Medical Conditions - People with overweight (%)
Medical Conditions - Elderly people having difficulties in thinking or remembering (%)
Medical Conditions - People who ever received blood transfusion (%)
Medical Conditions - People having trouble seeing even with glass/contacts (%)
Medical Conditions - People with arthritis (%)
Medical Conditions - People with gout (%)
Medical Conditions - People with congestive heart failure (%)
Medical Conditions - People with coronary heart disease (%)
Medical Conditions - People with angina pectoris (%)
Medical Conditions - People who ever had heart attack (%)
Medical Conditions - People who ever had stroke (%)
Medical Conditions - People with emphysema (%)
Medical Conditions - People with thyroid problem (%)
Medical Conditions - People with chronic bronchitis (%)
Medical Conditions - People with any liver condition (%)
Medical Conditions - People who ever had cancer or malignancy (%)
Mental Health - People who have little interest in doing things (%)
Mental Health - People feeling down, depressed, or hopeless (%)
Mental Health - People who have trouble sleeping or sleeping too much (%)
Mental Health - People feeling tired or having little energy (%)
Mental Health - People with poor appetite or overeating (%)
Mental Health - People feeling bad about themself (%)
Mental Health - People who have trouble concentrating on things (%)
Mental Health - People moving or speaking slowly or too fast (%)
Mental Health - People having thoughts they would be better off dead (%)
Oral Health - Average years since last visit a dentist
Oral Health - People embarrassed because of mouth (%)
Oral Health - People with gum disease (%)
Oral Health - General health of teeth and gums (%)
Oral Health - Average days a week using dental floss/device
Oral Health - Average days a week using mouthwash for dental problem
Oral Health - Average number of teeth
Pesticide Use - Households using pesticides to control insects (%)
Pesticide Use - Households using pesticides to kill weeds (%)
Physical Activity - People doing vigorous-intensity work activities (%)
Physical Activity - People doing moderate-intensity work activities (%)
Physical Activity - People walking or bicycling (%)
Physical Activity - People doing vigorous-intensity recreational activities (%)
Physical Activity - People doing moderate-intensity recreational activities (%)
Physical Activity - Average hours a day doing sedentary activities
Physical Activity - Average hours a day watching TV or videos
Physical Activity - Average hours a day using computer
Physical Functioning - People having limitations keeping them from working (%)
Physical Functioning - People limited in amount of work they can do (%)
Physical Functioning - People that need special equipment to walk (%)
Physical Functioning - People experiencing confusion/memory problems (%)
Physical Functioning - People requiring special healthcare equipment (%)
Prescription Medications - Average number of prescription medicines taking
Preventive Aspirin Use - Adults 40+ taking low-dose aspirin (%)
Reproductive Health - Vaginal deliveries (%)
Reproductive Health - Cesarean deliveries (%)
Reproductive Health - Deliveries resulted in a live birth (%)
Reproductive Health - Pregnancies resulted in a delivery (%)
Reproductive Health - Women breastfeeding newborns (%)
Reproductive Health - Women that had a hysterectomy (%)
Reproductive Health - Women that had both ovaries removed (%)
Reproductive Health - Women that have ever taken birth control pills (%)
Reproductive Health - Women taking birth control pills (%)
Reproductive Health - Women that have ever used Depo-Provera or injectables (%)
Reproductive Health - Women that have ever used female hormones (%)
Sexual Behavior - People 18+ that ever had sex (vaginal, anal, or oral) (%)
Sexual Behavior - Males 18+ that ever had vaginal sex with a woman (%)
Sexual Behavior - Males 18+ that ever performed oral sex on a woman (%)
Sexual Behavior - Males 18+ that ever had anal sex with a woman (%)
Sexual Behavior - Males 18+ that ever had any sex with a man (%)
Sexual Behavior - Females 18+ that ever had vaginal sex with a man (%)
Sexual Behavior - Females 18+ that ever performed oral sex on a man (%)
Sexual Behavior - Females 18+ that ever had anal sex with a man (%)
Sexual Behavior - Females 18+ that ever had any kind of sex with a woman (%)
Sexual Behavior - Average age people first had sex
Sexual Behavior - Average number of female sex partners in lifetime (males 18+)
Sexual Behavior - Average number of female vaginal sex partners in lifetime (males 18+)
Sexual Behavior - Average age people first performed oral sex on a woman (18+)
Sexual Behavior - Average number of woman performed oral sex on in lifetime (18+)
Sexual Behavior - Average number of male sex partners in lifetime (males 18+)
Sexual Behavior - Average number of male anal sex partners in lifetime (males 18+)
Sexual Behavior - Average age people first performed oral sex on a man (18+)
Sexual Behavior - Average number of male oral sex partners in lifetime (18+)
Sexual Behavior - People using protection when performing oral sex (%)
Sexual Behavior - Average number of times people have vaginal or anal sex a year
Sexual Behavior - People having sex without condom (%)
Sexual Behavior - Average number of male sex partners in lifetime (females 18+)
Sexual Behavior - Average number of male vaginal sex partners in lifetime (females 18+)
Sexual Behavior - Average number of female sex partners in lifetime (females 18+)
Sexual Behavior - Circumcised males 18+ (%)
Sleep Disorders - Average hours sleeping at night
Sleep Disorders - People that has trouble sleeping (%)
Smoking-Cigarette Use - People smoking cigarettes (%)
Taste & Smell - People 40+ having problems with smell (%)
Taste & Smell - People 40+ having problems with taste (%)
Taste & Smell - People 40+ that ever had wisdom teeth removed (%)
Taste & Smell - People 40+ that ever had tonsils teeth removed (%)
Taste & Smell - People 40+ that ever had a loss of consciousness because of a head injury (%)
Taste & Smell - People 40+ that ever had a broken nose or other serious injury to face or skull (%)
Taste & Smell - People 40+ that ever had two or more sinus infections (%)
Weight - Average height (inches)
Weight - Average weight (pounds)
Weight - Average BMI
Weight - People that are obese (%)
Weight - People that ever were obese (%)
Weight - People trying to lose weight (%)
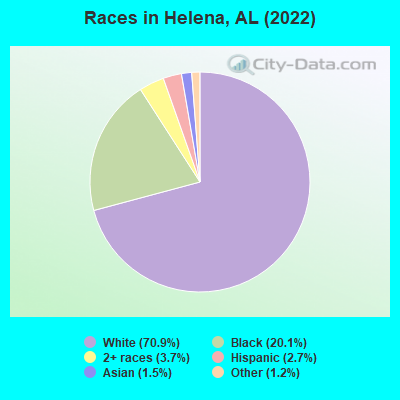
15,320 70.9% White alone 4,345 20.1% Black alone 794 3.7% Two or more races 586 2.7% Hispanic 322 1.5% Asian alone 264 1.2% Other race alone
According to our research of Alabama and other state lists, there were 8 registered sex offenders living in Helena, Alabama as of May 13, 2024 . The ratio of all residents to sex offenders in Helena is 2,214 to 1.The ratio of registered sex offenders to all residents in this city is much lower than the state average.
Officers per 1,000 residents here:
1.45Alabama average:
2.40
Latest news from Helena, AL collected exclusively by city-data.com from local newspapers, TV, and radio stations
Ancestries: American (15.3%), English (12.7%), Irish (8.0%), Italian (3.1%), German (2.7%), Scotch-Irish (2.2%).
Current Local Time:
Land area: 17.1 square miles.
Population density: 1,280 people per square mile (low).
588 residents are foreign born (1.2% Asia , 0.8% Latin America ).
This city:
2.7%Alabama:
3.5%
Median real estate property taxes paid for housing units with mortgages in 2022: $1,455 (0.4%)Median real estate property taxes paid for housing units with no mortgage in 2022: $917 (0.3%)
Nearest city with pop. 50,000+: Hoover, AL
Nearest city with pop. 200,000+: Birmingham, AL
Nearest city with pop. 1,000,000+: Houston, TX
Nearest cities:
Latitude: 33.28 N, Longitude: 86.86 W
Daytime population change due to commuting: -7,048 (-32.6%)Workers who live and work in this city: 3,181 (27.1%)
Area code commonly used in this area: 205
Single-family new house construction building permits:
2022: 81 buildings , average cost: $429,5002021: 154 buildings , average cost: $377,6002020: 205 buildings , average cost: $344,6002019: 186 buildings , average cost: $291,0002018: 158 buildings , average cost: $221,3002017: 200 buildings , average cost: $213,1002016: 181 buildings , average cost: $208,7002015: 184 buildings , average cost: $206,7002014: 153 buildings , average cost: $210,6002013: 123 buildings , average cost: $212,2002012: 56 buildings , average cost: $214,5002011: 18 buildings , average cost: $186,9002010: 22 buildings , average cost: $206,4002009: 29 buildings , average cost: $193,8002008: 49 buildings , average cost: $179,8002007: 169 buildings , average cost: $211,9002006: 177 buildings , average cost: $193,0002005: 242 buildings , average cost: $172,7002004: 353 buildings , average cost: $151,9002003: 157 buildings , average cost: $161,6002002: 202 buildings , average cost: $141,0002001: 204 buildings , average cost: $133,0002000: 187 buildings , average cost: $111,4001999: 300 buildings , average cost: $121,0001998: 475 buildings , average cost: $108,2001997: 273 buildings , average cost: $109,500Unemployment in December 2023:
Population change in the 1990s: +5,799 (+129.0%).
Most common occupations in Helena, AL (%)
Both Males Females
Sales representatives, services, wholesale and manufacturing (5.9%)
Other management occupations, except farmers and farm managers (5.7%)
Computer specialists (5.5%)
Other sales and related occupations, including supervisors (5.0%)
Registered nurses (3.9%)
Other office and administrative support workers, including supervisors (3.5%)
Retail sales workers, except cashiers (3.5%)
Computer specialists (8.4%)
Sales representatives, services, wholesale and manufacturing (7.9%)
Other sales and related occupations, including supervisors (6.4%)
Other management occupations, except farmers and farm managers (6.0%)
Top executives (4.6%)
Electrical equipment mechanics and other installation, maintenance, and repair workers, including supervisors (3.9%)
Retail sales workers, except cashiers (3.7%)
Registered nurses (7.5%)
Preschool, kindergarten, elementary, and middle school teachers (6.8%)
Secretaries and administrative assistants (6.6%)
Other management occupations, except farmers and farm managers (5.3%)
Health technologists and technicians (5.2%)
Other office and administrative support workers, including supervisors (4.7%)
Sales representatives, services, wholesale and manufacturing (3.7%)
Tornado activity:
Helena-area historical tornado activity is slightly above Alabama state average. It is 126% greater than the overall U.S. average.
On 4/4/1977, a category F5 (max. wind speeds 261-318 mph) tornado 17.2 miles away from the Helena city center killed 22 people and injured 130 people and caused between $5,000,000 and $50,000,000 in damages.
On 4/8/1998, a category F5 tornado 20.8 miles away from the city center killed 32 people and injured 259 people and caused $200 million in damages.
Earthquake activity:
Helena-area historical earthquake activity is significantly above Alabama state average. It is 122% greater than the overall U.S. average. On 1/18/1999 at 07:00:53, a magnitude 4.8 (4.8 MB, 4.0 LG, Depth: 0.6 mi, Class: Light, Intensity: IV - V) earthquake occurred 24.6 miles away from Helena center On 4/29/2003 at 08:59:39, a magnitude 4.9 (4.4 MB, 4.6 MW, 4.9 LG) earthquake occurred 109.6 miles away from the city center On 6/24/1975 at 11:11:36, a magnitude 4.5 (4.5 MB) earthquake occurred 64.4 miles away from the city center On 10/24/1997 at 08:35:17, a magnitude 4.9 (4.8 MB, 4.2 MS, 4.9 LG, Depth: 6.2 mi) earthquake occurred 151.1 miles away from the city center On 4/29/2003 at 08:59:39, a magnitude 4.6 (4.6 MW, Depth: 12.3 mi) earthquake occurred 109.6 miles away from the city center On 11/7/2004 at 11:20:21, a magnitude 4.3 (4.3 MW, Depth: 3.1 mi) earthquake occurred 76.2 miles away from Helena center Magnitude types: regional Lg-wave magnitude (LG), body-wave magnitude (MB), surface-wave magnitude (MS), moment magnitude (MW) Natural disasters: The number of natural disasters in Shelby County (19) is greater than the US average (15).Major Disasters (Presidential) Declared: 11Emergencies Declared: 6Storms: 10, Floods: 8, Tornadoes: 8, Hurricanes: 4, Winds: 3, Drought: 1, Fire: 1, Snowfall: 1, Winter Storm: 1, Other: 1 (Note: some incidents may be assigned to more than one category). Hospitals and medical centers near Helena: COMFORT CARE HOME HEALTH (Home Health Center, about 4 miles away; ALABASTER, AL)
NEW BEACON OF ALABASTER (Hospital, about 4 miles away; ALABASTER, AL)
FAMILY COMFORT HOSPICE OF ALABASTER (Hospital, about 4 miles away; ALABASTER, AL)
SHELBY RIDGE NURSING HOME (Nursing Home, about 4 miles away; ALABASTER, AL)
HELPING HANDS HOSPICE (Hospital, about 6 miles away; HOOVER, AL)
FMC CAHABA VALLEY (Dialysis Facility, about 6 miles away; PELHAM, AL)
GALLERIA WOODS SKILLED NURSING FACILITY (Nursing Home, about 7 miles away; BIRMINGHAM, AL)
Amtrak station near Helena: 17 miles: BIRMINGHAM (1819 MORRIS AVE.) Services: ticket office, partially wheelchair accessible, enclosed waiting area, public restrooms, public payphones, vending machines, paid short-term parking, paid long-term parking, call for taxi service.
Colleges/universities with over 2000 students nearest to Helena:
University of Montevallo (about 13 miles; Montevallo, AL ; Full-time enrollment: 2,826)
Lawson State Community College-Birmingham Campus (about 13 miles; Birmingham, AL ; FT enrollment: 2,695)
Samford University (about 14 miles; Birmingham, AL ; FT enrollment: 3,829)
Virginia College-Birmingham (about 14 miles; Birmingham, AL ; FT enrollment: 8,167)
University of Alabama at Birmingham (about 16 miles; Birmingham, AL ; FT enrollment: 14,853)
Jefferson State Community College (about 28 miles; Birmingham, AL ; FT enrollment: 6,041)
The University of Alabama (about 41 miles; Tuscaloosa, AL ; FT enrollment: 30,931)
Public high school in Helena: HELENA HIGH SCHOOL Location: 1310 HILLSBORO PARKWAY, Grades: 9-12)
Public elementary/middle schools in Helena:
See full list of schools located in Helena Library in Helena: HELENA - JANE B. HOLMES PUBLIC LIBRARY Operating income: $294,953; Location: 230 TUCKER ROAD; 25,429 books ; 3,341 audio materials ; 6,016 video materials ; 81 state licensed databases ; 2 other licensed databases ; 40 print serial subscriptions ; 23 electronic serial subscriptions )
Notable location: (A) . Display/hide its location on the map
Churches in Helena include: (A) , Mount Pleasant Baptist Church (B) , Shiloh Church (C) . Display/hide their locations on the map
Cemeteries: (1) , Shiloh Cemetery (2) , David Lindsay Cemetery (3) , Acton Cemetery (4) . Display/hide their locations on the map
Swamps: (A) . Display/hide its location on the map
Streams, rivers, and creeks: (A) , Lee Brook (B) , Beaverdam Creek (C) , Buck Creek (D) . Display/hide their locations on the map
Park in Helena: (1) . Display/hide its location on the map
Tourist attraction: (1) . Display/hide its approximate location on the map
Birthplace of: Rebecca Luker - Female singer, Liz Cochran - Beauty pageant winner.
Shelby County has a predicted average indoor radon screening level between 2 and 4 pCi/L (pico curies per liter) - Moderate Potential Drinking water stations with addresses in Helena that have no violations reported:
HELENA UTILITY BOARD (Population served: 18,900, Primary Water Source Type: Purch groundwater under infl of surface water)
Average household size: This city:
2.8 peopleAlabama:
2.5 people
Percentage of family households: This city:
79.1%Whole state:
67.8%
Percentage of households with unmarried partners: This city:
2.8%Whole state:
4.7%
Likely homosexual households (counted as self-reported same-sex unmarried-partner households)
Lesbian couples: 0.3% of all households Gay men: 0.3% of all households
16 people in nursing homes in 2000
Banks with branches in Helena (2011 data):
BankTrust: Helena Branch at 4949 Highway 17, branch established on 2000/04/07. Info updated 2012/01/30: Bank assets: $2,083.8 mil, Deposits: $1,812.7 mil, headquarters in Mobile, AL, positive income , Commercial Lending Specialization, 50 total offices , Holding Company: Banctrust Financial Group, Inc.
Regions Bank: Helena Branch at 4915 Highway 17, branch established on 2002/07/29. Info updated 2011/02/24: Bank assets: $123,368.2 mil, Deposits: $98,301.3 mil, headquarters in Birmingham, AL, positive income , Commercial Lending Specialization, 1778 total offices , Holding Company: Regions Financial Corporation
For population 15 years and over in Helena:
Never married: 26.4%Now married: 63.9%Separated: 0.4%Widowed: 3.1%Divorced: 6.3% For population 25 years and over in Helena:
High school or higher: 96.9%Bachelor's degree or higher: 48.0%Graduate or professional degree: 15.6%Unemployed: 0.9%Mean travel time to work (commute): 26.7 minutes
Education Gini index (Inequality in education) Here:
9.0Alabama average:
11.5
Religion statistics for Helena, AL (based on Shelby County data)
Religion Adherents Congregations Evangelical Protestant 61,933 172 Mainline Protestant 16,076 38 Catholic 2,883 1 Black Protestant 2,421 12 Other 2,337 6 Orthodox 58 1 None 109,377 -
Source: Clifford Grammich, Kirk Hadaway, Richard Houseal, Dale E.Jones, Alexei Krindatch, Richie Stanley and Richard H.Taylor. 2012. 2010 U.S.Religion Census: Religious Congregations & Membership Study. Association of Statisticians of American Religious Bodies. Jones, Dale E., et al. 2002. Congregations and Membership in the United States 2000. Nashville, TN: Glenmary Research Center. Graphs represent county-level data
Food Environment Statistics: Number of grocery stores : 24Shelby County :
1.31 / 10,000 pop.Alabama :
1.89 / 10,000 pop.
Number of supercenters and club stores : 3This county :
0.16 / 10,000 pop.Alabama :
0.20 / 10,000 pop.
Number of convenience stores (no gas) : 5Here :
0.27 / 10,000 pop.Alabama :
0.65 / 10,000 pop.
Number of convenience stores (with gas) : 94Here :
5.14 / 10,000 pop.Alabama :
6.32 / 10,000 pop.
Number of full-service restaurants : 124Here :
6.78 / 10,000 pop.Alabama :
5.75 / 10,000 pop.
Adult diabetes rate : Shelby County :
7.4%Alabama :
11.8%
Adult obesity rate : Shelby County :
28.1%Alabama :
31.7%
Low-income preschool obesity rate : Shelby County :
17.2%Alabama :
13.5%
Health and Nutrition:
Average overall health of teeth and gums : Helena:
42.0%Alabama:
45.7%
Average BMI : This city:
29.3Alabama:
28.9
People feeling badly about themselves : This city:
22.5%Alabama:
20.7%
People not drinking alcohol at all : Average hours sleeping at night : Overweight people : Helena:
32.8%Alabama:
34.4%
General health condition : Helena:
55.6%Alabama:
55.2%
Average condition of hearing : Helena:
80.3%Alabama:
79.3%
More about Health and Nutrition of Helena, AL Residents
Local government employment and payroll (March 2022)
Function
Full-time employees
Monthly full-time payroll
Average yearly full-time wage
Part-time employees
Monthly part-time payroll
Police Protection - Officers
24 $133,794 $66,897 6 $7,287 Firefighters
23 $122,778 $64,058 7 $10,219 Streets and Highways
7 $24,337 $41,721 0 $0 Parks and Recreation
6 $24,333 $48,666 1 $1,308 Police - Other
5 $25,013 $60,031 1 $1,568 Local Libraries
4 $17,435 $52,305 1 $1,331 Other Government Administration
3 $23,522 $94,088 7 $10,970 Judicial and Legal
2 $9,876 $59,256 0 $0 Financial Administration
1 $6,765 $81,180 1 $1,593
Totals for Government
75 $387,852 $62,056 24 $34,275
Helena government finances - Expenditure in 2017 (per resident):
Construction - General - Other: $208,000 ($9.51)
Current Operations - Police Protection: $3,858,000 ($176.47)
Central Staff Services: $1,888,000 ($86.36)Regular Highways: $1,185,000 ($54.20)Parks and Recreation: $729,000 ($33.35)General - Interest on Debt: $139,000 ($6.36)
Total Salaries and Wages: $4,446,000 ($203.37)
Helena government finances - Revenue in 2017 (per resident):
Charges - Other: $895,000 ($40.94)
Miscellaneous - Fines and Forfeits: $571,000 ($26.12)
General Revenue - Other: $401,000 ($18.34)State Intergovernmental - Other: $384,000 ($17.56)
Tax - General Sales and Gross Receipts: $2,807,000 ($128.40)
Other: $1,422,000 ($65.04)Property: $1,192,000 ($54.52)Other License: $1,177,000 ($53.84)
Helena government finances - Debt in 2017 (per resident):
Long Term Debt - Beginning Outstanding - Unspecified Public Purpose: $3,277,000 ($149.89)
Outstanding Unspecified Public Purpose: $3,114,000 ($142.44)Retired Unspecified Public Purpose: $163,000 ($7.46)
Helena government finances - Cash and Securities in 2017 (per resident):
Other Funds - Cash and Securities: $232,000 ($10.61)
Sinking Funds - Cash and Securities: $99,000 ($4.53)
Businesses in Helena, AL
Name Count Name Count
Ace Hardware 1 Pizza Hut 1 CVS 1 Publix Super Markets 1 FedEx 1 Subway 1 Little Caesars Pizza 1 Taco Bell 1 McDonald's 1 U-Haul 1 Nike 2 Walgreens 1
Strongest AM radio stations in Helena:
WJOX (690 AM; 50 kW; BIRMINGHAM, AL; Owner: CITADEL BROADCASTING COMPANY)
WAPI (1070 AM; 50 kW; BIRMINGHAM, AL; Owner: CITADEL BROADCASTING COMPANY)
WDJC (850 AM; 50 kW; BIRMINGHAM, AL; Owner: KIMTRON, INC.)
WQCR (1500 AM; 2 kW; ALABASTER, AL; Owner: WGTT, INC.)
WERC (960 AM; 5 kW; BIRMINGHAM, AL; Owner: CAPSTAR TX LIMITED PARTNERSHIP)
WYDE (1260 AM; 5 kW; BIRMINGHAM, AL; Owner: KIMTRON, INC.)
WNSI (810 AM; 50 kW; JACKSONVILLE, AL; Owner: UNITED BROADCASTING NETWORK, INC.)
WRJS (1320 AM; 5 kW; BIRMINGHAM, AL; Owner: CXR HOLDINGS, INC.)
WLPH (1480 AM; daytime; 5 kW; IRONDALE, AL; Owner: BIRMINGHAM CHRISTIAN RADIO, INC.)
WSMQ (1450 AM; 1 kW; BESSEMER, AL; Owner: BESSEMER RADIO INC.)
WKNG (1060 AM; daytime; 50 kW; TALLAPOOSA, GA; Owner: WKNG, INC.)
WAYE (1220 AM; 1 kW; BIRMINGHAM, AL; Owner: BIRMINGHAM CHRISTIAN RADIO, INC.)
WJLD (1400 AM; 1 kW; FAIRFIELD, AL; Owner: RICHARDSON BROADCASTING CORPORATION)
Strongest FM radio stations in Helena:
WODL (97.3 FM; HOMEWOOD, AL; Owner: CXR HOLDINGS, INC.)
WMJJ (96.5 FM; BIRMINGHAM, AL; Owner: CAPSTAR TX LIMITED PARTNERSHIP)
WQEN (103.7 FM; GADSDEN, AL; Owner: CAPSTAR TX LIMITED PARTNERSHIP)
WYSF (94.5 FM; BIRMINGHAM, AL; Owner: CITADEL BROADCASTING COMPANY)
WZRR (99.5 FM; BIRMINGHAM, AL; Owner: CITADEL BROADCASTING COMPANY)
WDJC-FM (93.7 FM; BIRMINGHAM, AL; Owner: KIMTRON, INC.)
WBHK (98.7 FM; WARRIOR, AL; Owner: CXR HOLDINGS, INC.)
WZZK-FM (104.7 FM; BIRMINGHAM, AL; Owner: CXR HOLDINGS, INC.)
WBPT (106.9 FM; BIRMINGHAM, AL; Owner: CXR HOLDINGS, INC.)
WQEM (101.5 FM; COLUMBIANA, AL; Owner: GLEN IRIS BAPTIST SCHOOL)
WBHM (90.3 FM; BIRMINGHAM, AL; Owner: BD OF TRUSTEES/U OF AL AT BIRMINGHAM)
W281AB (104.1 FM; MOUNTAIN BROOK, AL; Owner: FAMILY STATIONS, INC.)
WGIB (91.9 FM; BIRMINGHAM, AL; Owner: GLEN IRIS BAPTIST SCHOOL)
WLJR (88.5 FM; BIRMINGHAM, AL; Owner: BRIARWOOD PRESBYTERIAN CHURCH)
WBFR (89.5 FM; BIRMINGHAM, AL; Owner: FAMILY STATIONS, INC.)
WDXB (102.5 FM; JASPER, AL; Owner: CAPSTAR TX LIMITED PARTNERSHIP)
WVSU-FM (91.1 FM; BIRMINGHAM, AL; Owner: SAMFORD UNIVERSITY)
WANZ (100.7 FM; NORTHPORT, AL; Owner: APEX BRAODCASTING INC.)
WRAX (107.7 FM; BIRMINGHAM, AL; Owner: CITADEL BROADCASTING COMPANY)
WENN (105.9 FM; TRUSSVILLE, AL; Owner: CAPSTAR TX LIMITED PARTNERSHIP)
TV broadcast stations around Helena:
WABM (Channel 68; BIRMINGHAM, AL; Owner: BIRMINGHAM (WABM-TV) LICENSEE, INC.)
WBXA-CA (Channel 2; BIRMINGHAM, AL; Owner: THE BOX WORLDWIDE LLC)
WIAT (Channel 42; BIRMINGHAM, AL; Owner: MEDIA GENERAL COMMUNICATIONS, INC.)
WBIQ (Channel 10; BIRMINGHAM, AL; Owner: ALABAMA EDUCATIONAL TELEVISION COMMISSION)
WTTO (Channel 21; HOMEWOOD, AL; Owner: WTTO LICENSEE, LLC)
WBRC (Channel 6; BIRMINGHAM, AL; Owner: WBRC LICENSE, INC.)
WVTM-TV (Channel 13; BIRMINGHAM, AL; Owner: BIRMINGHAM BROADCASTING (WVTM-TV), LLC)
WBMA-LP (Channel 58; BIRMINGHAM, AL; Owner: TV ALABAMA, INC.)
WDBB (Channel 17; BESSEMER, AL; Owner: WDBB-TV, INC.)
WCFT-TV (Channel 33; TUSCALOOSA, AL; Owner: TV ALABAMA, INCORPORATED)
W27CM (Channel 27; BIRMINGHAM, AL; Owner: EQUITY BROADCASTING CORPORATION)
W15AZ (Channel 15; ALABASTER, AL; Owner: GLEN IRIS BAPTIST CHURCH SCHOOL)
W34BI (Channel 34; BIRMINGHAM, AL; Owner: VENTANA TELEVISION, INC.)
W46DK (Channel 46; BIRMINGHAM, AL; Owner: TRINITY BROADCASTING NETWORK)
WOTM-LP (Channel 19; MONTEVALLO, AL; Owner: JAMES DONALD EARLEY)
WBIH (Channel 29; SELMA, AL; Owner: FLINN BROADCASTING CORPORATION)
W62BG (Channel 62; BIRMINGHAM, AL; Owner: WTTO LICENSEE, LLC)
W49AY (Channel 49; BIRMINGHAM, AL; Owner: GLEN IRIS BAPTIST SCHOOL)
National Bridge Inventory (NBI) Statistics 15 Number of bridges151ft / 46.5m Total length $16,386,000 Total costs74,870 Total average daily traffic7,492 Total average daily truck traffic99,133 Total future (year 2040) average daily traffic
New bridges - historical statistics
1 1920-1929 1 1940-1949 1 1950-1959 1 1960-1969 2 1980-1989 4 1990-1999 5 2000-2009
See full National Bridge Inventory statistics for Helena, AL
FCC Registered Antenna Towers: 49 (
See the full list of FCC Registered Antenna Towers in Helena )
FCC Registered Private Land Mobile Towers: 2
Lat: 33.274444 Lon: -86.865556, Call Sign: WPYB920, Assigned Frequencies: 806.000 MHz, Grant Date: 08/16/2023, Expiration Date: 07/16/2033, Certifier: Ray Waters, Registrant: Southern Communications Services, Inc. D/B/A Southern Linc, 600 18th St N Bin Sn-0800, Birmingham, AL 35203-2206, Phone: (205) 257-1534, Email:
1000 Coalmont Road (Lat: 33.274444 Lon: -86.865556), Type: Tower, Structure height: 50.6 m, Overall height: 57.9 m, Call Sign: WQJP290, Assigned Frequencies: 855.162 MHz, 855.887 MHz, Grant Date: 07/02/2013, Expiration Date: 07/16/2023, Cancellation Date: 07/17/2014, Certifier: Robin J Cohen, Registrant: Sprint Nextel Corporation, 12502 Sunrise Valley Drive, Reston, VA 20191, Phone: (703) 433-4000, Fax: (703) 433-4483 FCC Registered Broadcast Land Mobile Towers: 5
1 Mi E Hwy 52 Int Cnty Rd 261 & 52 (Lat: 33.287611 Lon: -86.828056), Call Sign: KUW547, Assigned Frequencies: 48.6200 MHz, 49.1600 MHz, Grant Date: 02/13/1995, Expiration Date: 03/28/2000, Cancellation Date: 12/03/2000, Registrant: Plantation Pipe Line Company, 1435 Windward Concourse, Alpharetta, GA 30202, Phone: (404) 751-4100 Lat: 33.305556 Lon: -86.831389, Call Sign: WQDA243, Assigned Frequencies: 467.375 MHz, 467.300 MHz, 462.375 MHz, 464.325 MHz, 469.325 MHz, Grant Date: 07/21/2015, Expiration Date: 07/06/2025, Certifier: Ricky Duffey, Registrant: Mobile Communications America, 4116 First Avenue North, Birmingham, AL 35222, Phone: (205) 591-8804, Email:
7210 Wyndham Parkway (Lat: 33.278056 Lon: -86.852222), Call Sign: WQFS713, Assigned Frequencies: 30.8400 MHz, 154.540 MHz, 33.4000 MHz, 33.1600 MHz, 31.2400 MHz, 468.487 MHz, 468.762 MHz, 469.462 MHz, 469.662 MHz, 469.887 MHz... (+20 more), Grant Date: 09/23/2006, Expiration Date: 09/23/2016, Cancellation Date: 11/26/2016, Certifier: Marcella Hammond, Registrant: Dolfen Consulting Group, 95 Willow Lane, Bristol, IL 60512-9711, Phone: (630) 553-5886, Fax: (630) 566-1755, Email:
3441 Highway 93 (Lat: 33.298917 Lon: -86.902167), Type: Pole, Structure height: 6 m, Call Sign: WQJX731, Assigned Frequencies: 153.635 MHz, Grant Date: 01/03/2019, Expiration Date: 02/05/2029, Certifier: Randall J Patterson, Registrant: Spire - Alabama, 14 13th Street North - Building 200, Birmingham, AL 35203, Phone: (205) 326-8381, Fax: (205) 731-3397, Email:
284 Old Cahaba Terrace (Lat: 33.287444 Lon: -86.874944), Type: Pole, Structure height: 6 m, Call Sign: WQJY428, Assigned Frequencies: 153.635 MHz, Grant Date: 01/03/2019, Expiration Date: 02/12/2029, Certifier: Randall J Patterson, Registrant: Spire - Alabama, 14 13th Street North - Building 200, Birmingham, AL 35203, Phone: (205) 326-8381, Fax: (205) 731-3397, Email:
FCC Registered Microwave Towers: 4
HELENA, Lat: 33.306306 Lon: -86.816500, Call Sign: WQEA242, Assigned Frequencies: 956.406 MHz, Grant Date: 12/08/2015, Expiration Date: 12/12/2025, Certifier: Brian Hinds, Registrant: Sensus, 450 N Gallatin Ave, Uniontown, PA 15401, Phone: (800) 638-3748, Fax: (800) 888-2403, Email:
Helena AL 6, 120 Old Tuscaloosa Road (Lat: 33.288472 Lon: -86.849278), Type: Tower, Structure height: 54.8 m, Overall height: 57.9 m, Call Sign: WQII674, Assigned Frequencies: 10955.0 MHz, Grant Date: 02/20/2008, Expiration Date: 02/20/2018, Cancellation Date: 08/20/2009, Certifier: William Chastain, Registrant: Radio Dynamics Corporation, 774 Mays Blvd., #10-465, Silver Spring, MD 20914, Phone: (301) 493-5171, Fax: (301) 576-4553, Email:
HELENA EBTS MASTER, 1000 Coalmont Road (Lat: 33.274361 Lon: -86.865639), Type: Ltower, Structure height: 50 m, Overall height: 55.4 m, Call Sign: WQTV595, Assigned Frequencies: 928.731 MHz, 952.731 MHz, Grant Date: 04/22/2014, Expiration Date: 04/22/2024, Cancellation Date: 05/17/2019, Certifier: Larry F Butts, Registrant: Southern Company Services, 600 North 18th St/Bin 5n-8409, Birmingham, AL 35203, Phone: (205) 257-3223, Fax: (256) 231-3627, Email:
HELENA, 1000 Coalmont Rd (Lat: 33.274361 Lon: -86.865611), Type: Ltower, Structure height: 54.9 m, Call Sign: WQWM458, Assigned Frequencies: 11505.0 MHz, 11505.0 MHz, 11505.0 MHz, 11505.0 MHz, 11505.0 MHz, 11505.0 MHz, 11505.0 MHz, 11505.0 MHz, 11545.0 MHz, 11585.0 MHz... (+14 more), Grant Date: 10/02/2015, Expiration Date: 10/02/2025, Certifier: Larry F Butts, Registrant: Southern Company Services, 600 N. 18th St / Bin 5n-5409, Birmingham, AL 35203, Phone: (205) 257-7600, Fax: (205) 257-2134, Email:
FCC Registered Amateur Radio Licenses: 105 (
See the full list of FCC Registered Amateur Radio Licenses in Helena )
FAA Registered Aircraft Manufacturers and Dealers: 2 (
See the full list of FAA Registered Manufacturers and Dealers in Helena )
FAA Registered Aircraft: 17 (
See the full list of FAA Registered Aircraft )
Home Mortgage Disclosure Act Aggregated Statistics For Year 2009(Based on 1 full and 5 partial tracts) A) FHA, FSA/RHS & VA B) Conventional C) Refinancings D) Home Improvement Loans F) Non-occupant Loans on G) Loans On Manufactured Number Average Value Number Average Value Number Average Value Number Average Value Number Average Value Number Average Value
LOANS ORIGINATED 116 $139,827 69 $174,164 403 $167,025 19 $54,100 16 $122,469 4 $23,628 APPLICATIONS APPROVED, NOT ACCEPTED 3 $157,847 8 $152,031 31 $165,346 1 $100,870 1 $115,000 1 $20,570 APPLICATIONS DENIED 11 $141,686 10 $128,575 113 $178,338 11 $28,711 5 $100,244 3 $41,217 APPLICATIONS WITHDRAWN 14 $156,874 17 $179,866 135 $161,696 3 $109,880 3 $184,473 0 $0 FILES CLOSED FOR INCOMPLETENESS 3 $137,670 2 $147,140 27 $164,869 4 $127,795 0 $0 0 $0
Aggregated Statistics For Year 2008(Based on 1 full and 5 partial tracts) A) FHA, FSA/RHS & VA B) Conventional C) Refinancings D) Home Improvement Loans F) Non-occupant Loans on G) Loans On Manufactured Number Average Value Number Average Value Number Average Value Number Average Value Number Average Value Number Average Value
LOANS ORIGINATED 99 $153,005 154 $158,735 234 $155,928 24 $40,762 19 $125,789 1 $22,520 APPLICATIONS APPROVED, NOT ACCEPTED 3 $159,743 13 $134,119 39 $147,449 3 $38,137 4 $80,532 2 $28,965 APPLICATIONS DENIED 13 $158,588 17 $142,664 154 $157,733 30 $67,136 5 $137,804 3 $40,397 APPLICATIONS WITHDRAWN 15 $153,432 23 $178,799 101 $165,600 5 $124,320 2 $119,455 1 $134,440 FILES CLOSED FOR INCOMPLETENESS 4 $145,415 8 $147,951 18 $162,266 1 $38,300 0 $0 0 $0
Aggregated Statistics For Year 2007(Based on 1 full and 5 partial tracts) A) FHA, FSA/RHS & VA B) Conventional C) Refinancings D) Home Improvement Loans F) Non-occupant Loans on G) Loans On Manufactured Number Average Value Number Average Value Number Average Value Number Average Value Number Average Value Number Average Value
LOANS ORIGINATED 38 $150,010 414 $144,717 273 $135,889 35 $47,442 31 $123,373 3 $46,827 APPLICATIONS APPROVED, NOT ACCEPTED 2 $115,870 36 $140,723 58 $147,305 10 $51,088 2 $112,970 1 $42,470 APPLICATIONS DENIED 4 $179,540 48 $140,802 151 $146,441 45 $67,824 7 $136,481 7 $37,500 APPLICATIONS WITHDRAWN 3 $133,487 37 $154,950 87 $162,406 15 $122,245 5 $120,636 0 $0 FILES CLOSED FOR INCOMPLETENESS 1 $108,190 18 $184,224 32 $176,035 4 $143,165 1 $118,660 0 $0
Aggregated Statistics For Year 2006(Based on 1 full and 5 partial tracts) A) FHA, FSA/RHS & VA B) Conventional C) Refinancings D) Home Improvement Loans F) Non-occupant Loans on G) Loans On Manufactured Number Average Value Number Average Value Number Average Value Number Average Value Number Average Value Number Average Value
LOANS ORIGINATED 28 $144,941 559 $134,612 298 $134,995 43 $60,128 46 $112,158 3 $54,703 APPLICATIONS APPROVED, NOT ACCEPTED 1 $147,360 49 $113,822 48 $129,810 8 $58,005 3 $99,317 3 $44,317 APPLICATIONS DENIED 3 $137,690 52 $115,706 177 $133,371 45 $51,536 9 $124,827 8 $45,725 APPLICATIONS WITHDRAWN 6 $121,565 67 $134,552 118 $137,975 18 $99,117 6 $99,518 0 $0 FILES CLOSED FOR INCOMPLETENESS 0 $0 17 $161,228 44 $162,445 3 $54,017 2 $143,735 0 $0
Aggregated Statistics For Year 2005(Based on 1 full and 5 partial tracts) A) FHA, FSA/RHS & VA B) Conventional C) Refinancings D) Home Improvement Loans E) Loans on Dwellings For 5+ Families F) Non-occupant Loans on G) Loans On Manufactured Number Average Value Number Average Value Number Average Value Number Average Value Number Average Value Number Average Value Number Average Value
LOANS ORIGINATED 30 $139,274 593 $125,597 353 $131,247 47 $46,961 1 $16,182,280 34 $105,714 5 $45,716 APPLICATIONS APPROVED, NOT ACCEPTED 1 $211,470 36 $126,274 62 $128,288 4 $54,280 0 $0 4 $124,080 2 $46,650 APPLICATIONS DENIED 1 $131,410 59 $115,791 183 $128,450 48 $39,462 0 $0 4 $138,735 9 $39,047 APPLICATIONS WITHDRAWN 4 $126,622 60 $141,130 112 $144,782 29 $143,253 0 $0 11 $111,458 1 $102,190 FILES CLOSED FOR INCOMPLETENESS 0 $0 10 $133,387 75 $161,233 3 $84,627 0 $0 0 $0 0 $0
Aggregated Statistics For Year 2004(Based on 1 full and 5 partial tracts) A) FHA, FSA/RHS & VA B) Conventional C) Refinancings D) Home Improvement Loans F) Non-occupant Loans on G) Loans On Manufactured Number Average Value Number Average Value Number Average Value Number Average Value Number Average Value Number Average Value
LOANS ORIGINATED 46 $133,330 552 $135,482 412 $131,212 33 $30,972 35 $108,208 4 $39,745 APPLICATIONS APPROVED, NOT ACCEPTED 2 $87,105 39 $149,923 65 $130,269 6 $23,402 2 $112,965 2 $49,625 APPLICATIONS DENIED 4 $118,242 56 $117,259 193 $126,773 41 $33,829 4 $118,690 12 $44,890 APPLICATIONS WITHDRAWN 3 $154,050 49 $128,088 115 $135,455 16 $54,593 3 $103,970 0 $0 FILES CLOSED FOR INCOMPLETENESS 2 $145,230 21 $136,023 65 $133,865 3 $69,397 3 $125,240 0 $0
Aggregated Statistics For Year 2003(Based on 1 full and 5 partial tracts) A) FHA, FSA/RHS & VA B) Conventional C) Refinancings D) Home Improvement Loans F) Non-occupant Loans on Number Average Value Number Average Value Number Average Value Number Average Value Number Average Value
LOANS ORIGINATED 95 $125,754 482 $125,772 964 $129,424 34 $36,076 32 $89,527 APPLICATIONS APPROVED, NOT ACCEPTED 2 $150,135 28 $138,129 110 $123,150 6 $32,285 3 $108,160 APPLICATIONS DENIED 3 $127,523 37 $109,100 209 $118,120 26 $40,216 6 $90,388 APPLICATIONS WITHDRAWN 8 $127,352 41 $136,776 155 $128,114 5 $76,470 3 $109,460 FILES CLOSED FOR INCOMPLETENESS 0 $0 10 $151,580 32 $132,304 1 $16,230 0 $0
Aggregated Statistics For Year 1999(Based on 4 partial tracts) A) FHA, FSA/RHS & VA B) Conventional C) Refinancings D) Home Improvement Loans F) Non-occupant Loans on Number Average Value Number Average Value Number Average Value Number Average Value Number Average Value
LOANS ORIGINATED 104 $108,467 306 $116,014 130 $105,963 23 $13,977 10 $98,663 APPLICATIONS APPROVED, NOT ACCEPTED 3 $99,057 18 $94,194 15 $91,194 4 $39,525 0 $0 APPLICATIONS DENIED 7 $122,010 53 $56,687 33 $82,120 10 $15,645 3 $59,330 APPLICATIONS WITHDRAWN 8 $105,091 21 $116,482 25 $97,792 1 $17,070 0 $0 FILES CLOSED FOR INCOMPLETENESS 1 $121,280 5 $108,276 15 $94,993 0 $0 0 $0
Detailed HMDA statistics for the following Tracts:
0303.12
, 0303.13 , 0303.16 , 0303.17 , 0303.18 , 0303.20
Private Mortgage Insurance Companies Aggregated Statistics For Year 2009(Based on 1 full and 5 partial tracts) A) Conventional B) Refinancings Number Average Value Number Average Value
LOANS ORIGINATED 21 $212,822 25 $182,491 APPLICATIONS APPROVED, NOT ACCEPTED 4 $215,548 8 $193,570 APPLICATIONS DENIED 2 $300,570 4 $262,998 APPLICATIONS WITHDRAWN 1 $194,560 3 $236,620 FILES CLOSED FOR INCOMPLETENESS 0 $0 1 $144,950
Aggregated Statistics For Year 2008(Based on 1 full and 5 partial tracts) A) Conventional B) Refinancings C) Non-occupant Loans on Number Average Value Number Average Value Number Average Value
LOANS ORIGINATED 73 $171,976 41 $174,162 6 $115,178 APPLICATIONS APPROVED, NOT ACCEPTED 21 $163,528 17 $174,626 1 $149,910 APPLICATIONS DENIED 3 $129,310 2 $212,835 1 $96,350 APPLICATIONS WITHDRAWN 2 $156,670 1 $190,190 1 $126,330 FILES CLOSED FOR INCOMPLETENESS 2 $124,105 2 $137,205 1 $129,850
Aggregated Statistics For Year 2007(Based on 1 full and 5 partial tracts) A) Conventional B) Refinancings C) Non-occupant Loans on Number Average Value Number Average Value Number Average Value
LOANS ORIGINATED 171 $161,307 43 $167,169 7 $145,133 APPLICATIONS APPROVED, NOT ACCEPTED 10 $196,123 13 $179,952 0 $0 APPLICATIONS DENIED 1 $278,940 2 $183,115 1 $119,530 APPLICATIONS WITHDRAWN 9 $169,068 2 $135,900 0 $0 FILES CLOSED FOR INCOMPLETENESS 1 $176,270 1 $225,000 0 $0
Aggregated Statistics For Year 2006(Based on 1 full and 5 partial tracts) A) Conventional B) Refinancings C) Non-occupant Loans on Number Average Value Number Average Value Number Average Value
LOANS ORIGINATED 110 $164,697 36 $166,457 5 $115,038 APPLICATIONS APPROVED, NOT ACCEPTED 10 $157,875 14 $159,731 0 $0 APPLICATIONS DENIED 2 $139,505 0 $0 0 $0 APPLICATIONS WITHDRAWN 6 $180,572 5 $153,824 0 $0 FILES CLOSED FOR INCOMPLETENESS 0 $0 0 $0 0 $0
Aggregated Statistics For Year 2005(Based on 1 full and 5 partial tracts) A) Conventional B) Refinancings C) Non-occupant Loans on Number Average Value Number Average Value Number Average Value
LOANS ORIGINATED 101 $150,006 50 $146,040 6 $122,883 APPLICATIONS APPROVED, NOT ACCEPTED 10 $199,713 10 $126,506 1 $131,000 APPLICATIONS DENIED 0 $0 1 $95,660 0 $0 APPLICATIONS WITHDRAWN 8 $146,691 3 $126,850 0 $0 FILES CLOSED FOR INCOMPLETENESS 0 $0 0 $0 0 $0
Aggregated Statistics For Year 2004(Based on 1 full and 5 partial tracts) A) Conventional B) Refinancings C) Non-occupant Loans on Number Average Value Number Average Value Number Average Value
LOANS ORIGINATED 113 $152,907 51 $134,622 7 $98,749 APPLICATIONS APPROVED, NOT ACCEPTED 10 $146,814 18 $126,036 0 $0 APPLICATIONS DENIED 3 $121,557 2 $106,815 1 $124,000 APPLICATIONS WITHDRAWN 9 $154,797 3 $120,133 0 $0 FILES CLOSED FOR INCOMPLETENESS 0 $0 0 $0 0 $0
Aggregated Statistics For Year 2003(Based on 1 full and 5 partial tracts) A) Conventional B) Refinancings C) Non-occupant Loans on Number Average Value Number Average Value Number Average Value
LOANS ORIGINATED 153 $135,332 187 $129,912 9 $111,503 APPLICATIONS APPROVED, NOT ACCEPTED 14 $170,937 38 $133,019 2 $73,890 APPLICATIONS DENIED 2 $111,255 0 $0 1 $128,680 APPLICATIONS WITHDRAWN 4 $152,808 11 $135,172 0 $0 FILES CLOSED FOR INCOMPLETENESS 0 $0 0 $0 0 $0
Aggregated Statistics For Year 1999(Based on 4 partial tracts) A) Conventional B) Refinancings C) Non-occupant Loans on Number Average Value Number Average Value Number Average Value
LOANS ORIGINATED 157 $121,991 28 $120,377 2 $66,075 APPLICATIONS APPROVED, NOT ACCEPTED 4 $144,495 5 $116,768 0 $0 APPLICATIONS DENIED 2 $116,605 1 $133,440 0 $0 APPLICATIONS WITHDRAWN 2 $94,275 1 $146,040 0 $0 FILES CLOSED FOR INCOMPLETENESS 0 $0 1 $101,850 0 $0
Detailed PMIC statistics for the following Tracts:
0303.12
, 0303.13 , 0303.16 , 0303.17 , 0303.18 , 0303.20
Most common first names in Helena, AL among deceased individuals Name Count Lived (average)
James 40 68.7 years Mary 35 76.6 years William 29 71.6 years Robert 26 76.2 years John 24 72.8 years Charles 17 72.7 years Edward 11 71.3 years George 11 77.4 years Margaret 11 81.7 years Martha 10 78.5 years
Most common last names in Helena, AL among deceased individuals Last name Count Lived (average)
Johnson 22 73.8 years Smith 22 75.0 years Jones 10 69.3 years Wilson 10 77.8 years Miller 9 75.8 years Hinds 7 75.2 years Davis 7 69.0 years Harris 6 71.9 years Cox 6 79.7 years Anderson 6 69.0 years
Helena compared to Alabama state average:
Median household income above state average. Median house value above state average. Unemployed percentage significantly below state average. Median age significantly below state average. Foreign-born population percentage above state average. Renting percentage significantly below state average. Length of stay since moving in above state average. House age significantly below state average. Percentage of population with a bachelor's degree or higher significantly above state average.
#90 on the list of "Top 101 cities with the smallest household incomes disparities (population 5,000+)"
#94 on the list of "Top 101 cities with largest percentage of females in industries: finance and insurance (population 5,000+)"
#19 on the list of "Top 101 counties with highest percentage of residents voting for Romney (Republican) in the 2012 Presidential Election (pop. 50,000+)"
#34 on the list of "Top 101 counties with the largest decrease in the number of births per 1000 residents 2000-2006 to 2007-2013 (pop 50,000+)"
#80 on the list of "Top 101 counties with the lowest surface withdrawal of fresh water for public supply (pop. 50,000+)"
Top Patent Applicants
James E. Scurlock, Jr. (5)
Adrian Raiche (4)
Richard E. May (3)
Ronald Shrin (2)
Jason Campbell (2)
Kathryn Gustafson (2)
John Michael Kilpatrick (2)
Jeffrey L. Atkinson (2)
Ronald Wiggins (1)
Robert P. Singleton (1)
Total of 35 patent applications in 2008-2024.


 Recent articles from our blog. Our writers, many of them Ph.D. graduates or candidates, create easy-to-read articles on a wide variety of topics.


 (8.0 miles
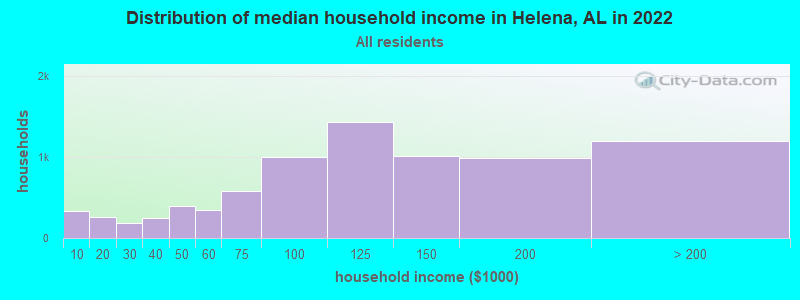
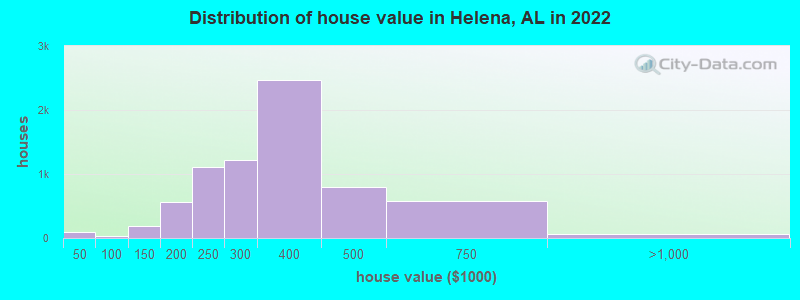

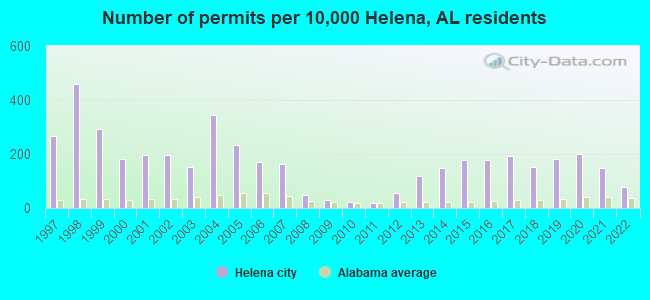
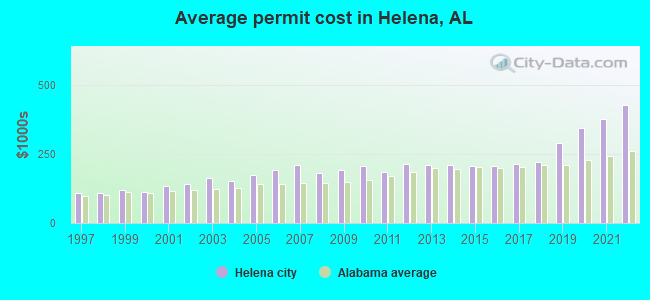
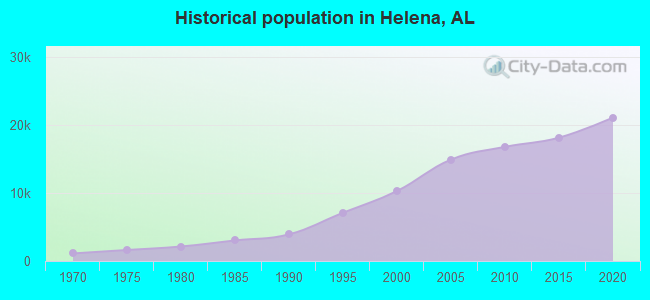
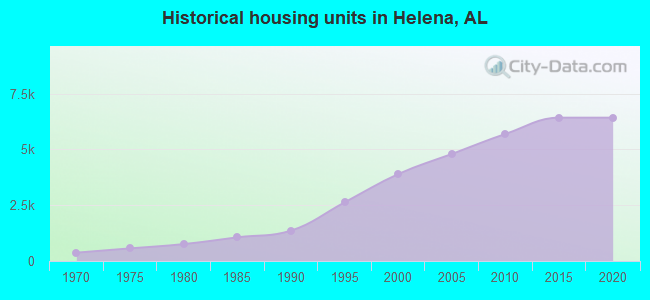
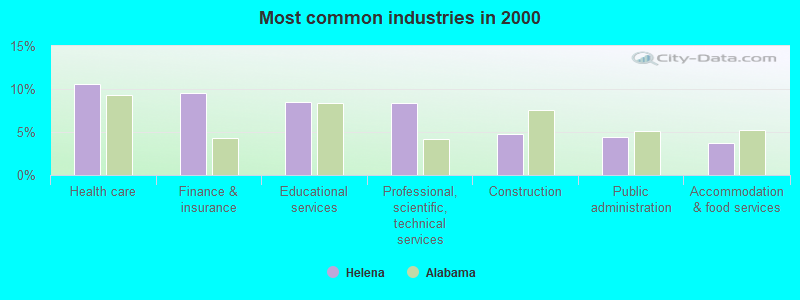
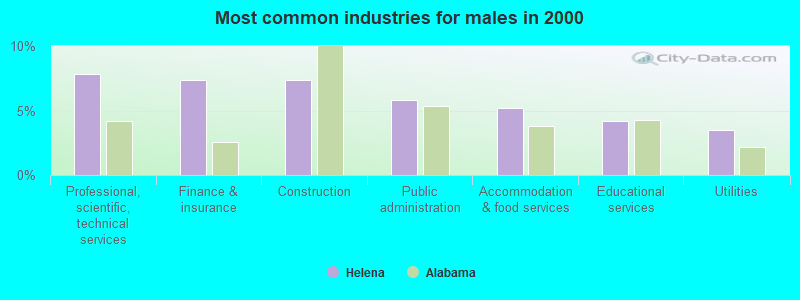
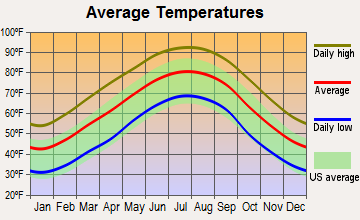
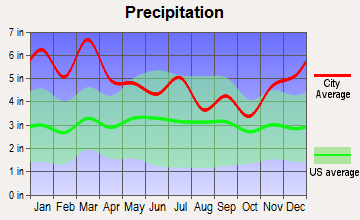
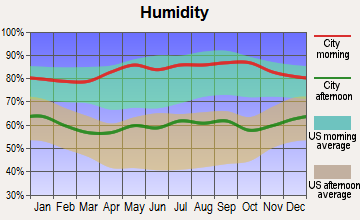
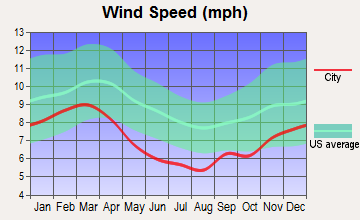
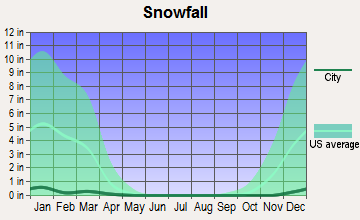
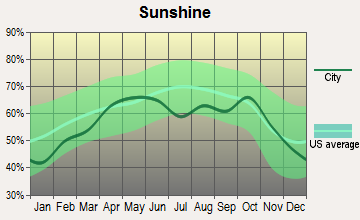
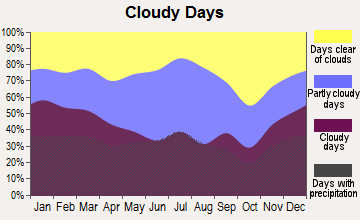


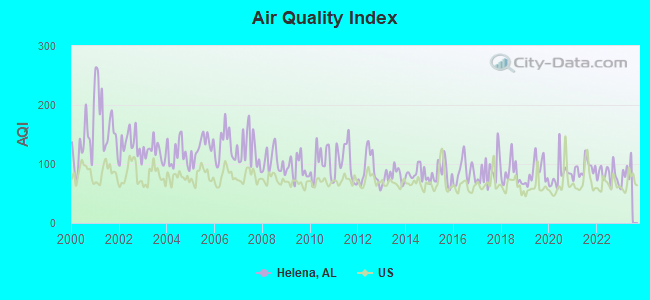
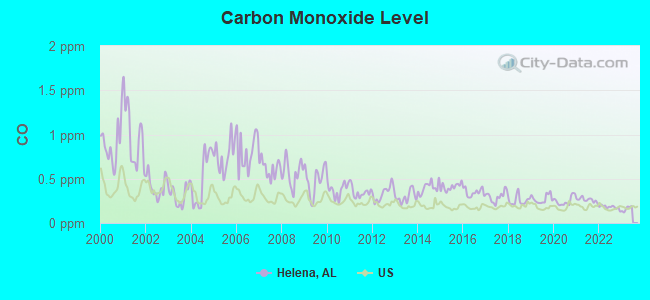
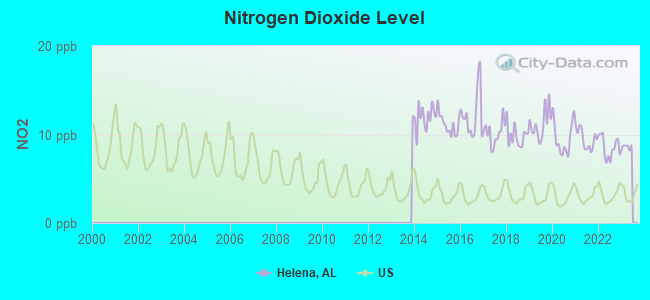
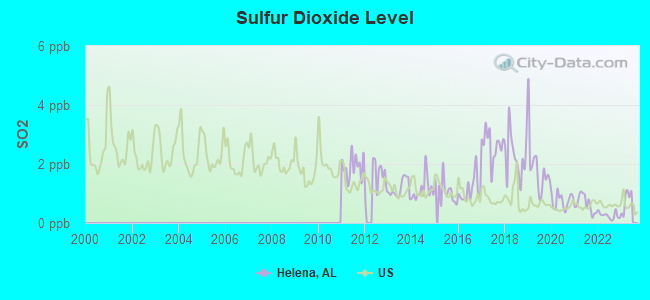
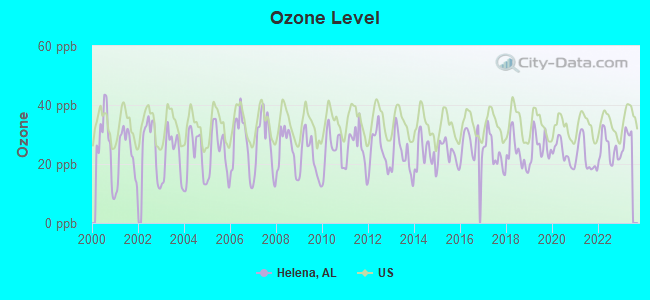
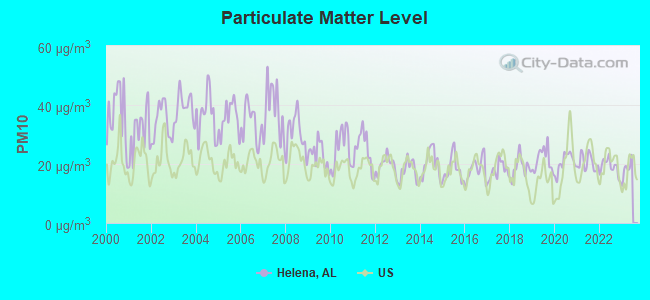
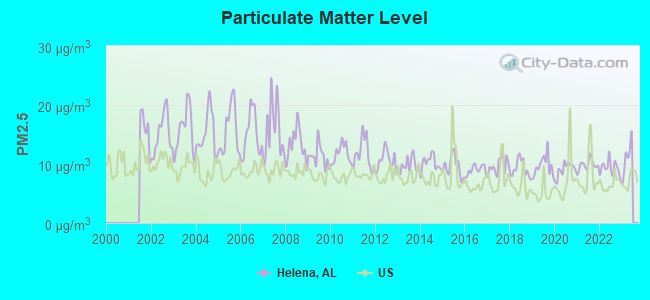
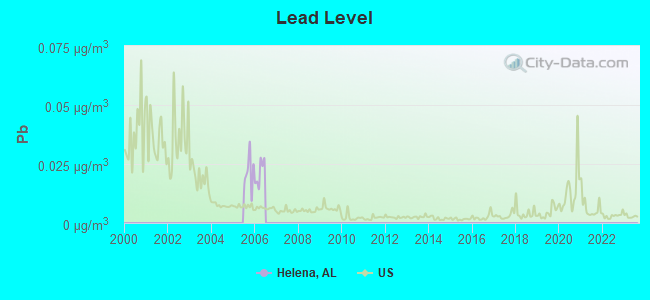

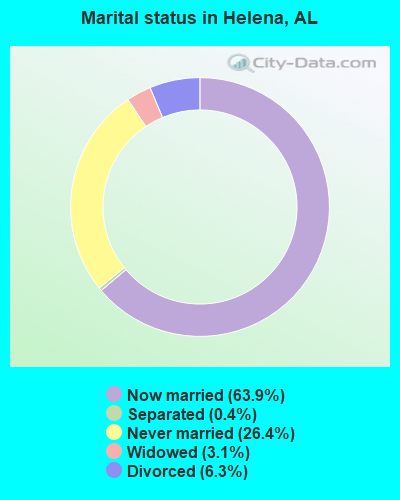
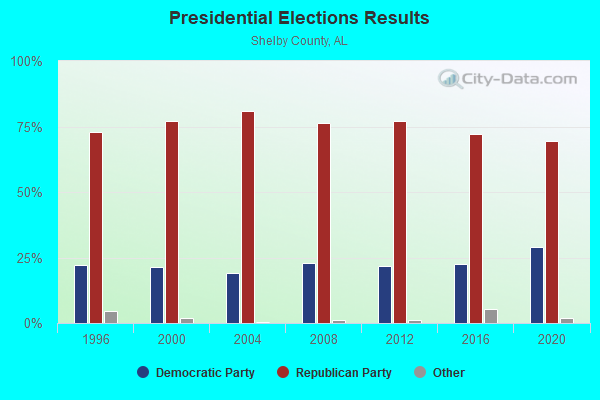
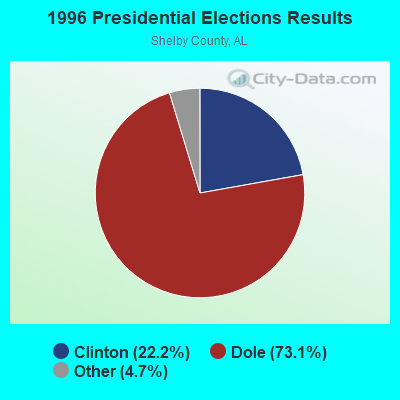
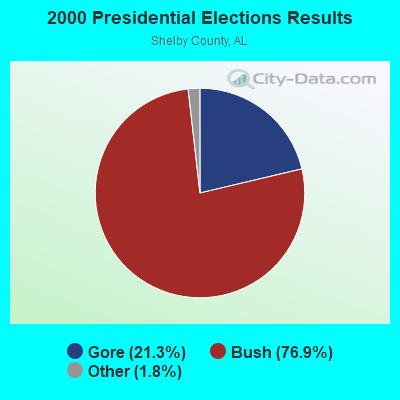
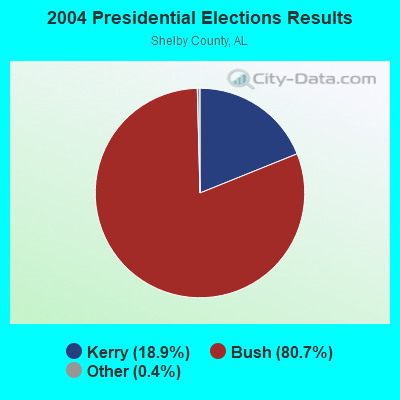
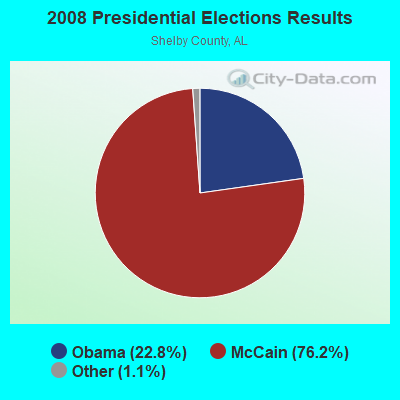
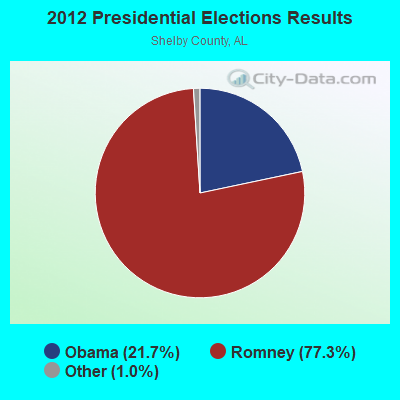
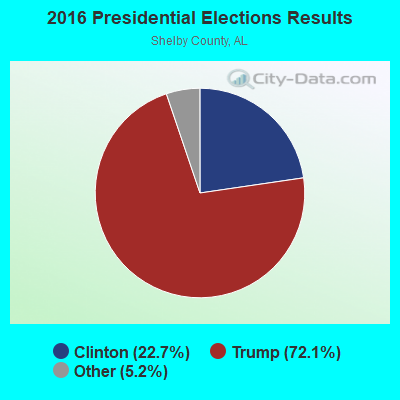
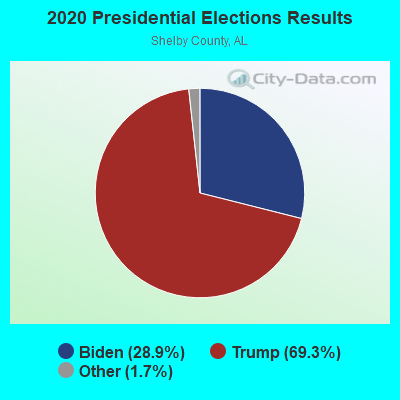
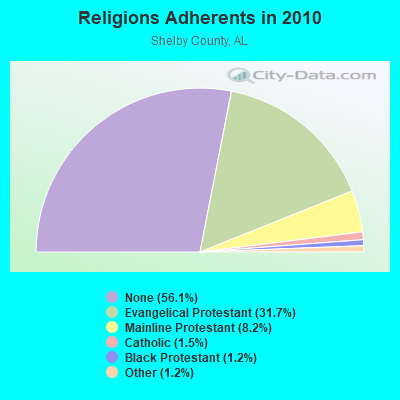
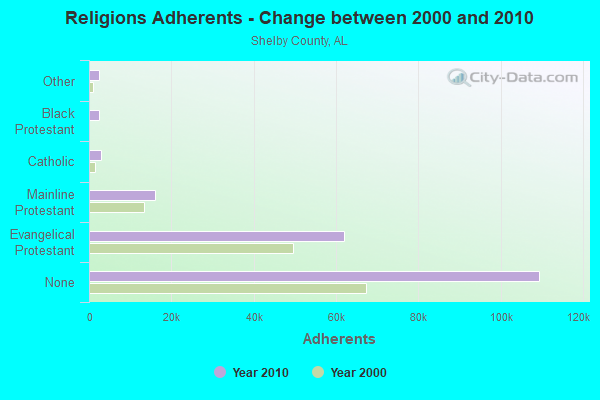
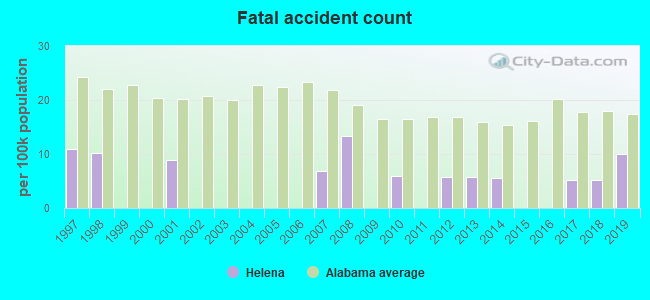
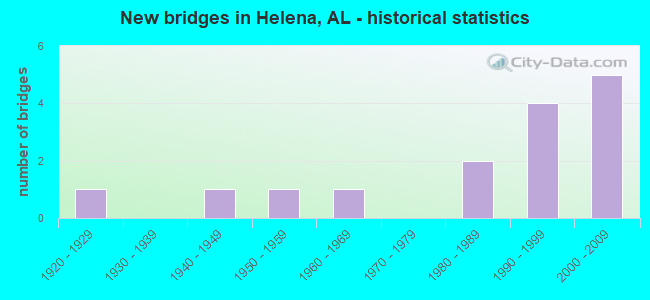
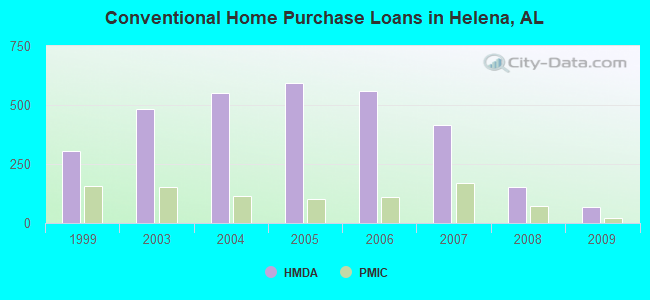
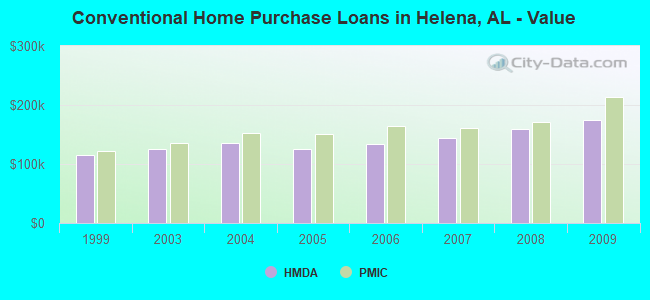
 According to the data from the years 2004 - 2018 the average number of fire incidents per year is 9. The highest number of reported fire incidents - 65 took place in 2010, and the least - 0 in 2005. The data has a rising trend.
 When looking into fire subcategories, the most reports belonged to: Structure Fires (49.6%), and Outside Fires (31.1%).