Estimated zip code population in 2022: 59,334 Zip code population in 2010: 50,163 Zip code population in 2000: 38,066
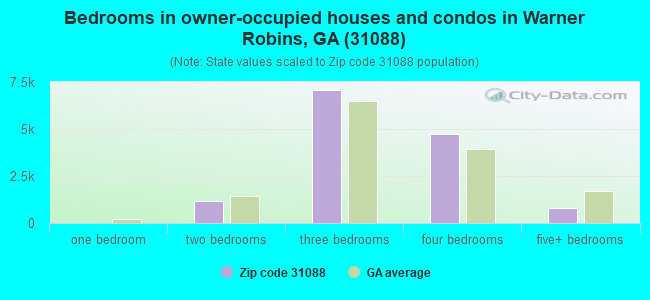
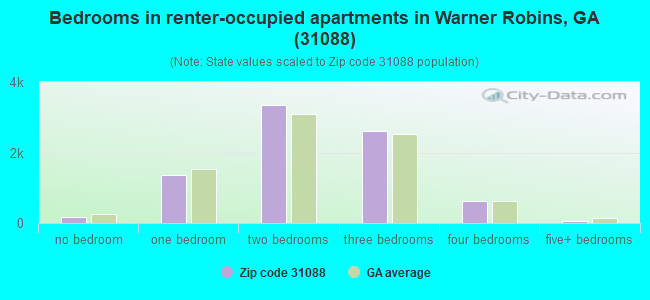
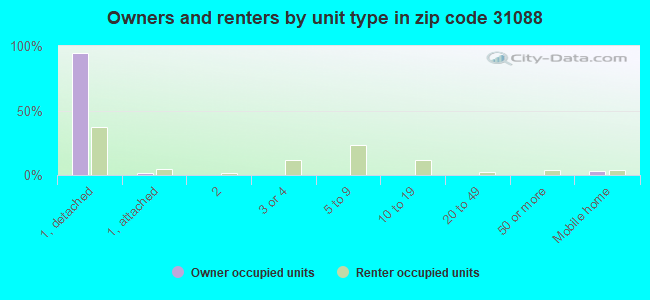
Houses and condos: 23,885 Renter-occupied apartments: 8,141
% of renters here:
37%
State:
34%
March 2022 cost of living index in zip code 31088: 90.7 (less than average, U.S. average is 100)
Land area: 31.4 sq. mi. Water area: 0.2 sq. mi.
Population density: 1,888 people per square mile
(low).
OSM Map
General Map
Google Map
MSN Map
OSM Map
General Map
Google Map
MSN Map
OSM Map
General Map
Google Map
MSN Map
OSM Map
General Map
Google Map
MSN Map
Please wait while loading the map...
Real estate property taxes paid for housing units in 2022:
This zip code:
0.8% ($1,645)
Georgia:
0.7% ($2,160)
Median real estate property taxes paid for housing units with mortgages in 2022: $1,820 (0.8%) Median real estate property taxes paid for housing units with no mortgage in 2022: $1,179 (0.7%)
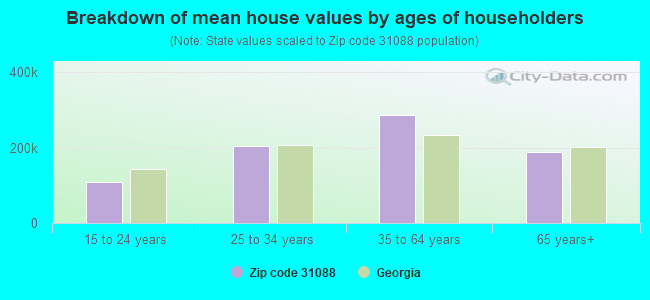
Estimated median house/condo value in 2022: $207,418
31088:
$207,418
Georgia:
$297,400
According to our research of Georgia and other state lists, there were 70 registered sex offenders living in 31088 zip code as of May 26, 2024. The ratio of all residents to sex offenders in zip code 31088 is 736 to 1. The ratio of registered sex offenders to all residents in this zip code is lower than the state average.
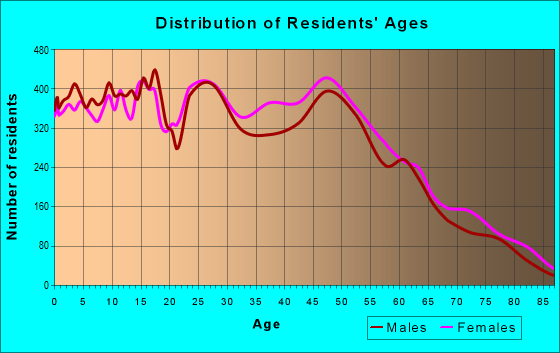
Median resident age:
This zip code:
34.4 years
Georgia median age:
37.6 years
Average household size:
This zip code:
2.7 people
Georgia:
2.6 people
Averages for the 2020 tax year for zip code 31088, filed in 2021:
Average Adjusted Gross Income (AGI) in 2020: $57,716 (Individual Income Tax Returns)
Here:
$57,716
State:
$70,847
Salary/wage: $50,463 (reported on 82.5% of returns)
Here:
$50,463
State:
$59,126
(% of AGI for various income ranges: 1250.1% for AGIs below $25k, 3511.5% for AGIs $25k-50k, 6305.4% for AGIs $50k-75k, 9194.3% for AGIs $75k-100k, 18155.2% for AGIs $100k-200k, 58108.5% for AGIs over 200k)
Taxable interest for individuals: $1,028 (reported on 26.8% of returns)
This zip code:
$1,028
Georgia:
$2,011
(% of AGI for various income ranges: 7.3% for AGIs below $25k, 12.6% for AGIs $25k-50k, 31.2% for AGIs $50k-75k, 66.6% for AGIs $75k-100k, 122.2% for AGIs $100k-200k, 801.5% for AGIs over 200k)
Ordinary dividends: $3,342 (reported on 12.6% of returns)
Here:
$3,342
State:
$8,996
(% of AGI for various income ranges: 5.9% for AGIs below $25k, 15.8% for AGIs $25k-50k, 45.2% for AGIs $50k-75k, 75.5% for AGIs $75k-100k, 199.5% for AGIs $100k-200k, 1664.5% for AGIs over 200k)
Net capital gain/loss in AGI: +$8,980 (reported on 11.3% of returns)
Here:
+$8,980
State:
+$28,402
(% of AGI for various income ranges: 5.5% for AGIs below $25k, 10.2% for AGIs $25k-50k, 30.0% for AGIs $50k-75k, 77.8% for AGIs $75k-100k, 383.5% for AGIs $100k-200k, 8168.5% for AGIs over 200k)
Profit/loss from business: +$4,209 (reported on 17.3% of returns)
Here:
+$4,209
State:
+$6,707
(% of AGI for various income ranges: 32.4% for AGIs below $25k, 2.9% for AGIs $25k-50k, 18.4% for AGIs $50k-75k, 65.8% for AGIs $75k-100k, 185.7% for AGIs $100k-200k, 5790.5% for AGIs over 200k)
Taxable individual retirement arrangement distribution: $14,299 (reported on 5.9% of returns)
31088:
$14,299
Georgia:
$20,525
(% of AGI for various income ranges: 17.2% for AGIs below $25k, 38.5% for AGIs $25k-50k, 87.7% for AGIs $50k-75k, 218.2% for AGIs $75k-100k, 464.3% for AGIs $100k-200k, 1830.0% for AGIs over 200k)
Self-employed (Keogh) retirement plans: $20,725 (reported on 0.2% of returns)
31088:
$20,725
Georgia:
$27,751
(% of AGI for various income ranges: 41.9% for AGIs $100k-200k)
Total itemized deductions: $30,230 (reported on 9.0% of returns)
Here:
$30,230
State:
$34,001
(% of AGI for various income ranges: 27.8% for AGIs below $25k, 120.9% for AGIs $25k-50k, 391.7% for AGIs $50k-75k, 604.8% for AGIs $75k-100k, 1394.6% for AGIs $100k-200k, 7093.5% for AGIs over 200k)
Charity contributions: $12,938 (reported on 8.1% of returns)
Here:
$12,938
State:
$14,164
(% of AGI for various income ranges: 3.6% for AGIs below $25k, 36.4% for AGIs $25k-50k, 124.6% for AGIs $50k-75k, 199.8% for AGIs $75k-100k, 542.3% for AGIs $100k-200k, 3834.5% for AGIs over 200k)
Taxes paid: $6,579 (reported on 8.9% of returns)
31088:
$6,579
State:
$7,540
(% of AGI for various income ranges: 3.2% for AGIs below $25k, 17.0% for AGIs $25k-50k, 68.4% for AGIs $50k-75k, 128.0% for AGIs $75k-100k, 367.9% for AGIs $100k-200k, 1490.0% for AGIs over 200k)
Earned income credit: $2,579 (reported on 21.3% of returns)
Here:
$2,579
State:
$2,530
(% of AGI for various income ranges: 132.7% for AGIs below $25k, 87.1% for AGIs $25k-50k, 0.9% for AGIs $50k-75k)
Percentage of individuals using paid preparers for their 2020 taxes: 93.8%
Here:
94%
State:
93%
(% for various income ranges: 93.6% for AGIs below $25k, 94.6% for AGIs $25k-50k, 93.7% for AGIs $50k-75k, 93.3% for AGIs $75k-100k, 93.0% for AGIs $100k-200k, 95.5% for AGIs over 200k)
Averages for the 2012 tax year for zip code 31088, filed in 2013:
Average Adjusted Gross Income (AGI) in 2012: $52,104 (Individual Income Tax Returns)
Here:
$52,104
State:
$56,131
Salary/wage: $45,825 (reported on 85.9% of returns)
Here:
$45,825
State:
$47,942
(% of AGI for various income ranges: 82.6% for AGIs below $25k, 82.3% for AGIs $25k-50k, 77.3% for AGIs $50k-75k, 75.3% for AGIs $75k-100k, 74.7% for AGIs $100k-200k, 55.3% for AGIs over 200k)
Taxable interest for individuals: $835 (reported on 31.1% of returns)
This zip code:
$835
Georgia:
$1,706
(% of AGI for various income ranges: 0.5% for AGIs below $25k, 0.4% for AGIs $25k-50k, 0.5% for AGIs $50k-75k, 0.5% for AGIs $75k-100k, 0.5% for AGIs $100k-200k, 0.6% for AGIs over 200k)
Ordinary dividends: $2,334 (reported on 13.7% of returns)
Here:
$2,334
State:
$7,265
(% of AGI for various income ranges: 0.6% for AGIs below $25k, 0.3% for AGIs $25k-50k, 0.4% for AGIs $50k-75k, 0.5% for AGIs $75k-100k, 0.7% for AGIs $100k-200k, 1.6% for AGIs over 200k)
Net capital gain/loss in AGI: +$3,950 (reported on 9.5% of returns)
Here:
+$3,950
State:
+$16,323
(% of AGI for various income ranges: 0.3% for AGIs $75k-100k, 0.5% for AGIs $100k-200k, 5.9% for AGIs over 200k)
Profit/loss from business: +$5,533 (reported on 14.6% of returns)
Here:
+$5,533
State:
+$7,583
(% of AGI for various income ranges: 5.8% for AGIs below $25k, 0.2% for AGIs $25k-50k, 0.1% for AGIs $50k-75k, 0.7% for AGIs $75k-100k, 0.9% for AGIs $100k-200k, 6.6% for AGIs over 200k)
Taxable individual retirement arrangement distribution: $11,484 (reported on 6.5% of returns)
31088:
$11,484
Georgia:
$17,199
(% of AGI for various income ranges: 0.9% for AGIs below $25k, 1.0% for AGIs $25k-50k, 1.2% for AGIs $50k-75k, 1.5% for AGIs $75k-100k, 1.8% for AGIs $100k-200k, 2.2% for AGIs over 200k)
Self-employment retirement plans: $21,240 (reported on 0.2% of returns)
31088:
$21,240
Georgia:
$23,277
Total itemized deductions: $19,916 (22% of AGI, reported on 36.1% of returns)
Here:
$19,916
State:
$23,886
Here:
22.2% of AGI
State:
21.5% of AGI
(% of AGI for various income ranges: 6.3% for AGIs below $25k, 11.6% for AGIs $25k-50k, 14.8% for AGIs $50k-75k, 15.5% for AGIs $75k-100k, 15.8% for AGIs $100k-200k, 13.3% for AGIs over 200k)
Charity contributions: $4,986 (reported on 31.7% of returns)
Here:
$4,986
State:
$5,507
(% of AGI for various income ranges: 0.8% for AGIs below $25k, 2.2% for AGIs $25k-50k, 3.1% for AGIs $50k-75k, 3.2% for AGIs $75k-100k, 3.9% for AGIs $100k-200k, 3.5% for AGIs over 200k)
Taxes paid: $6,211 (reported on 36.0% of returns)
31088:
$6,211
State:
$7,838
(% of AGI for various income ranges: 1.0% for AGIs below $25k, 2.3% for AGIs $25k-50k, 4.0% for AGIs $50k-75k, 4.9% for AGIs $75k-100k, 5.8% for AGIs $100k-200k, 5.8% for AGIs over 200k)
Earned income credit: $2,605 (reported on 21.9% of returns)
Here:
$2,605
State:
$2,589
(% of AGI for various income ranges: 9.9% for AGIs below $25k, 1.3% for AGIs $25k-50k)
Percentage of individuals using paid preparers for their 2012 taxes: 40.8%
Here:
41%
State:
55%
(% for various income ranges: 39.6% for AGIs below $25k, 39.5% for AGIs $25k-50k, 41.2% for AGIs $50k-75k, 42.1% for AGIs $75k-100k, 42.7% for AGIs $100k-200k, 66.7% for AGIs over 200k)
Averages for the 2004 tax year for zip code 31088, filed in 2005:
Average Adjusted Gross Income (AGI) in 2004: $46,068 (Individual Income Tax Returns)
Here:
$46,068
State:
$47,553
Salary/wage: $41,796 (reported on 87.6% of returns)
Here:
$41,796
State:
$42,178
(% of AGI for various income ranges: 111.9% for AGIs below $10k, 81.8% for AGIs $10k-25k, 80.4% for AGIs $25k-50k, 80.7% for AGIs $50k-75k, 83.4% for AGIs $75k-100k, 72.9% for AGIs over 100k)
Taxable interest for individuals: $991 (reported on 41.6% of returns)
This zip code:
$991
Georgia:
$1,772
(% of AGI for various income ranges: 3.4% for AGIs below $10k, 1.2% for AGIs $10k-25k, 0.9% for AGIs $25k-50k, 0.8% for AGIs $50k-75k, 0.8% for AGIs $75k-100k, 0.8% for AGIs over 100k)
Taxable dividends: $1,594 (reported on 18.4% of returns)
Here:
$1,594
State:
$4,283
(% of AGI for various income ranges: 1.9% for AGIs below $10k, 0.5% for AGIs $10k-25k, 0.5% for AGIs $25k-50k, 0.4% for AGIs $50k-75k, 0.5% for AGIs $75k-100k, 1.0% for AGIs over 100k)
Net capital gain/loss: +$4,780 (reported on 13.7% of returns)
Here:
+$4,780
State:
+$16,461
(% of AGI for various income ranges: -0.7% for AGIs below $10k, -0.1% for AGIs $10k-25k, 0.1% for AGIs $25k-50k, 0.2% for AGIs $50k-75k, 0.5% for AGIs $75k-100k, 4.3% for AGIs over 100k)
Profit/loss from business: +$7,030 (reported on 11.8% of returns)
Here:
+$7,030
State:
+$8,201
(% of AGI for various income ranges: 1.0% for AGIs below $10k, 2.2% for AGIs $10k-25k, 0.8% for AGIs $25k-50k, 0.8% for AGIs $50k-75k, 0.9% for AGIs $75k-100k, 3.8% for AGIs over 100k)
IRA payment deduction: $2,440 (reported on 2.6% of returns)
31088:
$2,440
Georgia:
$2,969
(% of AGI for various income ranges: 0.1% for AGIs below $10k, 0.1% for AGIs $10k-25k, 0.2% for AGIs $25k-50k, 0.1% for AGIs $50k-75k, 0.1% for AGIs $75k-100k, 0.1% for AGIs over 100k)
Self-employed pension: $13,575 (reported on 0.4% of returns)
Here:
$13,575
Georgia:
$16,203
Total itemized deductions: $17,244 (22% of AGI, reported on 39.6% of returns)
Here:
$17,244
State:
$19,944
Here:
22.4% of AGI
State:
22.6% of AGI
(% of AGI for various income ranges: 8.0% for AGIs below $10k, 7.5% for AGIs $10k-25k, 13.0% for AGIs $25k-50k, 15.5% for AGIs $50k-75k, 16.5% for AGIs $75k-100k, 16.7% for AGIs over 100k)
Charity contributions deductions: $4,012 (5% of AGI, reported on 36.2% of returns)
Here:
$4,012
State:
$4,354
Here:
5.1% of AGI
State:
4.7% of AGI
(% of AGI for various income ranges: 0.7% for AGIs below $10k, 1.1% for AGIs $10k-25k, 2.6% for AGIs $25k-50k, 3.2% for AGIs $50k-75k, 3.6% for AGIs $75k-100k, 3.9% for AGIs over 100k)
Total tax: $6,079 (reported on 75.4% of returns)
31088:
$6,079
State:
$8,223
(% of AGI for various income ranges: 2.6% for AGIs below $10k, 3.5% for AGIs $10k-25k, 6.3% for AGIs $25k-50k, 8.7% for AGIs $50k-75k, 10.0% for AGIs $75k-100k, 15.5% for AGIs over 100k)
Earned income credit: $1,937 (reported on 17.2% of returns)
Here:
$1,937
State:
$1,986
Percentage of individuals using paid preparers for their 2004 taxes: 53.5%
Here:
54%
State:
62%
(% for various income ranges: 46.4% for AGIs below $10k, 61.0% for AGIs $10k-25k, 55.9% for AGIs $25k-50k, 53.0% for AGIs $50k-75k, 47.2% for AGIs $75k-100k, 50.5% for AGIs over 100k)
Likely homosexual households (counted as self-reported same-sex unmarried-partner households)
Lesbian couples: 0.0% of all households
Gay men: 0.1% of all households
Household received Food Stamps/SNAP in the past 12 months: 2,107 Household did not receive Food Stamps/SNAP in the past 12 months: 19,791
Women who had a birth in the past 12 months: 757 (551 now married, 205 unmarried) Women who did not have a birth in the past 12 months: 13,998 (5,887 now married, 8,108 unmarried)
Housing units in zip code 31088 with a mortgage: 9,651 (874 second mortgage, 604 both second mortgage and home equity loan) Houses without a mortgage: 283
Median monthly owner costs for units with a mortgage: $1,381 Median monthly owner costs for units without a mortgage: $401
Residents with income below the poverty level in 2022:
This zip code:
7.9%
Whole state:
12.7%
Residents with income below 50% of the poverty level in 2022:
This zip code:
3.4%
Whole state:
6.3%
Median number of rooms in houses and condos:
Here:
6.6
State:
6.8
Median number of rooms in apartments:
Here:
4.8
State:
4.6
Notable locations in this zip code not listed on our city pages
9,623 married couples with children.
3,653 single-parent households (504 men, 3,149 women).
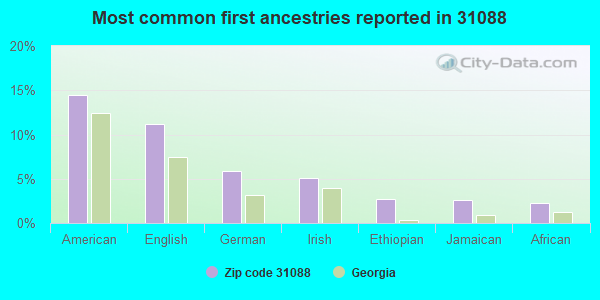
90.4% of residents of 31088 zip code speak English at home.
3.8% of residents speak Spanish at home (58% very well, 29% well, 11% not well, 2% not at all).
1.7% of residents speak other Indo-European language at home (59% very well, 39% well, 2% not at all).
3.7% of residents speak Asian or Pacific Island language at home (54% very well, 23% well, 15% not well, 8% not at all).
0.1% of residents speak other language at home (50% very well, 50% well).
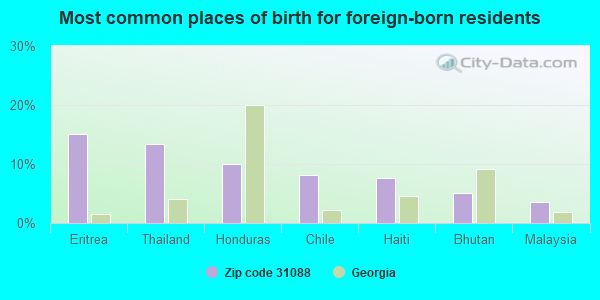
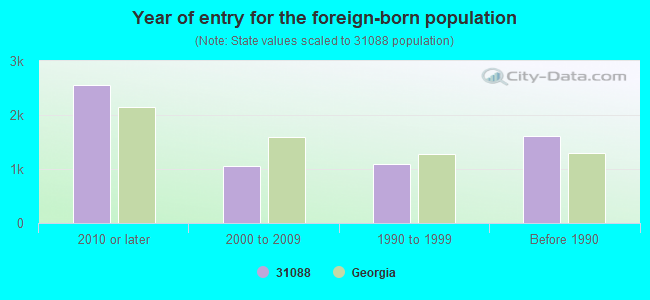
Foreign born population: 4,803 (8.1%) (53.2% of them are naturalized citizens)
Major facilities with environmental interests located in this zip code:
CIRCLE K #2298 (599 S HOUSTON LAKE in WARNER ROBINS, GA)
STATE MASTER (Georgia's Geographic Environmental Information) - UST-1, UNDERGROUND STORAGE TANK PROGRAM, UST-2, UST-3, Conditionally Exempt Small Quantity Generators, less than 100 kg/month of hazardous waste (Resource Conservation and Recovery Act (tracking hazardous waste)) - notification Organizations: ATC ASSOCIATES INC (CONTACT/AGENT)
, CIRCLE K STORES INC (CONTACT/OPERATOR)
, LEROY H CARTER (CONTACT/OWNER)
Alternative names: CIRCLE K STORES INC #2298
MIDDLE GEORGIA TECHNICAL COLLEGE (80 COHEN WALKER DRIVE in WARNER ROBINS, GA)
STATE MASTER (Georgia's Geographic Environmental Information) - UST-2, UNDERGROUND STORAGE TANK PROGRAM, UST-1, Conditionally Exempt Small Quantity Generators, less than 100 kg/month of hazardous waste (Resource Conservation and Recovery Act (tracking hazardous waste)) Organizations: MIDDLE GA TECH COLLEGE (CONTACT/OPERATOR)
, DEPT OF TECH & ADULT EDUCATION (CONTACT/OWNER)
, SE GEN CONT (INSTALLER)
ANCHOR GLASS CONTAINER CORP (1044 BOOTH RD in WARNER ROBINS, GA)
AIR MAJOR (AIRS/AFS) CRITERIA AND HAZARDOUS AIR POLLUTANT INVENTORY (Inventory of air pollution sources) HAZARDOUS WASTE BIENNIAL REPORTER (Resource Conservation and Recovery Act (tracking hazardous waste)) Large Quantity Generators, more that 1000 kg of hazardous waste/month (Resource Conservation and Recovery Act (tracking hazardous waste)) - notification TRI REPORTER (Tracking of toxic chemicals releasing facilities) Business SIC classification: GLASS CONTAINERS Business NAICS classification: GLASS CONTAINER MANUFACTURING. Alternative names: ANCHOR GLASS CO INC PLT 14
BERT RUMBLE MIDDLE SCHOOL (303 SOUTH DAVIS DRIVE in WARNER ROBINS, GA)
(National Center for Education Statistics) - STATE ID-3054 Organizations: HOUSTON COUNTY (SCHOOL DISTRICT)
PEARL STEPHENS ELEMENTARY SCHOOL (215 SCOTT BOULEVARD in WARNER ROBINS, GA)
(National Center for Education Statistics) - STATE ID-0175 Organizations: HOUSTON COUNTY (SCHOOL DISTRICT)
PERDUE ELEMENTARY SCHOOL (856 HIGHWAY 96 in WARNER ROBINS, GA)
(National Center for Education Statistics) - STATE ID-0194 Organizations: HOUSTON COUNTY (SCHOOL DISTRICT)
QUAIL RUN ELEMENTARY SCHOOL (250 SMITHVILLE CHURCH ROAD in WARNER ROBINS, GA)
(National Center for Education Statistics) - STATE ID-0195 Organizations: HOUSTON COUNTY (SCHOOL DISTRICT)
FEAGIN MILL MIDDLE SCHOOL (1200 FEAGIN MILL ROAD in WARNER ROBINS, GA)
(National Center for Education Statistics) - STATE ID-0196 Organizations: HOUSTON COUNTY (SCHOOL DISTRICT)
LINWOOD ELEMENTARY SCHOOL (1050 EDUCATION WAY in WARNER ROBINS, GA)
(National Center for Education Statistics) - STATE ID-0102 Organizations: HOUSTON COUNTY (SCHOOL DISTRICT)
MILLER ELEMENTARY SCHOOL (101 PINE VALLEY DRIVE in WARNER ROBINS, GA)
(National Center for Education Statistics) - STATE ID-5050 Organizations: HOUSTON COUNTY (SCHOOL DISTRICT)
CASCADE CORPORATION (104 INDL. PARK BLVD. in WARNER ROBINS, GA)
CRITERIA AND HAZARDOUS AIR POLLUTANT INVENTORY (Inventory of air pollution sources) Conditionally Exempt Small Quantity Generators, less than 100 kg/month of hazardous waste (Resource Conservation and Recovery Act (tracking hazardous waste)) - notification TRI REPORTER (Tracking of toxic chemicals releasing facilities) Business SIC classification: INDUSTRIAL TRUCKS, TRACTORS, TRAILERS, AND STACKERS Organizations: OPERNAME (CONTACT/OPERATOR)
Alternative names: CASCADE CORP.
LANDMARK OLDS CADILLAC (741 RUSSELL PKWY in WARNER ROBINS, GA)
(Resource Conservation and Recovery Act (tracking hazardous waste)) Organizations: OPERNAME (CONTACT/OPERATOR)
, JONES ALFRED (CONTACT/OWNER)
NORTHROP CRUMMAN REG SVC CTR (1000 PARK DR in WARNER ROBINS, GA)
(Resource Conservation and Recovery Act (tracking hazardous waste)) Organizations: THE PARK C/O R WAYNE LOWE (CONTACT/OWNER)
Housing units lacking complete plumbing facilities: 0.7% Housing units lacking complete kitchen facilities: 1.1%
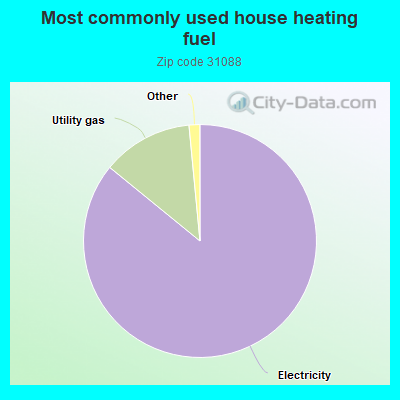
85.9%Electricity
12.6%Utility gas
0.7%No fuel used
0.6%Bottled, tank, or LP gas
Population in 1990: 34,526. Population change in the 1990s: +3,540 (+10.3%).
Place of birth for U.S.-born residents:
This state: 29,959
Northeast: 4,403
Midwest: 4,803
South: 10,818
West: 3,157
46% of the 31088 zip code residents lived in the same house 5 years ago. Out of people who lived in different houses, 47% lived in this county. Out of people who lived in different counties, 50% lived in Georgia.
87% of the 31088 zip code residents lived in the same house 1 year ago. Out of people who lived in different houses, 40% moved from this county. Out of people who lived in different houses, 38% moved from different county within same state. Out of people who lived in different houses, 19% moved from different state. Out of people who lived in different houses, 2% moved from abroad.
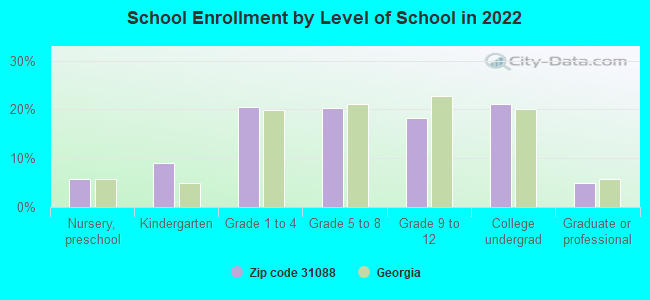
Private vs. public school enrollment:
Students in private schools in grades 1 to 8 (elementary and middle school): 35
Here:
0.6%
Georgia:
12.1%
Students in private schools in grades 9 to 12 (high school): 131
Here:
4.5%
Georgia:
10.8%
Students in private undergraduate colleges: 228
Here:
6.7%
Georgia:
17.1%
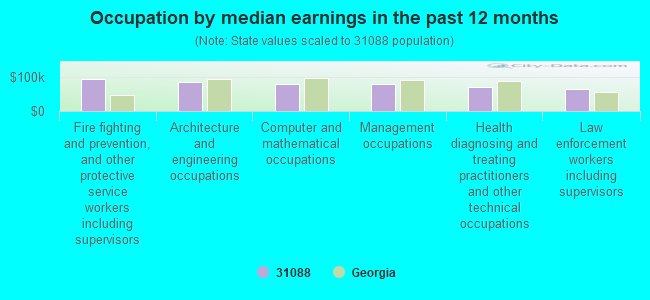
Occupation by median earnings in the past 12 months ($)
93,001Fire fighting and prevention, and other protective service workers including supervisors
84,083Architecture and engineering occupations
80,488Computer and mathematical occupations
78,231Management occupations
70,727Health diagnosing and treating practitioners and other technical occupations
65,783Law enforcement workers including supervisors
Companies with biggest federal contracts located in this zip code (WARNER ROBINS, GA):
TCS DESIGN & MANAGEMENT SERVIC (324 CORDER RD; small business) : $126,994,184 in 295 contractsfrom 1999 to 2006
Contracts for Systems Engineering Services, Miscellaneous Aircraft Accessories and Components, Program Management/Support Services, Maintenance, Repair and Rebuilding of Equipment -- Miscellaneous, and moreby Air Force, Department of Defense Signed by year:2000: $2,585,616; 2001: $1,932,069; 2002: $3,822,054; 2003: $20,912,659; 2004: $44,031,406; 2005: $38,506,175; 2006: $15,539,205.
Biggest contracts:
$16,998,048 with Air Force for Systems Engineering Services. Signed on 2005-11-21. Completion date: 2008-04-30.
$13,367,729, same as above.Signed on 2004-06-21. Completion date: 2007-05-13.
$12,890,671, same as above.Signed on 2004-05-14. Completion date: 2007-02-14.
$7,936,467, same as above.Signed on 2003-09-20. Completion date: 2004-09-19.
NORTHROP GRUMMAN SYSTEMS CORPO (101 INDUSTRIAL PARK BLVD) : $15,453,086 in 51 contractsfrom 2000 to 2006
Contracts for Miscellaneous Communication Equipment, Radar Equipment, Except Airborne, Electrical and Electronic assemblies, Boards, Cards, and Associated Hardware, Converters, Electrical, Nonrotating, and moreby Air Force, Navy, Defense Logistics Agency Signed by year:2000: $158,016; 2001: $0; 2002: $2,438,921; 2003: $5,672,822; 2004: $4,847,126; 2005: $1,905,604; 2006: $430,597.
Biggest contracts:
$1,996,767 with Air Force for Miscellaneous Communication Equipment. Signed on 2003-09-30. Completion date: 2004-12-31.
$1,878,813 with Navy for Radar Equipment, Except Airborne. Signed on 2004-07-30. Completion date: 2005-07-30.
$1,412,904 with Air Force for Electrical and Electronic assemblies, Boards, Cards, and Associated Hardware. Signed on 2003-05-08. Completion date: 2004-05-31.
$1,404,389 with Navy for Radar Equipment, Except Airborne. Signed on 2005-02-24. Completion date: 2006-06-24.
AMA TECHNOLOGIES INC (401 PARK DR; small business) : $6,529,967 in 26 contractsfrom 1999 to 2003
Contracts for Audio/Visual Services, Engineering and Technical Services, Systems Engineering Services, Airframe Structural Components, and moreby Army, Navy, Air Force, Alcohol and Tobacco Tax and Trade Bureau, and others Signed by year:2000: $2,584,540; 2001: $724,706; 2002: $2,210,411; 2003: $968,310; 2004: $0; 2005: $0; 2006: $0.
Biggest contracts:
$1,392,660 with Army for Audio/Visual Services. Taking place in FL. Signed on 2000-01-28. Completion date: 2000-09-30.
$667,332 with Navy for Engineering and Technical Services. Taking place in FL. Signed on 2000-05-19. Completion date: 2002-08-31.
$620,000 with Air Force for Systems Engineering Services. Signed on 2003-03-24. Completion date: 2004-03-31.
$620,000, same as above.Signed on 2002-02-25. Completion date: 2003-02-24.
MGB SCIENCE & TECHNOLOGY LLC (124 OSIGIAN BLVD STE B; small business) : $4,274,257 in 17 contractsfrom 2000 to 2006
Contracts for Systems Engineering Services, Books and Pamphlets, Engineering and Technical Services, Technical Writing Services, and moreby Air Force Signed by year:2000: $860,676; 2001: $1,558,903; 2002: $551,614; 2003: $622,378; 2004: $0; 2005: $290,882; 2006: $389,804.
Biggest contracts:
$1,100,224 with Air Force for Systems Engineering Services. Signed on 2001-01-31. Completion date: 2002-02-28.
$511,954 with Air Force for Books and Pamphlets. Signed on 2002-12-01. Completion date: 2003-11-30.
$500,074 with Air Force for Engineering and Technical Services. Signed on 2003-07-25. Completion date: 2003-12-31.
$421,676 with Air Force for Systems Engineering Services. Signed on 2000-08-21. Completion date: 2001-10-31.
NORTHROP GRUMMAN SYSTEMS CORPO (ES - REGIONAL SERVICE CENT) : $4,168,275 in 18 contractsfrom 2000 to 2005
Contracts for Converters, Electrical, Nonrotating, Radar Equipment, Except Airborne, Miscellaneous Communication Equipment, Electrical and Electronic assemblies, Boards, Cards, and Associated Hardware, and moreby Air Force, Navy Signed by year:2000: -$95,119; 2001: $39,010; 2002: $3,954,792; 2003: $164,727; 2004: $44,555; 2005: $60,310; 2006: $0.
Biggest contracts:
$2,602,256 with Air Force for Converters, Electrical, Nonrotating. Signed on 2002-12-12. Completion date: 2003-02-20.
$968,563, same as above.Signed on 2002-11-26. Completion date: 2003-11-28.
$318,514 with Navy for Radar Equipment, Except Airborne. Signed on 2002-12-18. Completion date: 2003-08-18.
$83,753, same as above.Signed on 2003-07-02. Completion date: 2003-12-19.
NETSOFT ASSOCIATES INC (114 CONSTITUTION DR STE 30; small business) : $3,224,544 in 19 contractsfrom 2005 to 2006
Contracts for Other Administrative Support Services, Automated Information System Design and Integration Services, ADP Systems Analysis Services, Services -- Operational Systems Development (R&D), and moreby Air Force Signed by year:2000: $0; 2001: $0; 2002: $0; 2003: $0; 2004: $0; 2005: $2,153,940; 2006: $1,070,604.
Biggest contracts:
$544,183 with Air Force for Other Administrative Support Services. Signed on 2005-02-15. Completion date: 2005-01-17.
$464,863, same as above.Signed on 2006-02-17. Completion date: 2007-02-17.
$398,336 with Air Force for Automated Information System Design and Integration Services. Signed on 2005-10-01. Completion date: 2006-05-31.
$391,296 with Air Force for ADP Systems Analysis Services. Signed on 2005-10-01. Completion date: 2006-09-30.
PROSPECTIVE COMPUTER ANALYSTS (120 OSIGIAN BLVD STE 100; small business) : $2,078,882 in 10 contractsfrom 2001 to 2006
Contracts for Electronic Countermeasures, Counter-Countermeasures and Quick Reaction Capability Equipment, Aircraft Maintenance and Repair Shop Specialized Equipment, Electrical and Electronic Properties Measuring and Testing Instruments, Cable, Cord, and Wire Assemblies: Communications Equipment, and moreby Air Force, Navy, Defense Logistics Agency Signed by year:2000: $0; 2001: $248,270; 2002: $1,152,994; 2003: $34,479; 2004: $301,650; 2005: $317,482; 2006: $24,007.
Biggest contracts:
$1,014,900 with Air Force for Electronic Countermeasures, Counter-Countermeasures and Quick Reaction Capability Equipment. Signed on 2002-09-27. Completion date: 2003-09-30.
$308,670 with Navy for Aircraft Maintenance and Repair Shop Specialized Equipment. Signed on 2005-11-29. Completion date: 2006-11-29.
$301,650 with Air Force for Electrical and Electronic Properties Measuring and Testing Instruments. Signed on 2004-09-10. Completion date: 2005-06-10.
$139,971 with Defense Logistics Agency for Cable, Cord, and Wire Assemblies: Communications Equipment. Signed on 2001-05-29. Completion date: 2001-10-11.
LOUI CONSULTING GROUP INC (151 OSIGIAN BOULEVARD; small business) : $1,957,203 in 6 contractsfrom 2005 to 2006
Contracts for Systems Engineering Services by Air Force Signed by year:2000: $0; 2001: $0; 2002: $0; 2003: $0; 2004: $0; 2005: $1,091,203; 2006: $866,000.
Biggest contracts:
$497,000 with Air Force for Systems Engineering Services. Signed on 2006-04-24. Completion date: 2007-05-15.
$477,210, same as above.Signed on 2005-05-13. Completion date: 2006-05-15.
$449,819, same as above.Signed on 2005-06-09. Completion date: 2006-05-31.
$369,000, same as above.Signed on 2006-06-06. Completion date: 2007-02-18.
ACOUSTICAL FLOORS INC (112 S HOUSTON LAKE RD; small business) : $1,549,817 in 60 contractsfrom 2000 to 2006
Contracts for Floor Coverings, Maintenance, Repair and Rebuilding of Equipment -- Miscellaneous, Maintenance, Repair or Alteration of Real Property -- Family Housing Facilities, Carpet Laying and Cleaning by Air Force Signed by year:2000: $243,557; 2001: $266,115; 2002: $30,854; 2003: $304,553; 2004: $106,412; 2005: $477,904; 2006: $120,422.
Biggest contracts:
$108,851 with Air Force for Floor Coverings. Signed on 2004-05-25. Completion date: 2004-08-27.
$87,412, same as above.Signed on 2006-01-20. Completion date: 2006-04-28.
$81,949 with Air Force for Maintenance, Repair and Rebuilding of Equipment -- Miscellaneous. Signed on 2005-09-16. Completion date: 2005-12-18.
$80,338, same as above.Signed on 2005-08-23. Completion date: 2005-11-23.
TERMA NORTH AMERICA INC (645 TALLULAH TR STE 204; small business) 50 employees, $0 revenue.
$755,605 with Air Force for Systems Engineering Services. Signed on 2005-11-30. Completion date: 2006-08-24.
Top industries in this zip code by the number of employees in 2005:
Professional, Scientific, and Technical Services: Research and Development in the Physical, Engineering, and Life Sciences (100-249: 2, 50-99: 1, 20-49: 1, 5-9: 1, 1-4: 2)
Health Care and Social Assistance: Offices of Physicians (except Mental Health Specialists) (20-49: 3, 10-19: 10, 5-9: 13, 1-4: 10)
Other Services (except Public Administration): Religious Organizations (50-99: 1, 20-49: 4, 10-19: 6, 5-9: 3, 1-4: 6)
Health Care and Social Assistance: Offices of Dentists (20-49: 3, 10-19: 9, 5-9: 7, 1-4: 2)
Health Care and Social Assistance: Child Day Care Services (20-49: 4, 10-19: 4, 5-9: 1)
People in group quarters in 2010:
15 people in local jails and other municipal confinement facilities
4 people in group homes intended for adults
People in group quarters in 2000:
80 people in other noninstitutional group quarters
67 people in nursing homes
4 people in homes for the mentally retarded
2 people in religious group quarters
Home Mortgage Disclosure Act Aggregated Statistics For Year 2009 (Based on 6 full and 14 partial tracts)
A) FHA, FSA/RHS & VA Home Purchase Loans
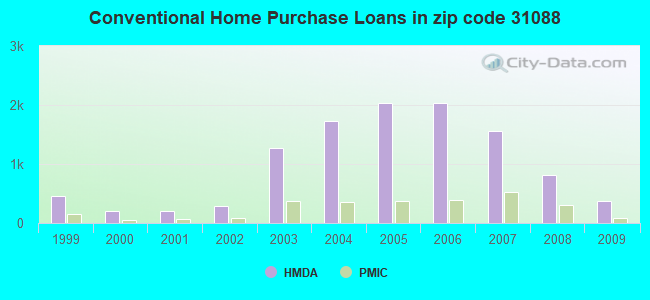
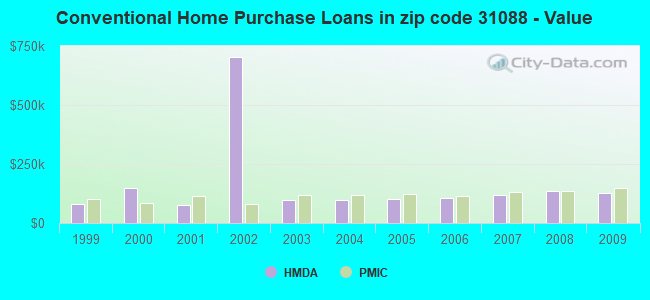
B) Conventional Home Purchase Loans
C) Refinancings
D) Home Improvement Loans
E) Loans on Dwellings For 5+ Families
F) Non-occupant Loans on < 5 Family Dwellings (A B C & D)
G) Loans On Manufactured Home Dwelling (A B C & D)
Number
Average Value
Number
Average Value
Number
Average Value
Number
Average Value
Number
Average Value
Number
Average Value
Number
Average Value
LOANS ORIGINATED
893
$148,198
368
$126,204
1,653
$149,637
94
$49,602
4
$4,026,365
267
$100,532
6
$74,965
APPLICATIONS APPROVED, NOT ACCEPTED
34
$128,162
14
$109,824
109
$154,205
8
$98,820
0
$0
10
$95,002
1
$30,180
APPLICATIONS DENIED
87
$124,786
49
$113,412
594
$140,577
82
$37,305
2
$806,200
41
$101,777
12
$99,234
APPLICATIONS WITHDRAWN
92
$143,027
39
$155,661
407
$152,442
22
$88,691
0
$0
15
$87,073
3
$121,513
FILES CLOSED FOR INCOMPLETENESS
14
$108,724
5
$147,944
114
$139,918
4
$91,980
0
$0
6
$85,083
0
$0
Aggregated Statistics For Year 2008 (Based on 6 full and 14 partial tracts)
A) FHA, FSA/RHS & VA Home Purchase Loans
B) Conventional Home Purchase Loans
C) Refinancings
D) Home Improvement Loans
E) Loans on Dwellings For 5+ Families
F) Non-occupant Loans on < 5 Family Dwellings (A B C & D)
G) Loans On Manufactured Home Dwelling (A B C & D)
Number
Average Value
Number
Average Value
Number
Average Value
Number
Average Value
Number
Average Value
Number
Average Value
Number
Average Value
LOANS ORIGINATED
677
$140,346
817
$137,210
1,238
$123,095
141
$32,333
8
$2,567,858
519
$105,580
29
$48,073
APPLICATIONS APPROVED, NOT ACCEPTED
30
$113,332
60
$156,517
152
$131,473
27
$41,794
0
$0
22
$79,467
12
$58,916
APPLICATIONS DENIED
78
$127,535
124
$111,955
630
$135,613
186
$51,440
0
$0
67
$84,734
21
$45,174
APPLICATIONS WITHDRAWN
72
$128,745
63
$160,002
366
$147,246
27
$115,909
0
$0
25
$119,269
5
$72,760
FILES CLOSED FOR INCOMPLETENESS
14
$149,768
21
$148,956
57
$158,788
6
$39,203
0
$0
3
$126,183
0
$0
Aggregated Statistics For Year 2007 (Based on 6 full and 14 partial tracts)
A) FHA, FSA/RHS & VA Home Purchase Loans
B) Conventional Home Purchase Loans
C) Refinancings
D) Home Improvement Loans
E) Loans on Dwellings For 5+ Families
F) Non-occupant Loans on < 5 Family Dwellings (A B C & D)
G) Loans On Manufactured Home Dwelling (A B C & D)
Number
Average Value
Number
Average Value
Number
Average Value
Number
Average Value
Number
Average Value
Number
Average Value
Number
Average Value
LOANS ORIGINATED
643
$146,419
1,560
$117,506
1,269
$124,950
293
$34,188
9
$7,278,781
558
$94,739
22
$68,183
APPLICATIONS APPROVED, NOT ACCEPTED
18
$152,623
142
$117,607
256
$128,581
36
$45,552
0
$0
41
$75,774
12
$64,939
APPLICATIONS DENIED
74
$140,041
241
$118,257
942
$118,738
243
$50,145
0
$0
100
$87,314
20
$53,088
APPLICATIONS WITHDRAWN
58
$126,411
179
$144,156
456
$134,841
60
$71,982
0
$0
35
$67,623
3
$50,623
FILES CLOSED FOR INCOMPLETENESS
3
$114,007
41
$121,324
111
$139,505
13
$59,118
4
$1,198,518
10
$90,500
0
$0
Aggregated Statistics For Year 2006 (Based on 6 full and 14 partial tracts)
A) FHA, FSA/RHS & VA Home Purchase Loans
B) Conventional Home Purchase Loans
C) Refinancings
D) Home Improvement Loans
E) Loans on Dwellings For 5+ Families
F) Non-occupant Loans on < 5 Family Dwellings (A B C & D)
G) Loans On Manufactured Home Dwelling (A B C & D)
Number
Average Value
Number
Average Value
Number
Average Value
Number
Average Value
Number
Average Value
Number
Average Value
Number
Average Value
LOANS ORIGINATED
833
$148,380
2,037
$104,039
1,238
$108,731
170
$33,411
12
$5,091,520
489
$77,800
31
$98,533
APPLICATIONS APPROVED, NOT ACCEPTED
24
$130,664
175
$96,781
233
$93,069
51
$35,287
0
$0
35
$80,397
9
$43,210
APPLICATIONS DENIED
50
$134,537
307
$109,787
953
$106,677
226
$33,482
0
$0
81
$80,856
27
$63,324
APPLICATIONS WITHDRAWN
52
$135,357
213
$110,966
606
$109,159
33
$75,271
0
$0
37
$75,393
4
$73,650
FILES CLOSED FOR INCOMPLETENESS
11
$132,144
42
$114,980
158
$132,068
2
$33,250
2
$323,285
14
$66,746
0
$0
Aggregated Statistics For Year 2005 (Based on 6 full and 14 partial tracts)
A) FHA, FSA/RHS & VA Home Purchase Loans
B) Conventional Home Purchase Loans
C) Refinancings
D) Home Improvement Loans
E) Loans on Dwellings For 5+ Families
F) Non-occupant Loans on < 5 Family Dwellings (A B C & D)
G) Loans On Manufactured Home Dwelling (A B C & D)
Number
Average Value
Number
Average Value
Number
Average Value
Number
Average Value
Number
Average Value
Number
Average Value
Number
Average Value
LOANS ORIGINATED
865
$133,655
2,029
$99,678
1,430
$104,634
159
$44,321
10
$2,675,459
527
$77,048
23
$43,348
APPLICATIONS APPROVED, NOT ACCEPTED
22
$126,506
170
$108,603
224
$109,616
31
$40,469
0
$0
16
$84,499
11
$46,020
APPLICATIONS DENIED
56
$115,990
304
$93,300
1,003
$98,726
247
$46,617
2
$322,480
103
$64,447
54
$59,670
APPLICATIONS WITHDRAWN
40
$138,487
214
$105,328
656
$114,488
107
$112,600
0
$0
40
$106,004
9
$78,107
FILES CLOSED FOR INCOMPLETENESS
15
$106,911
81
$110,630
220
$120,206
13
$34,733
0
$0
29
$83,534
2
$58,085
Aggregated Statistics For Year 2004 (Based on 6 full and 14 partial tracts)
A) FHA, FSA/RHS & VA Home Purchase Loans
B) Conventional Home Purchase Loans
C) Refinancings
D) Home Improvement Loans
E) Loans on Dwellings For 5+ Families
F) Non-occupant Loans on < 5 Family Dwellings (A B C & D)
G) Loans On Manufactured Home Dwelling (A B C & D)
Number
Average Value
Number
Average Value
Number
Average Value
Number
Average Value
Number
Average Value
Number
Average Value
Number
Average Value
LOANS ORIGINATED
892
$124,556
1,722
$99,074
1,575
$97,242
106
$43,271
10
$970,219
502
$65,609
26
$58,292
APPLICATIONS APPROVED, NOT ACCEPTED
22
$100,912
154
$102,088
293
$103,099
29
$30,124
0
$0
35
$73,278
14
$49,099
APPLICATIONS DENIED
54
$103,574
238
$87,815
881
$94,438
159
$36,181
0
$0
68
$72,275
36
$60,601
APPLICATIONS WITHDRAWN
42
$126,143
168
$92,986
616
$101,764
40
$42,426
0
$0
38
$73,511
4
$58,328
FILES CLOSED FOR INCOMPLETENESS
6
$115,272
49
$112,570
186
$108,149
25
$44,951
0
$0
13
$66,357
3
$36,583
Aggregated Statistics For Year 2003 (Based on 6 full and 14 partial tracts)
A) FHA, FSA/RHS & VA Home Purchase Loans
B) Conventional Home Purchase Loans
C) Refinancings
D) Home Improvement Loans
E) Loans on Dwellings For 5+ Families
F) Non-occupant Loans on < 5 Family Dwellings (A B C & D)
Number
Average Value
Number
Average Value
Number
Average Value
Number
Average Value
Number
Average Value
Number
Average Value
LOANS ORIGINATED
1,057
$118,020
1,276
$98,237
3,608
$101,862
63
$43,853
7
$2,817,099
482
$66,049
APPLICATIONS APPROVED, NOT ACCEPTED
17
$118,291
66
$117,258
248
$95,461
10
$25,823
0
$0
19
$64,146
APPLICATIONS DENIED
58
$101,952
152
$89,517
727
$87,795
82
$24,462
0
$0
48
$62,757
APPLICATIONS WITHDRAWN
59
$105,091
84
$117,491
559
$97,495
17
$45,646
0
$0
60
$69,719
FILES CLOSED FOR INCOMPLETENESS
9
$145,243
30
$114,098
136
$104,339
16
$36,968
0
$0
16
$47,288
Aggregated Statistics For Year 2002 (Based on 4 full and 8 partial tracts)
A) FHA, FSA/RHS & VA Home Purchase Loans
B) Conventional Home Purchase Loans
C) Refinancings
D) Home Improvement Loans
E) Loans on Dwellings For 5+ Families
F) Non-occupant Loans on < 5 Family Dwellings (A B C & D)
Number
Average Value
Number
Average Value
Number
Average Value
Number
Average Value
Number
Average Value
Number
Average Value
LOANS ORIGINATED
224
$93,999
285
$701,675
624
$276,672
29
$2,166,488
10
$552,721
159
$955,940
APPLICATIONS APPROVED, NOT ACCEPTED
2
$114,080
33
$58,536
128
$64,650
8
$20,101
0
$0
13
$44,630
APPLICATIONS DENIED
23
$73,800
58
$83,046
215
$61,393
32
$15,120
0
$0
23
$57,005
APPLICATIONS WITHDRAWN
8
$65,366
25
$79,166
170
$76,458
4
$17,492
0
$0
6
$63,257
FILES CLOSED FOR INCOMPLETENESS
1
$40,570
6
$67,138
31
$85,258
2
$16,515
0
$0
2
$62,885
Aggregated Statistics For Year 2001 (Based on 4 full and 8 partial tracts)
A) FHA, FSA/RHS & VA Home Purchase Loans
B) Conventional Home Purchase Loans
C) Refinancings
D) Home Improvement Loans
E) Loans on Dwellings For 5+ Families
F) Non-occupant Loans on < 5 Family Dwellings (A B C & D)
Number
Average Value
Number
Average Value
Number
Average Value
Number
Average Value
Number
Average Value
Number
Average Value
LOANS ORIGINATED
208
$86,081
206
$75,061
435
$72,185
54
$11,230
4
$75,620
126
$52,558
APPLICATIONS APPROVED, NOT ACCEPTED
4
$67,468
26
$64,013
70
$58,844
10
$17,786
0
$0
5
$58,212
APPLICATIONS DENIED
11
$75,952
71
$62,502
232
$66,213
46
$10,361
0
$0
22
$66,121
APPLICATIONS WITHDRAWN
19
$69,080
20
$76,134
142
$72,787
2
$40,520
0
$0
6
$51,827
FILES CLOSED FOR INCOMPLETENESS
0
$0
3
$37,773
14
$80,756
2
$32,250
0
$0
5
$54,920
Aggregated Statistics For Year 2000 (Based on 4 full and 8 partial tracts)
A) FHA, FSA/RHS & VA Home Purchase Loans
B) Conventional Home Purchase Loans
C) Refinancings
D) Home Improvement Loans
E) Loans on Dwellings For 5+ Families
F) Non-occupant Loans on < 5 Family Dwellings (A B C & D)
Number
Average Value
Number
Average Value
Number
Average Value
Number
Average Value
Number
Average Value
Number
Average Value
LOANS ORIGINATED
259
$76,655
206
$149,304
238
$56,180
25
$18,474
2
$750,715
105
$46,845
APPLICATIONS APPROVED, NOT ACCEPTED
5
$29,404
28
$59,716
78
$61,641
16
$16,623
0
$0
8
$44,770
APPLICATIONS DENIED
34
$62,812
134
$45,977
161
$55,713
49
$23,595
0
$0
22
$33,677
APPLICATIONS WITHDRAWN
18
$64,366
27
$74,332
125
$49,287
5
$26,140
0
$0
6
$36,473
FILES CLOSED FOR INCOMPLETENESS
2
$78,960
5
$50,508
14
$121,167
0
$0
0
$0
0
$0
Aggregated Statistics For Year 1999 (Based on 3 full and 5 partial tracts)
A) FHA, FSA/RHS & VA Home Purchase Loans
B) Conventional Home Purchase Loans
C) Refinancings
D) Home Improvement Loans
E) Loans on Dwellings For 5+ Families
F) Non-occupant Loans on < 5 Family Dwellings (A B C & D)
2002 - 2018 National Fire Incident Reporting System (NFIRS) incidents
Based on the data from the years 2002 - 2018 the average number of fires per year is 131. The highest number of fire incidents - 268 took place in 2010, and the least - 51 in 2015. The data has a growing trend.
When looking into fire subcategories, the most incidents belonged to: Outside Fires (44.6%), and Structure Fires (36.6%).
Fire incident types reported to NFIRS in Zip Code 31088
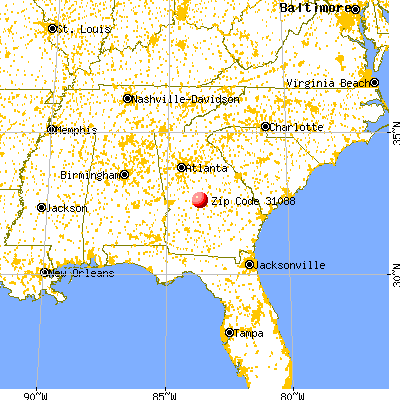


 Nearest zip codes: 31028, 31005, 31093, 31098, 31047, 31216.


 Based on the data from the years 2002 - 2018 the average number of fires per year is 131. The highest number of fire incidents - 268 took place in 2010, and the least - 51 in 2015. The data has a growing trend.
 When looking into fire subcategories, the most incidents belonged to: Outside Fires (44.6%), and Structure Fires (36.6%).