Estimated zip code population in 2022: 18,667 Zip code population in 2010: 11,193 Zip code population in 2000: 5,659
Houses and condos: 6,851 Renter-occupied apartments: 818
% of renters here:
13%
State:
34%
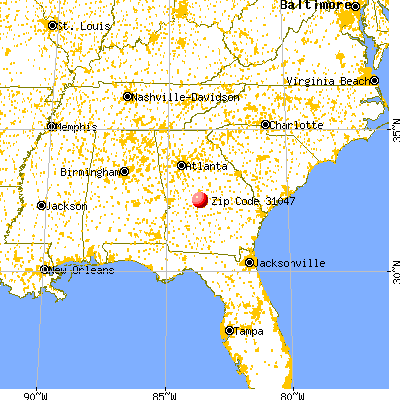
March 2022 cost of living index in zip code 31047: 91.8 (less than average, U.S. average is 100)
Land area: 71.9 sq. mi. Water area: 1.3 sq. mi.
Population density: 260 people per square mile
(very low).
OSM Map
General Map
Google Map
MSN Map
OSM Map
General Map
Google Map
MSN Map
OSM Map
General Map
Google Map
MSN Map
OSM Map
General Map
Google Map
MSN Map
Please wait while loading the map...
Real estate property taxes paid for housing units in 2022:
This zip code:
0.7% ($2,266)
Georgia:
0.7% ($2,160)
Median real estate property taxes paid for housing units with mortgages in 2022: $2,245 (0.7%) Median real estate property taxes paid for housing units with no mortgage in 2022: $2,286 (0.7%)
Estimated median house/condo value in 2022: $306,229
31047:
$306,229
Georgia:
$297,400
According to our research of Georgia and other state lists, there were 20 registered sex offenders living in 31047 zip code as of May 23, 2024. The ratio of all residents to sex offenders in zip code 31047 is 681 to 1. The ratio of registered sex offenders to all residents in this zip code is lower than the state average.
Median resident age:
This zip code:
38.4 years
Georgia median age:
37.6 years
Average household size:
This zip code:
2.9 people
Georgia:
2.6 people
Averages for the 2020 tax year for zip code 31047, filed in 2021:
Average Adjusted Gross Income (AGI) in 2020: $80,536 (Individual Income Tax Returns)
Here:
$80,536
State:
$70,847
Salary/wage: $69,314 (reported on 85.8% of returns)
Here:
$69,314
State:
$59,126
(% of AGI for various income ranges: 1228.7% for AGIs below $25k, 3738.3% for AGIs $25k-50k, 6370.7% for AGIs $50k-75k, 9474.8% for AGIs $75k-100k, 19086.1% for AGIs $100k-200k, 65012.7% for AGIs over 200k)
Taxable interest for individuals: $899 (reported on 34.4% of returns)
This zip code:
$899
Georgia:
$2,011
(% of AGI for various income ranges: 7.7% for AGIs below $25k, 18.8% for AGIs $25k-50k, 30.9% for AGIs $50k-75k, 40.1% for AGIs $75k-100k, 66.0% for AGIs $100k-200k, 737.3% for AGIs over 200k)
Ordinary dividends: $3,491 (reported on 17.1% of returns)
Here:
$3,491
State:
$8,996
(% of AGI for various income ranges: 11.5% for AGIs below $25k, 20.3% for AGIs $25k-50k, 41.0% for AGIs $50k-75k, 52.1% for AGIs $75k-100k, 117.6% for AGIs $100k-200k, 2065.5% for AGIs over 200k)
Net capital gain/loss in AGI: +$14,386 (reported on 15.7% of returns)
Here:
+$14,386
State:
+$28,402
(% of AGI for various income ranges: 6.8% for AGIs below $25k, 12.5% for AGIs $25k-50k, 45.4% for AGIs $50k-75k, 107.7% for AGIs $75k-100k, 352.7% for AGIs $100k-200k, 11520.0% for AGIs over 200k)
Profit/loss from business: +$2,746 (reported on 17.8% of returns)
Here:
+$2,746
State:
+$6,707
(% of AGI for various income ranges: 10.7% for AGIs below $25k, 71.3% for AGIs $100k-200k, 3788.2% for AGIs over 200k)
Taxable individual retirement arrangement distribution: $15,375 (reported on 6.0% of returns)
31047:
$15,375
Georgia:
$20,525
(% of AGI for various income ranges: 34.0% for AGIs below $25k, 60.7% for AGIs $25k-50k, 114.6% for AGIs $50k-75k, 141.4% for AGIs $75k-100k, 291.1% for AGIs $100k-200k, 751.8% for AGIs over 200k)
Total itemized deductions: $31,187 (reported on 14.9% of returns)
Here:
$31,187
State:
$34,001
(% of AGI for various income ranges: 37.5% for AGIs below $25k, 251.1% for AGIs $25k-50k, 505.0% for AGIs $50k-75k, 597.2% for AGIs $75k-100k, 1391.2% for AGIs $100k-200k, 8300.0% for AGIs over 200k)
Charity contributions: $13,181 (reported on 13.2% of returns)
Here:
$13,181
State:
$14,164
(% of AGI for various income ranges: 5.8% for AGIs below $25k, 65.7% for AGIs $25k-50k, 127.0% for AGIs $50k-75k, 204.1% for AGIs $75k-100k, 519.3% for AGIs $100k-200k, 4179.1% for AGIs over 200k)
Taxes paid: $7,177 (reported on 14.8% of returns)
31047:
$7,177
State:
$7,540
(% of AGI for various income ranges: 4.2% for AGIs below $25k, 39.5% for AGIs $25k-50k, 106.4% for AGIs $50k-75k, 142.1% for AGIs $75k-100k, 373.9% for AGIs $100k-200k, 1632.7% for AGIs over 200k)
Earned income credit: $2,244 (reported on 12.4% of returns)
Here:
$2,244
State:
$2,530
(% of AGI for various income ranges: 86.6% for AGIs below $25k, 73.4% for AGIs $25k-50k, 1.9% for AGIs $50k-75k)
Percentage of individuals using paid preparers for their 2020 taxes: 94.6%
Here:
95%
State:
93%
(% for various income ranges: 94.3% for AGIs below $25k, 93.3% for AGIs $25k-50k, 95.2% for AGIs $50k-75k, 94.9% for AGIs $75k-100k, 95.3% for AGIs $100k-200k, 94.7% for AGIs over 200k)
Averages for the 2012 tax year for zip code 31047, filed in 2013:
Average Adjusted Gross Income (AGI) in 2012: $68,140 (Individual Income Tax Returns)
Here:
$68,140
State:
$56,131
Salary/wage: $59,288 (reported on 88.4% of returns)
Here:
$59,288
State:
$47,942
(% of AGI for various income ranges: 82.6% for AGIs below $25k, 83.8% for AGIs $25k-50k, 82.5% for AGIs $50k-75k, 82.7% for AGIs $75k-100k, 79.9% for AGIs $100k-200k, 52.5% for AGIs over 200k)
Taxable interest for individuals: $698 (reported on 38.4% of returns)
This zip code:
$698
Georgia:
$1,706
(% of AGI for various income ranges: 1.3% for AGIs below $25k, 0.5% for AGIs $25k-50k, 0.3% for AGIs $50k-75k, 0.2% for AGIs $75k-100k, 0.3% for AGIs $100k-200k, 0.5% for AGIs over 200k)
Ordinary dividends: $2,807 (reported on 17.5% of returns)
Here:
$2,807
State:
$7,265
(% of AGI for various income ranges: 1.0% for AGIs below $25k, 0.3% for AGIs $25k-50k, 0.6% for AGIs $50k-75k, 0.2% for AGIs $75k-100k, 0.7% for AGIs $100k-200k, 1.5% for AGIs over 200k)
Net capital gain/loss in AGI: +$4,928 (reported on 12.4% of returns)
Here:
+$4,928
State:
+$16,323
(% of AGI for various income ranges: 0.3% for AGIs $50k-75k, 0.2% for AGIs $75k-100k, 0.2% for AGIs $100k-200k, 4.7% for AGIs over 200k)
Profit/loss from business: +$11,120 (reported on 15.1% of returns)
Here:
+$11,120
State:
+$7,583
(% of AGI for various income ranges: 3.4% for AGIs below $25k, 0.3% for AGIs $25k-50k, 0.5% for AGIs $50k-75k, 0.7% for AGIs $75k-100k, 1.3% for AGIs $100k-200k, 9.8% for AGIs over 200k)
Taxable individual retirement arrangement distribution: $11,161 (reported on 6.5% of returns)
31047:
$11,161
Georgia:
$17,199
(% of AGI for various income ranges: 1.4% for AGIs below $25k, 1.0% for AGIs $25k-50k, 1.0% for AGIs $50k-75k, 1.0% for AGIs $75k-100k, 1.6% for AGIs $100k-200k)
Self-employment retirement plans: $29,500 (reported on 0.4% of returns)
31047:
$29,500
Georgia:
$23,277
(% of AGI for various income ranges: 1.5% for AGIs $25k-50k)
Total itemized deductions: $22,294 (21% of AGI, reported on 49.3% of returns)
Here:
$22,294
State:
$23,886
Here:
21.2% of AGI
State:
21.5% of AGI
(% of AGI for various income ranges: 10.9% for AGIs below $25k, 15.6% for AGIs $25k-50k, 16.7% for AGIs $50k-75k, 17.7% for AGIs $75k-100k, 17.2% for AGIs $100k-200k, 13.4% for AGIs over 200k)
Charity contributions: $5,158 (reported on 43.3% of returns)
Here:
$5,158
State:
$5,507
(% of AGI for various income ranges: 1.3% for AGIs below $25k, 2.5% for AGIs $25k-50k, 3.0% for AGIs $50k-75k, 3.1% for AGIs $75k-100k, 3.7% for AGIs $100k-200k, 3.7% for AGIs over 200k)
Taxes paid: $7,509 (reported on 49.1% of returns)
31047:
$7,509
State:
$7,838
(% of AGI for various income ranges: 2.3% for AGIs below $25k, 3.2% for AGIs $25k-50k, 4.5% for AGIs $50k-75k, 5.5% for AGIs $75k-100k, 6.4% for AGIs $100k-200k, 6.4% for AGIs over 200k)
Earned income credit: $2,259 (reported on 13.5% of returns)
Here:
$2,259
State:
$2,589
(% of AGI for various income ranges: 6.6% for AGIs below $25k, 1.2% for AGIs $25k-50k)
Percentage of individuals using paid preparers for their 2012 taxes: 41.3%
Here:
41%
State:
55%
(% for various income ranges: 37.7% for AGIs below $25k, 41.1% for AGIs $25k-50k, 39.8% for AGIs $50k-75k, 40.3% for AGIs $75k-100k, 43.7% for AGIs $100k-200k, 75.0% for AGIs over 200k)
Averages for the 2004 tax year for zip code 31047, filed in 2005:
Average Adjusted Gross Income (AGI) in 2004: $60,787 (Individual Income Tax Returns)
Here:
$60,787
State:
$47,553
Salary/wage: $54,571 (reported on 88.6% of returns)
Here:
$54,571
State:
$42,178
(% of AGI for various income ranges: 99.2% for AGIs below $10k, 77.9% for AGIs $10k-25k, 80.0% for AGIs $25k-50k, 85.1% for AGIs $50k-75k, 88.7% for AGIs $75k-100k, 73.3% for AGIs over 100k)
Taxable interest for individuals: $1,163 (reported on 51.8% of returns)
This zip code:
$1,163
Georgia:
$1,772
(% of AGI for various income ranges: 1.9% for AGIs below $10k, 1.4% for AGIs $10k-25k, 1.0% for AGIs $25k-50k, 0.9% for AGIs $50k-75k, 0.4% for AGIs $75k-100k, 1.2% for AGIs over 100k)
Taxable dividends: $1,207 (reported on 25.4% of returns)
Here:
$1,207
State:
$4,283
(% of AGI for various income ranges: 1.6% for AGIs below $10k, 0.6% for AGIs $10k-25k, 0.4% for AGIs $25k-50k, 0.4% for AGIs $50k-75k, 0.3% for AGIs $75k-100k, 0.6% for AGIs over 100k)
Net capital gain/loss: +$7,646 (reported on 19.1% of returns)
Here:
+$7,646
State:
+$16,461
(% of AGI for various income ranges: -2.9% for AGIs below $10k, -0.2% for AGIs $10k-25k, 0.1% for AGIs $25k-50k, 0.4% for AGIs $50k-75k, 0.1% for AGIs $75k-100k, 5.0% for AGIs over 100k)
Profit/loss from business: +$9,495 (reported on 14.4% of returns)
Here:
+$9,495
State:
+$8,201
(% of AGI for various income ranges: 3.7% for AGIs below $10k, 2.1% for AGIs $10k-25k, 3.0% for AGIs $25k-50k, 0.7% for AGIs $50k-75k, 1.2% for AGIs $75k-100k, 3.1% for AGIs over 100k)
IRA payment deduction: $3,011 (reported on 2.7% of returns)
31047:
$3,011
Georgia:
$2,969
(% of AGI for various income ranges: 0.6% for AGIs below $10k, 0.2% for AGIs $25k-50k, 0.1% for AGIs $50k-75k, 0.1% for AGIs $75k-100k, 0.1% for AGIs over 100k)
Self-employed pension: $15,467 (reported on 0.4% of returns)
Here:
$15,467
Georgia:
$16,203
Total itemized deductions: $19,647 (21% of AGI, reported on 52.0% of returns)
Here:
$19,647
State:
$19,944
Here:
21.0% of AGI
State:
22.6% of AGI
(% of AGI for various income ranges: 7.3% for AGIs below $10k, 12.1% for AGIs $10k-25k, 17.5% for AGIs $25k-50k, 18.3% for AGIs $50k-75k, 19.0% for AGIs $75k-100k, 15.9% for AGIs over 100k)
Charity contributions deductions: $4,155 (4% of AGI, reported on 48.2% of returns)
Here:
$4,155
State:
$4,354
Here:
4.3% of AGI
State:
4.7% of AGI
(% of AGI for various income ranges: 0.6% for AGIs below $10k, 1.8% for AGIs $10k-25k, 2.9% for AGIs $25k-50k, 3.4% for AGIs $50k-75k, 3.3% for AGIs $75k-100k, 3.6% for AGIs over 100k)
Total tax: $8,848 (reported on 78.8% of returns)
31047:
$8,848
State:
$8,223
(% of AGI for various income ranges: 2.5% for AGIs below $10k, 3.6% for AGIs $10k-25k, 5.9% for AGIs $25k-50k, 7.5% for AGIs $50k-75k, 8.9% for AGIs $75k-100k, 16.4% for AGIs over 100k)
Earned income credit: $1,839 (reported on 10.3% of returns)
Here:
$1,839
State:
$1,986
Percentage of individuals using paid preparers for their 2004 taxes: 53.0%
Here:
53%
State:
62%
(% for various income ranges: 42.6% for AGIs below $10k, 54.1% for AGIs $10k-25k, 61.7% for AGIs $25k-50k, 54.9% for AGIs $50k-75k, 47.2% for AGIs $75k-100k, 54.8% for AGIs over 100k)
Household received Food Stamps/SNAP in the past 12 months: 142 Household did not receive Food Stamps/SNAP in the past 12 months: 6,214
Women who had a birth in the past 12 months: 403 (396 now married, 7 unmarried) Women who did not have a birth in the past 12 months: 3,862 (2,159 now married, 1,697 unmarried)
Housing units in zip code 31047 with a mortgage: 4,462 (251 second mortgage, 47 home equity loan, 205 both second mortgage and home equity loan) Houses without a mortgage: 12
Median monthly owner costs for units with a mortgage: $1,693 Median monthly owner costs for units without a mortgage: $639
Residents with income below the poverty level in 2022:
This zip code:
5.6%
Whole state:
12.7%
Residents with income below 50% of the poverty level in 2022:
This zip code:
3.4%
Whole state:
6.3%
Median number of rooms in houses and condos:
Here:
7.6
State:
6.8
Median number of rooms in apartments:
Here:
5.7
State:
4.6
Notable locations in this zip code not listed on our city pages
Churches in zip code 31047 include: Andrew Chapel (A), Sand Bed Baptist Church (B), Piney Grove Church (C), Browns Chapel (D), Beaver Creek Primitive Baptist Church (E), Kathleen Church (F), Spring Chapel (G). Display/hide their locations on the map
Lakes and reservoirs: Sylvan Lake (A), Houston Lake (B), Kersey Lake (C), Mossy Lake (D), Sylvan Lake (E), Rush Lake (F), Griffin Lake (G), Smith Lake (H). Display/hide their locations on the map
Streams, rivers, and creeks: Big Indian Creek (A), Redding Branch (B), Donelson Branch (C), Big Grocery Creek (D), Bear Branch (E), Mossy Creek (F), Little Grocery Creek (G). Display/hide their locations on the map
In group quarters: 1 (-1 institutionalized population)
Size of family households: 1,962 2-persons, 1,562 3-persons, 987 4-persons, 854 5-persons, 43 6-persons, 35 7-or-more-persons
Size of nonfamily households: 877 1-person, 73 2-persons, 19 3-persons
3,880 married couples with children.
597 single-parent households (156 men, 441 women).
90.8% of residents of 31047 zip code speak English at home.
4.8% of residents speak Spanish at home (58% very well, 42% well).
0.6% of residents speak other Indo-European language at home (60% very well, 40% well).
2.6% of residents speak Asian or Pacific Island language at home (27% very well, 41% well, 32% not well).
0.2% of residents speak other language at home (100% very well).
Foreign born population: 1,377 (7.4%) (68.7% of them are naturalized citizens)
This zip code:
7.4%
Whole state:
10.7%
31%Haiti
24%Japan
7%Honduras
7%Malaysia
5%Chile
3%Thailand
3%Ethiopia
15%American
12%English
7%German
5%Jamaican
4%Irish
2%European
2%Italian
Year of entry for the foreign-born population
4782010 or later
4272000 to 2009
4121990 to 1999
561Before 1990
Public high school in in zip code 31047 not listed on the city page:
VETERANS HIGH SCHOOL (Location: 340 PINEY GROVE RD, Grades: 9-12)
Public elementary/middle schools in in zip code 31047 not listed on the city page:
AIR MAJOR (AIRS/AFS) AIR PROGRAM (Clean Air Markets Division Business System) National Pollutant Discharge Elimination System NON-MAJOR (Tracking pollutant discharge elimination systems) - permit AIR MAJOR ("Best Available" air pollution technologies tracking) Conditionally Exempt Small Quantity Generators, less than 100 kg/month of hazardous waste (Resource Conservation and Recovery Act (tracking hazardous waste)) - notification TRI REPORTER (Tracking of toxic chemicals releasing facilities) Business SIC classification: ELECTRIC SERVICES; ELECTRIC AND OTHER SERVICES COMBINED Organizations: MID-GA COGEN LP, C/P GPU INTERNATIONAL (CONTACT/OWNER)
, MID-GEORGIA COGENERATION, LP (OWNER/OPERATOR)
Alternative names: MID-GEORGIA COGEN, MID-GEORGIA COGEN L.P., MID-GA COGEN LP, MID-GEORGIA COGENERATION, MID-GEORGIA COGEN.
MATTHEW ARTHUR ELEMENTARY SCHOOL (2500 HIGHWAY 127 in KATHLEEN, GA)
(National Center for Education Statistics) - STATE ID-0199 Organizations: HOUSTON COUNTY (SCHOOL DISTRICT)
BUDDY BREWER (1044 HWY. 247 in KATHLEEN, GA)
COMPLIANCE ACTIVITY (Tracking inspections of insecticide, fungicide, and rodenticide, and toxic substances)
CHARLES BREWER (1044 HIGHWAY 247 OR 118 TOOMBS ST in KATHLEEN, GA)
COMPLIANCE ACTIVITY (Tracking inspections of insecticide, fungicide, and rodenticide, and toxic substances)
Housing units lacking complete plumbing facilities: 2.1% Housing units lacking complete kitchen facilities: 2.1%
95.0%Electricity
3.6%Utility gas
1.3%Bottled, tank, or LP gas
Population in 1990: 563. Population change in the 1990s: +5,096 (+905.2%).
Place of birth for U.S.-born residents:
This state: 7,747
Northeast: 1,642
Midwest: 1,442
South: 5,250
West: 716
52% of the 31047 zip code residents lived in the same house 5 years ago. Out of people who lived in different houses, 57% lived in this county. Out of people who lived in different counties, 50% lived in Georgia.
86% of the 31047 zip code residents lived in the same house 1 year ago. Out of people who lived in different houses, 48% moved from this county. Out of people who lived in different houses, 15% moved from different county within same state. Out of people who lived in different houses, 28% moved from different state. Out of people who lived in different houses, 7% moved from abroad.
Private vs. public school enrollment:
Students in private schools in grades 1 to 8 (elementary and middle school): 186
Here:
8.3%
Georgia:
12.1%
Students in private schools in grades 9 to 12 (high school): 19
Here:
1.4%
Georgia:
10.8%
Students in private undergraduate colleges: 292
Here:
26.0%
Georgia:
17.1%
Occupation by median earnings in the past 12 months ($)
98,985Management occupations
98,493Legal occupations
91,118Architecture and engineering occupations
90,598Transportation occupations
79,464Fire fighting and prevention, and other protective service workers including supervisors
78,705Construction and extraction occupations
Companies with federal contracts located in this zip code (KATHLEEN, GA):
ADVANCED CORE CONSULTING INC (102 FIELDFARE DR; small business) : $1,657,703 in 13 contractsfrom 2004 to 2006
Contracts for Technical Representation Services -- Electrical and Electronic Equipment Components by Air Force Signed by year:2000: $0; 2001: $0; 2002: $0; 2003: $0; 2004: $111,957; 2005: $466,572; 2006: $1,079,174.
Biggest contracts:
$501,187 with Air Force for Technical Representation Services -- Electrical and Electronic Equipment Components. Signed on 2006-04-14. Completion date: 2007-02-28.
$368,072, same as above.Signed on 2006-04-14. Completion date: 2007-02-28.
$252,000, same as above.Signed on 2005-07-20. Completion date: 2006-01-31.
$111,957, same as above.Signed on 2004-07-30. Completion date: 2005-07-29.
VALLEY ELECTRONICS INC (2852 PERDUE RD; small business) : $520,380 in 35 contractsfrom 2000 to 2006
Contracts for Engine Fuel System Components, Aircraft and Missile Prime Movers, Gas Turbines and Jet Engines, Aircraft; Prime Moving, and Components, Airframe Structural Components, Engine Electrical System Components, Aircraft Prime Moving, and moreby Defense Logistics Agency, Air Force, Army Signed by year:2000: $98,700; 2001: $0; 2002: $41,250; 2003: $46,000; 2004: $46,200; 2005: $221,830; 2006: $66,400.
Biggest contracts:
$98,700 with Defense Logistics Agency for Engine Fuel System Components, Aircraft and Missile Prime Movers. Signed on 2000-08-11. Completion date: 2000-09-10.
$46,000 with Air Force for Engine Fuel System Components, Aircraft and Missile Prime Movers. Signed on 2003-08-12. Completion date: 2003-08-26.
$41,250 with Defense Logistics Agency for Gas Turbines and Jet Engines, Aircraft; Prime Moving, and Components. Signed on 2002-08-05. Completion date: 2002-09-04.
$32,000 with Defense Logistics Agency for Engine Fuel System Components, Aircraft and Missile Prime Movers. Signed on 2004-03-01. Completion date: 2004-03-31.
MDS LIGHTING, INC (821 HIGHWAY 247 S; small business) : $207,112 in 6 contractsfrom 1999 to 2006
Contracts for Musical Instrument Parts and Accessories, Miscellaneous Items, Electrical Hardware and Supplies, Audio/Visual Services, and moreby Air Force Signed by year:2000: $0; 2001: $0; 2002: $27,849; 2003: $27,849; 2004: $35,998; 2005: $31,988; 2006: $32,477.
Biggest contracts:
$50,951 with Air Force for Musical Instrument Parts and Accessories. Signed on 1999-12-09. Completion date: 2000-02-02.
$35,998 with Air Force for Miscellaneous Items. Signed on 2004-05-20. Completion date: 2004-07-01.
$32,477 with Air Force for Electrical Hardware and Supplies. Signed on 2006-06-09. Completion date: 2006-06-30.
$31,988 with Air Force for Audio/Visual Services. Signed on 2005-05-24. Completion date: 2005-07-01.
SPEECH AND LANGUAGE ASSOCIATES (105 TAMIE COURT; small business)
$57,850 with Air Force for Other Medical Services. Signed on 2004-10-05. Completion date: 2005-09-30.
TECHNOLOGY, DESIGN, & INTEGRAT (104 HEARD RD; small business) : $37,606 in 3 contractsin 2002
$29,156 with Defense Logistics Agency for Parachutes; Aerial Pick Up, Delivery, Recovery Systems; and Cargo Tie Down Equipment. Taking place in FL. Signed on 2002-08-20. Completion date: 2002-11-18.
$4,250 with Army for Trucks and Truck Tractors, Wheeled. Taking place in TX. Signed on 2002-02-26. Completion date: 2002-04-05.
$4,200 with Air Force for Engine Fuel System Components, Nonaircraft. Taking place in FL. Signed on 2002-08-06. Completion date: 2002-09-23.
AVERY SPORTS PHOTOS (101 AUDREY WY; small business) : $32,356 in 2 contractsfrom 2004 to 2005
$16,178 with Air Force for General Photographic Services - Motion. Signed on 2005-12-14. Completion date: 2007-01-15.
$16,178 with Air Force for Maintenance, Repair and Rebuilding of Equipment -- Miscellaneous. Signed on 2004-12-10. Completion date: 2006-01-15.
Top industries in this zip code by the number of employees in 2005:
Construction: Poured Concrete Foundation and Structure Contractors (20-49 employees: 1 establishment)
Other Services (except Public Administration): Religious Organizations (5-9: 3, 1-4: 3)
Health Care and Social Assistance: All Other Outpatient Care Centers (10-19: 1)
Utilities: Fossil Fuel Electric Power Generation (10-19: 1)
Other Services (except Public Administration): General Automotive Repair (10-19: 1)
Construction: New Single-Family Housing Construction (except Operative Builders) (1-4: 7)
Management of Companies and Enterprises: Corporate, Subsidiary, and Regional Managing Offices (5-9: 1, 1-4: 1)
Fatal accident statistics in 2014:
Fatal accident count: 1
Vehicles involved in fatal accidents: 2
Fatal accidents caused by drunken drivers: 0
Fatalities: 1
Persons involved in fatal accidents: 2
Pedestrians involved in fatal accidents: 0
Fatal accident statistics in 2012:
Fatal accident count: 3
Vehicles involved in fatal accidents: 5
Fatal accidents caused by drunken drivers: 0
Fatalities: 3
Persons involved in fatal accidents: 5
Pedestrians involved in fatal accidents: 0
Home Mortgage Disclosure Act Aggregated Statistics For Year 2009 (Based on 10 partial tracts)
A) FHA, FSA/RHS & VA Home Purchase Loans
B) Conventional Home Purchase Loans
C) Refinancings
D) Home Improvement Loans
F) Non-occupant Loans on < 5 Family Dwellings (A B C & D)
G) Loans On Manufactured Home Dwelling (A B C & D)
Number
Average Value
Number
Average Value
Number
Average Value
Number
Average Value
Number
Average Value
Number
Average Value
LOANS ORIGINATED
268
$161,328
129
$150,622
621
$171,017
29
$47,434
73
$135,028
21
$60,506
APPLICATIONS APPROVED, NOT ACCEPTED
9
$130,332
4
$86,030
40
$180,825
4
$24,512
3
$101,793
4
$54,920
APPLICATIONS DENIED
26
$151,781
17
$151,272
184
$162,887
23
$44,917
10
$115,638
15
$75,805
APPLICATIONS WITHDRAWN
24
$150,032
14
$152,234
139
$176,680
4
$85,298
6
$140,913
4
$84,058
FILES CLOSED FOR INCOMPLETENESS
6
$161,662
4
$123,388
29
$164,916
1
$47,780
2
$61,880
0
$0
Aggregated Statistics For Year 2008 (Based on 10 partial tracts)
A) FHA, FSA/RHS & VA Home Purchase Loans
B) Conventional Home Purchase Loans
C) Refinancings
D) Home Improvement Loans
E) Loans on Dwellings For 5+ Families
F) Non-occupant Loans on < 5 Family Dwellings (A B C & D)
G) Loans On Manufactured Home Dwelling (A B C & D)
Number
Average Value
Number
Average Value
Number
Average Value
Number
Average Value
Number
Average Value
Number
Average Value
Number
Average Value
LOANS ORIGINATED
219
$163,269
259
$156,694
420
$148,495
41
$48,488
1
$1,769,430
134
$125,905
26
$51,860
APPLICATIONS APPROVED, NOT ACCEPTED
7
$150,727
16
$165,276
44
$154,999
9
$43,150
0
$0
4
$115,430
5
$66,106
APPLICATIONS DENIED
22
$126,498
31
$130,883
201
$169,862
45
$84,806
0
$0
11
$123,952
15
$54,353
APPLICATIONS WITHDRAWN
24
$151,271
29
$171,345
118
$171,654
9
$121,887
0
$0
7
$163,116
4
$78,505
FILES CLOSED FOR INCOMPLETENESS
6
$144,482
4
$167,772
17
$193,284
3
$37,353
0
$0
0
$0
0
$0
Aggregated Statistics For Year 2007 (Based on 10 partial tracts)
A) FHA, FSA/RHS & VA Home Purchase Loans
B) Conventional Home Purchase Loans
C) Refinancings
D) Home Improvement Loans
F) Non-occupant Loans on < 5 Family Dwellings (A B C & D)
G) Loans On Manufactured Home Dwelling (A B C & D)
Number
Average Value
Number
Average Value
Number
Average Value
Number
Average Value
Number
Average Value
Number
Average Value
LOANS ORIGINATED
201
$168,625
487
$135,728
418
$133,835
72
$43,743
125
$102,583
41
$55,338
APPLICATIONS APPROVED, NOT ACCEPTED
6
$175,708
39
$134,303
68
$138,641
11
$80,734
5
$81,150
4
$75,088
APPLICATIONS DENIED
23
$147,584
66
$139,232
283
$140,401
66
$52,570
14
$120,383
27
$69,960
APPLICATIONS WITHDRAWN
15
$144,398
56
$142,528
133
$154,391
14
$68,406
8
$134,609
5
$57,588
FILES CLOSED FOR INCOMPLETENESS
1
$134,590
13
$148,115
39
$188,257
3
$70,420
1
$177,860
1
$7,240
Aggregated Statistics For Year 2006 (Based on 10 partial tracts)
A) FHA, FSA/RHS & VA Home Purchase Loans
B) Conventional Home Purchase Loans
C) Refinancings
D) Home Improvement Loans
E) Loans on Dwellings For 5+ Families
F) Non-occupant Loans on < 5 Family Dwellings (A B C & D)
G) Loans On Manufactured Home Dwelling (A B C & D)
Number
Average Value
Number
Average Value
Number
Average Value
Number
Average Value
Number
Average Value
Number
Average Value
Number
Average Value
LOANS ORIGINATED
219
$165,786
573
$123,264
430
$131,061
41
$39,120
2
$1,332,930
98
$96,453
32
$60,937
APPLICATIONS APPROVED, NOT ACCEPTED
5
$139,020
52
$126,131
61
$120,034
8
$44,464
0
$0
7
$107,810
4
$71,780
APPLICATIONS DENIED
13
$145,547
92
$127,539
283
$118,680
51
$47,278
0
$0
21
$105,481
26
$70,598
APPLICATIONS WITHDRAWN
15
$158,993
52
$133,907
181
$124,781
12
$86,558
0
$0
11
$89,329
5
$67,050
FILES CLOSED FOR INCOMPLETENESS
3
$179,927
19
$116,823
54
$141,277
1
$97,060
0
$0
3
$102,277
1
$108,620
Aggregated Statistics For Year 2005 (Based on 10 partial tracts)
A) FHA, FSA/RHS & VA Home Purchase Loans
B) Conventional Home Purchase Loans
C) Refinancings
D) Home Improvement Loans
E) Loans on Dwellings For 5+ Families
F) Non-occupant Loans on < 5 Family Dwellings (A B C & D)
G) Loans On Manufactured Home Dwelling (A B C & D)
Number
Average Value
Number
Average Value
Number
Average Value
Number
Average Value
Number
Average Value
Number
Average Value
Number
Average Value
LOANS ORIGINATED
216
$151,019
644
$113,102
442
$121,058
55
$49,371
2
$1,000,100
122
$81,602
38
$61,162
APPLICATIONS APPROVED, NOT ACCEPTED
5
$141,958
52
$106,135
69
$111,853
9
$51,340
0
$0
5
$102,992
9
$52,708
APPLICATIONS DENIED
10
$128,600
77
$111,343
245
$115,234
62
$41,211
0
$0
11
$86,425
33
$63,238
APPLICATIONS WITHDRAWN
14
$180,284
61
$116,556
183
$121,277
24
$102,382
0
$0
12
$112,845
14
$79,990
FILES CLOSED FOR INCOMPLETENESS
3
$89,893
15
$116,591
55
$130,405
5
$38,026
0
$0
3
$118,147
0
$0
Aggregated Statistics For Year 2004 (Based on 10 partial tracts)
A) FHA, FSA/RHS & VA Home Purchase Loans
B) Conventional Home Purchase Loans
C) Refinancings
D) Home Improvement Loans
E) Loans on Dwellings For 5+ Families
F) Non-occupant Loans on < 5 Family Dwellings (A B C & D)
G) Loans On Manufactured Home Dwelling (A B C & D)
Number
Average Value
Number
Average Value
Number
Average Value
Number
Average Value
Number
Average Value
Number
Average Value
Number
Average Value
LOANS ORIGINATED
187
$135,494
480
$119,041
487
$120,007
35
$43,437
3
$746,137
94
$80,976
23
$56,658
APPLICATIONS APPROVED, NOT ACCEPTED
7
$116,399
35
$116,656
76
$111,290
9
$31,718
0
$0
3
$66,060
9
$69,929
APPLICATIONS DENIED
8
$96,156
72
$102,891
226
$112,993
52
$38,470
0
$0
15
$72,897
30
$63,739
APPLICATIONS WITHDRAWN
11
$122,565
43
$112,900
173
$119,708
14
$62,036
0
$0
5
$74,956
8
$74,992
FILES CLOSED FOR INCOMPLETENESS
1
$90,380
11
$110,845
47
$142,234
3
$39,453
0
$0
2
$76,535
3
$59,560
Aggregated Statistics For Year 2003 (Based on 10 partial tracts)
A) FHA, FSA/RHS & VA Home Purchase Loans
B) Conventional Home Purchase Loans
C) Refinancings
D) Home Improvement Loans
E) Loans on Dwellings For 5+ Families
F) Non-occupant Loans on < 5 Family Dwellings (A B C & D)
Number
Average Value
Number
Average Value
Number
Average Value
Number
Average Value
Number
Average Value
Number
Average Value
LOANS ORIGINATED
246
$128,107
388
$116,180
1,056
$119,853
30
$33,613
1
$2,861,820
82
$74,605
APPLICATIONS APPROVED, NOT ACCEPTED
3
$138,143
23
$109,040
70
$102,176
4
$31,642
0
$0
2
$88,745
APPLICATIONS DENIED
12
$113,940
43
$93,575
189
$101,268
26
$23,792
0
$0
12
$80,601
APPLICATIONS WITHDRAWN
16
$136,904
30
$142,153
145
$117,330
1
$129,400
0
$0
12
$70,256
FILES CLOSED FOR INCOMPLETENESS
1
$139,400
11
$127,057
39
$117,626
3
$27,640
0
$0
2
$51,315
Aggregated Statistics For Year 2002 (Based on 6 partial tracts)
A) FHA, FSA/RHS & VA Home Purchase Loans
B) Conventional Home Purchase Loans
C) Refinancings
D) Home Improvement Loans
F) Non-occupant Loans on < 5 Family Dwellings (A B C & D)
Number
Average Value
Number
Average Value
Number
Average Value
Number
Average Value
Number
Average Value
LOANS ORIGINATED
91
$118,340
205
$626,841
364
$198,918
27
$720,699
52
$865,180
APPLICATIONS APPROVED, NOT ACCEPTED
3
$123,493
12
$80,787
44
$86,479
2
$10,510
3
$81,650
APPLICATIONS DENIED
5
$95,598
35
$70,683
105
$69,665
11
$16,059
10
$63,551
APPLICATIONS WITHDRAWN
10
$90,760
8
$83,035
74
$112,821
1
$28,940
6
$87,240
FILES CLOSED FOR INCOMPLETENESS
2
$81,380
4
$350,722
17
$130,948
0
$0
1
$51,380
Aggregated Statistics For Year 2001 (Based on 6 partial tracts)
A) FHA, FSA/RHS & VA Home Purchase Loans
B) Conventional Home Purchase Loans
C) Refinancings
D) Home Improvement Loans
E) Loans on Dwellings For 5+ Families
F) Non-occupant Loans on < 5 Family Dwellings (A B C & D)
Number
Average Value
Number
Average Value
Number
Average Value
Number
Average Value
Number
Average Value
Number
Average Value
LOANS ORIGINATED
88
$113,971
162
$115,886
285
$112,335
25
$21,456
1
$8,855,420
30
$67,891
APPLICATIONS APPROVED, NOT ACCEPTED
0
$0
27
$57,163
24
$104,325
9
$22,327
0
$0
2
$84,130
APPLICATIONS DENIED
3
$102,367
64
$63,704
91
$86,710
10
$24,372
0
$0
3
$93,050
APPLICATIONS WITHDRAWN
6
$132,807
20
$88,488
60
$93,063
5
$29,636
0
$0
3
$55,883
FILES CLOSED FOR INCOMPLETENESS
1
$57,890
2
$130,940
13
$125,888
1
$14,470
0
$0
0
$0
Aggregated Statistics For Year 2000 (Based on 6 partial tracts)
A) FHA, FSA/RHS & VA Home Purchase Loans
B) Conventional Home Purchase Loans
C) Refinancings
D) Home Improvement Loans
F) Non-occupant Loans on < 5 Family Dwellings (A B C & D)
Number
Average Value
Number
Average Value
Number
Average Value
Number
Average Value
Number
Average Value
LOANS ORIGINATED
81
$113,606
154
$107,116
122
$94,151
27
$22,970
27
$52,832
APPLICATIONS APPROVED, NOT ACCEPTED
4
$46,152
28
$62,215
22
$75,279
6
$16,398
0
$0
APPLICATIONS DENIED
5
$63,218
123
$51,792
73
$59,430
15
$26,989
6
$41,977
APPLICATIONS WITHDRAWN
6
$84,130
13
$95,657
39
$66,458
5
$17,298
0
$0
FILES CLOSED FOR INCOMPLETENESS
1
$129,520
1
$153,030
2
$68,675
1
$3,620
0
$0
Aggregated Statistics For Year 1999 (Based on 5 partial tracts)
A) FHA, FSA/RHS & VA Home Purchase Loans
B) Conventional Home Purchase Loans
C) Refinancings
D) Home Improvement Loans
F) Non-occupant Loans on < 5 Family Dwellings (A B C & D)
2003 - 2018 National Fire Incident Reporting System (NFIRS) incidents
Based on the data from the years 2003 - 2018 the average number of fires per year is 18. The highest number of fire incidents - 36 took place in 2016, and the least - 2 in 2011. The data has a growing trend.
When looking into fire subcategories, the most incidents belonged to: Outside Fires (48.8%), and Structure Fires (37.6%).
Fire incident types reported to NFIRS in Zip Code 31047


 Nearest zip codes: 31005, 31088, 31098, 31069, 31028, 31093.


 (Location: 340 PINEY GROVE RD, Grades: 9-12)


 Based on the data from the years 2003 - 2018 the average number of fires per year is 18. The highest number of fire incidents - 36 took place in 2016, and the least - 2 in 2011. The data has a growing trend.
 When looking into fire subcategories, the most incidents belonged to: Outside Fires (48.8%), and Structure Fires (37.6%).