Estimated zip code population in 2022: 9,461 Zip code population in 2010: 8,807 Zip code population in 2000: 8,627
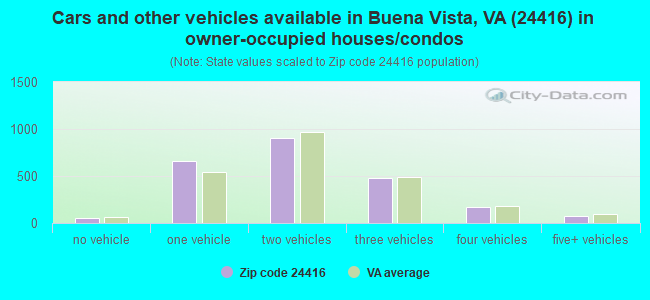
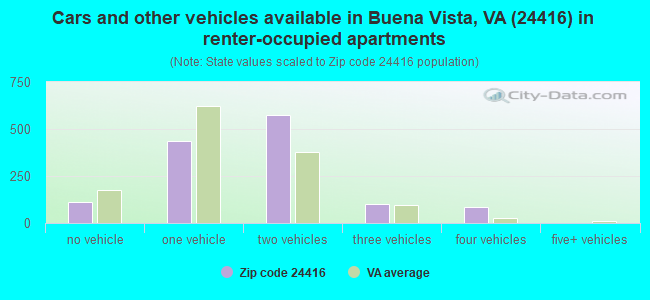
Houses and condos: 4,041 Renter-occupied apartments: 1,336
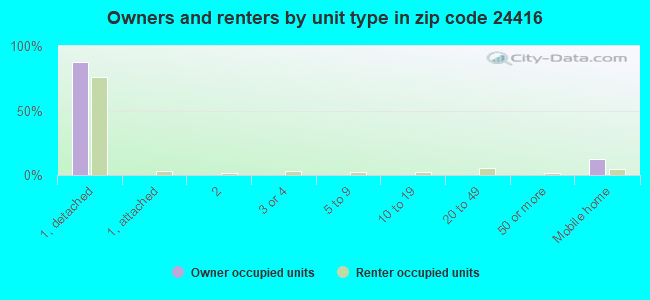
% of renters here:
36%
State:
33%
March 2022 cost of living index in zip code 24416: 79.2 (low, U.S. average is 100)
Land area: 55.6 sq. mi. Water area: 0.3 sq. mi.
Population density: 170 people per square mile
(very low).
OSM Map
General Map
Google Map
MSN Map
OSM Map
General Map
Google Map
MSN Map
OSM Map
General Map
Google Map
MSN Map
OSM Map
General Map
Google Map
MSN Map
Please wait while loading the map...
Real estate property taxes paid for housing units in 2022:
This zip code:
0.9% ($1,396)
Virginia:
0.7% ($2,617)
Median real estate property taxes paid for housing units with mortgages in 2022: $1,405 (0.8%) Median real estate property taxes paid for housing units with no mortgage in 2022: $1,414 (1.0%)
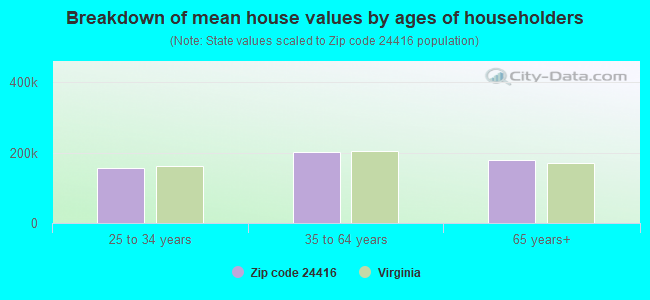
Estimated median house/condo value in 2022: $164,231
24416:
$164,231
Virginia:
$365,700
According to our research of Virginia and other state lists, there were 26 registered sex offenders living in 24416 zip code as of May 28, 2024. The ratio of all residents to sex offenders in zip code 24416 is 330 to 1. The ratio of registered sex offenders to all residents in this zip code is near the state average.
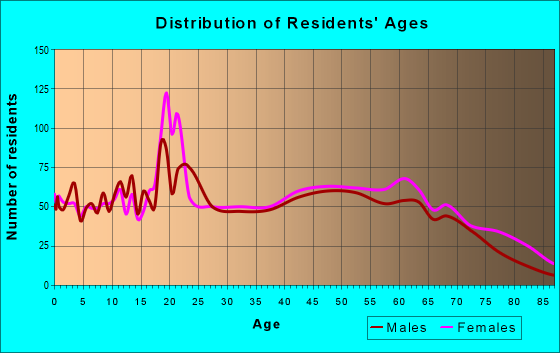
Median resident age:
This zip code:
36.8 years
Virginia median age:
39.0 years
Average household size:
This zip code:
2.4 people
Virginia:
2.5 people
Averages for the 2020 tax year for zip code 24416, filed in 2021:
Average Adjusted Gross Income (AGI) in 2020: $42,788 (Individual Income Tax Returns)
Here:
$42,788
State:
$86,446
Salary/wage: $38,233 (reported on 85.2% of returns)
Here:
$38,233
State:
$71,185
(% of AGI for various income ranges: 1095.3% for AGIs below $25k, 3496.4% for AGIs $25k-50k, 6253.3% for AGIs $50k-75k, 9109.6% for AGIs $75k-100k, 13602.6% for AGIs $100k-200k)
Taxable interest for individuals: $681 (reported on 22.2% of returns)
This zip code:
$681
Virginia:
$1,805
(% of AGI for various income ranges: 9.6% for AGIs below $25k, 11.6% for AGIs $25k-50k, 22.1% for AGIs $50k-75k, 22.2% for AGIs $75k-100k, 107.4% for AGIs $100k-200k)
Ordinary dividends: $3,316 (reported on 10.0% of returns)
Here:
$3,316
State:
$8,327
(% of AGI for various income ranges: 4.1% for AGIs below $25k, 17.4% for AGIs $25k-50k, 71.0% for AGIs $50k-75k, 98.7% for AGIs $75k-100k, 282.1% for AGIs $100k-200k)
Net capital gain/loss in AGI: +$8,203 (reported on 9.0% of returns)
Here:
+$8,203
State:
+$24,644
(% of AGI for various income ranges: 2.3% for AGIs below $25k, 11.5% for AGIs $25k-50k, 21.8% for AGIs $50k-75k, 187.4% for AGIs $75k-100k, 1122.6% for AGIs $100k-200k)
Profit/loss from business: +$7,683 (reported on 11.1% of returns)
Here:
+$7,683
State:
+$12,836
(% of AGI for various income ranges: 67.0% for AGIs below $25k, 64.1% for AGIs $25k-50k, 195.9% for AGIs $50k-75k, 60.0% for AGIs $75k-100k, 462.6% for AGIs $100k-200k)
Taxable individual retirement arrangement distribution: $12,027 (reported on 7.9% of returns)
24416:
$12,027
Virginia:
$21,535
(% of AGI for various income ranges: 50.2% for AGIs below $25k, 65.8% for AGIs $25k-50k, 166.4% for AGIs $50k-75k, 233.5% for AGIs $75k-100k, 614.2% for AGIs $100k-200k)
Total itemized deductions: $28,529 (reported on 3.7% of returns)
Here:
$28,529
State:
$33,287
(% of AGI for various income ranges: 36.7% for AGIs below $25k, 153.6% for AGIs $50k-75k, 317.0% for AGIs $75k-100k, 1165.8% for AGIs $100k-200k)
Charity contributions: $12,067 (reported on 3.2% of returns)
Here:
$12,067
State:
$10,381
(% of AGI for various income ranges: 18.9% for AGIs $25k-50k, 113.9% for AGIs $75k-100k, 527.9% for AGIs $100k-200k)
Taxes paid: $6,707 (reported on 3.7% of returns)
24416:
$6,707
State:
$8,284
(% of AGI for various income ranges: 6.2% for AGIs below $25k, 28.2% for AGIs $50k-75k, 72.6% for AGIs $75k-100k, 308.4% for AGIs $100k-200k)
Earned income credit: $2,165 (reported on 20.6% of returns)
Here:
$2,165
State:
$2,214
(% of AGI for various income ranges: 85.3% for AGIs below $25k, 66.0% for AGIs $25k-50k)
Percentage of individuals using paid preparers for their 2020 taxes: 87.9%
Here:
88%
State:
92%
(% for various income ranges: 88.7% for AGIs below $25k, 87.1% for AGIs $25k-50k, 88.0% for AGIs $50k-75k, 87.1% for AGIs $75k-100k, 85.7% for AGIs $100k-200k, 100.0% for AGIs over 200k)
Averages for the 2012 tax year for zip code 24416, filed in 2013:
Average Adjusted Gross Income (AGI) in 2012: $35,880 (Individual Income Tax Returns)
Here:
$35,880
State:
$71,192
Salary/wage: $32,122 (reported on 89.3% of returns)
Here:
$32,122
State:
$59,229
(% of AGI for various income ranges: 80.8% for AGIs below $25k, 84.1% for AGIs $25k-50k, 81.6% for AGIs $50k-75k, 82.8% for AGIs $75k-100k, 90.1% for AGIs $100k-200k)
Taxable interest for individuals: $887 (reported on 24.6% of returns)
This zip code:
$887
Virginia:
$1,600
(% of AGI for various income ranges: 0.8% for AGIs below $25k, 0.6% for AGIs $25k-50k, 0.7% for AGIs $50k-75k, 0.3% for AGIs $75k-100k, 0.8% for AGIs $100k-200k)
Ordinary dividends: $1,930 (reported on 10.1% of returns)
Here:
$1,930
State:
$6,959
(% of AGI for various income ranges: 0.6% for AGIs below $25k, 0.3% for AGIs $25k-50k, 0.4% for AGIs $50k-75k, 0.4% for AGIs $75k-100k, 1.5% for AGIs $100k-200k)
Net capital gain/loss in AGI: +$2,857 (reported on 6.3% of returns)
Here:
+$2,857
State:
+$16,672
(% of AGI for various income ranges: 0.2% for AGIs $25k-50k, 0.2% for AGIs $50k-75k, 3.5% for AGIs $100k-200k)
Profit/loss from business: +$7,582 (reported on 12.0% of returns)
Here:
+$7,582
State:
+$14,116
(% of AGI for various income ranges: 5.2% for AGIs below $25k, 2.9% for AGIs $25k-50k, 2.1% for AGIs $50k-75k, 2.0% for AGIs $75k-100k, 0.7% for AGIs $100k-200k)
Taxable individual retirement arrangement distribution: $9,837 (reported on 8.2% of returns)
24416:
$9,837
Virginia:
$16,667
(% of AGI for various income ranges: 2.8% for AGIs below $25k, 1.9% for AGIs $25k-50k, 2.4% for AGIs $50k-75k, 2.2% for AGIs $75k-100k, 3.0% for AGIs $100k-200k)
Total itemized deductions: $17,281 (25% of AGI, reported on 19.9% of returns)
Here:
$17,281
State:
$26,596
Here:
25.0% of AGI
State:
20.1% of AGI
(% of AGI for various income ranges: 4.5% for AGIs below $25k, 6.3% for AGIs $25k-50k, 11.0% for AGIs $50k-75k, 12.7% for AGIs $75k-100k, 16.2% for AGIs $100k-200k, 14.3% for AGIs over 200k)
Charity contributions: $4,119 (reported on 14.8% of returns)
Here:
$4,119
State:
$4,443
(% of AGI for various income ranges: 0.4% for AGIs below $25k, 1.0% for AGIs $25k-50k, 1.9% for AGIs $50k-75k, 2.4% for AGIs $75k-100k, 3.2% for AGIs $100k-200k, 3.9% for AGIs over 200k)
Taxes paid: $5,345 (reported on 19.4% of returns)
24416:
$5,345
State:
$9,951
(% of AGI for various income ranges: 0.8% for AGIs below $25k, 1.5% for AGIs $25k-50k, 3.0% for AGIs $50k-75k, 4.3% for AGIs $75k-100k, 5.5% for AGIs $100k-200k, 7.1% for AGIs over 200k)
Earned income credit: $2,183 (reported on 24.6% of returns)
Here:
$2,183
State:
$2,211
(% of AGI for various income ranges: 6.7% for AGIs below $25k, 1.4% for AGIs $25k-50k)
Percentage of individuals using paid preparers for their 2012 taxes: 45.4%
Here:
45%
State:
46%
(% for various income ranges: 42.0% for AGIs below $25k, 47.3% for AGIs $25k-50k, 46.9% for AGIs $50k-75k, 50.0% for AGIs $75k-100k, 64.3% for AGIs $100k-200k)
Averages for the 2004 tax year for zip code 24416, filed in 2005:
Average Adjusted Gross Income (AGI) in 2004: $33,033 (Individual Income Tax Returns)
Here:
$33,033
State:
$56,704
Salary/wage: $29,799 (reported on 90.4% of returns)
Here:
$29,799
State:
$48,441
(% of AGI for various income ranges: 98.1% for AGIs below $10k, 84.1% for AGIs $10k-25k, 87.5% for AGIs $25k-50k, 84.6% for AGIs $50k-75k, 79.0% for AGIs $75k-100k, 55.9% for AGIs over 100k)
Taxable interest for individuals: $1,187 (reported on 30.6% of returns)
This zip code:
$1,187
Virginia:
$1,688
(% of AGI for various income ranges: 2.6% for AGIs below $10k, 1.7% for AGIs $10k-25k, 0.9% for AGIs $25k-50k, 0.7% for AGIs $50k-75k, 0.8% for AGIs $75k-100k, 1.7% for AGIs over 100k)
Taxable dividends: $2,602 (reported on 13.4% of returns)
Here:
$2,602
State:
$4,028
(% of AGI for various income ranges: 0.9% for AGIs below $10k, 0.9% for AGIs $10k-25k, 0.5% for AGIs $25k-50k, 0.5% for AGIs $50k-75k, 1.0% for AGIs $75k-100k, 3.9% for AGIs over 100k)
Net capital gain/loss: +$7,597 (reported on 8.1% of returns)
Here:
+$7,597
State:
+$14,375
(% of AGI for various income ranges: -1.0% for AGIs below $10k, 0.3% for AGIs $10k-25k, 0.5% for AGIs $25k-50k, 1.3% for AGIs $50k-75k, 1.7% for AGIs $75k-100k, 9.4% for AGIs over 100k)
Profit/loss from business: +$6,408 (reported on 11.7% of returns)
Here:
+$6,408
State:
+$13,342
(% of AGI for various income ranges: 4.6% for AGIs below $10k, 2.1% for AGIs $10k-25k, 2.3% for AGIs $25k-50k, 1.3% for AGIs $50k-75k, 2.4% for AGIs $75k-100k, 3.7% for AGIs over 100k)
IRA payment deduction: $2,378 (reported on 2.2% of returns)
24416:
$2,378
Virginia:
$2,943
(% of AGI for various income ranges: 0.2% for AGIs $10k-25k, 0.2% for AGIs $25k-50k, 0.2% for AGIs $50k-75k, 0.3% for AGIs $75k-100k)
Total itemized deductions: $14,653 (24% of AGI, reported on 20.3% of returns)
Here:
$14,653
State:
$21,492
Here:
24.0% of AGI
State:
21.0% of AGI
(% of AGI for various income ranges: 5.7% for AGIs below $10k, 6.0% for AGIs $10k-25k, 7.4% for AGIs $25k-50k, 9.3% for AGIs $50k-75k, 13.0% for AGIs $75k-100k, 13.4% for AGIs over 100k)
Charity contributions deductions: $3,552 (5% of AGI, reported on 16.2% of returns)
Here:
$3,552
State:
$3,794
Here:
5.5% of AGI
State:
3.5% of AGI
(% of AGI for various income ranges: 0.5% for AGIs below $10k, 0.8% for AGIs $10k-25k, 1.2% for AGIs $25k-50k, 1.5% for AGIs $50k-75k, 2.6% for AGIs $75k-100k, 4.2% for AGIs over 100k)
Total tax: $3,738 (reported on 71.9% of returns)
24416:
$3,738
State:
$9,537
(% of AGI for various income ranges: 2.1% for AGIs below $10k, 3.8% for AGIs $10k-25k, 6.6% for AGIs $25k-50k, 8.1% for AGIs $50k-75k, 10.3% for AGIs $75k-100k, 16.5% for AGIs over 100k)
Earned income credit: $1,559 (reported on 19.2% of returns)
Here:
$1,559
State:
$1,734
Percentage of individuals using paid preparers for their 2004 taxes: 48.0%
Here:
48%
State:
52%
(% for various income ranges: 40.1% for AGIs below $10k, 48.0% for AGIs $10k-25k, 50.2% for AGIs $25k-50k, 48.5% for AGIs $50k-75k, 60.7% for AGIs $75k-100k, 60.4% for AGIs over 100k)
Household received Food Stamps/SNAP in the past 12 months: 439 Household did not receive Food Stamps/SNAP in the past 12 months: 3,251
Women who had a birth in the past 12 months: 77 (51 now married, 25 unmarried) Women who did not have a birth in the past 12 months: 2,077 (718 now married, 1,366 unmarried)
Housing units in zip code 24416 with a mortgage: 1,157 (79 second mortgage, 66 both second mortgage and home equity loan) Houses without a mortgage: 146
Median monthly owner costs for units with a mortgage: $949 Median monthly owner costs for units without a mortgage: $447
Residents with income below the poverty level in 2022:
This zip code:
19.1%
Whole state:
10.6%
Residents with income below 50% of the poverty level in 2022:
This zip code:
13.5%
Whole state:
5.2%
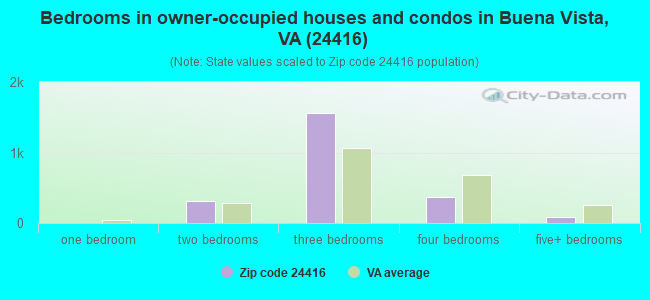
Median number of rooms in houses and condos:
Here:
6.4
State:
7.0
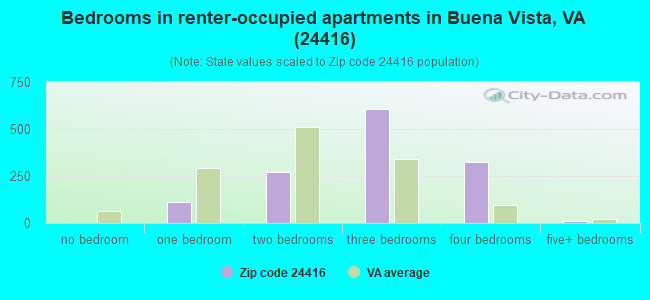
Median number of rooms in apartments:
Here:
5.5
State:
4.3
Notable locations in this zip code not listed on our city pages
Notable locations in zip code 24416: Pedlar Work Center (A), Whites Gap Overlook (B), Buena Vista Overlook (C), Cypress Falls (D), House Mountain Overlook (E), Von Canon Library (F), Tucson House (G), Student Life Office Building (H), Robey Hall (I), President's House - Southern Virginia University (J), Nyman House (K), Landrum House (L), Lancelot House (M), Knight Sports Arena (N), Knight Guest House (O), Ferrel House (P), Fawson House (Q), Craton Hall (R), Camelot House (S), Arthur House (T). Display/hide their locations on the map
Churches in zip code 24416 include: McCutcheons Chapel (A), McCutchen Church (B), Mountain View Church (C), Neriah Church (D), Riverside Church (E), Salem Church (F), Blue Ridge Baptist Church (G), Buena Vista Baptist Church (H), Buena Vista Presbyterian Church (I). Display/hide their locations on the map
Streams, rivers, and creeks: Whites Run (A), Stony Run (B), South River (C), South Fork Chalk Run (D), Sheep Creek (E), Dry Branch (F), Poplar Cove Run (G), Pedlar Gap Run (H), Marl Creek (I). Display/hide their locations on the map
In group quarters: 557 (-1 institutionalized population)
Size of family households: 1,302 2-persons, 667 3-persons, 394 4-persons, 163 5-persons, 75 6-persons, 62 7-or-more-persons
Size of nonfamily households: 843 1-person, 130 2-persons, 36 3-persons
1,109 married couples with children.
893 single-parent households (248 men, 645 women).
98.2% of residents of 24416 zip code speak English at home.
0.7% of residents speak Spanish at home (61% very well, 39% well).
0.4% of residents speak other Indo-European language at home (100% very well).
0.2% of residents speak Asian or Pacific Island language at home (100% very well).
Foreign born population: 104 (1.1%) (84.5% of them are naturalized citizens)
This zip code:
1.1%
Whole state:
12.7%
18%France
16%Guyana
7%Latvia
7%Kazakhstan
2%Hungary
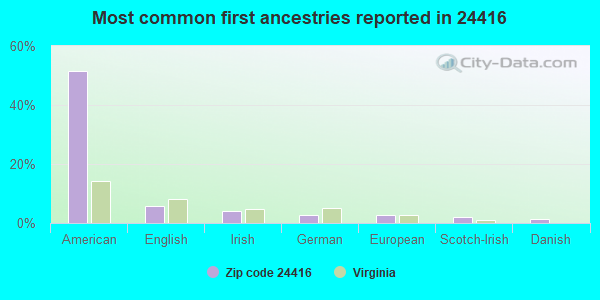
52%American
6%English
4%Irish
3%German
3%European
2%Scotch-Irish
1%Danish
Year of entry for the foreign-born population
192010 or later
322000 to 2009
51990 to 1999
57Before 1990
Facilities with environmental interests located in this zip code:
BONTEX INC (1 BONTEX DR in BUENA VISTA, VA)
AIR SYNTHETIC MINOR (AIRS/AFS) STATE MASTER (Virginia pollutants databases) - CEDS-80342, AIR PROGRAM SUPERFUND (Superfund database) CRITERIA AND HAZARDOUS AIR POLLUTANT INVENTORY (Inventory of air pollution sources) National Pollutant Discharge Elimination System NON-MAJOR (Tracking pollutant discharge elimination systems) - permit Small Quantity Generators, between 100 kg and 1000 kg of hazardous waste/month (Resource Conservation and Recovery Act (tracking hazardous waste)) TRI REPORTER (Tracking of toxic chemicals releasing facilities) Business SIC classification: PAPERBOARD MILLS; FABRICATED RUBBER PRODUCTS; PLASTICS FOAM PRODUCTS Business NAICS classification: ALL OTHER RUBBER PRODUCT MANUFACTURING. Organizations: OPERNAME (CONTACT/OPERATOR)
Alternative names: GEORGIA BONDED FIBERS INC
BUENA VISTA STP (301 WEST 10TH STREET in BUENA VISTA, VA)
National Pollutant Discharge Elimination System MAJOR (Tracking pollutant discharge elimination systems) - permit National Pollutant Discharge Elimination System NON-MAJOR (Tracking pollutant discharge elimination systems) - permit Business SIC classification: SEWERAGE SYSTEMS
BLUE BIRD EAST (HIGHWAY 501 SOUTH in BUENA VISTA, VA)
TSD (Resource Conservation and Recovery Act (tracking hazardous waste)) TRI REPORTER (Tracking of toxic chemicals releasing facilities) Business SIC classification: TRUCK AND BUS BODIES Business NAICS classification: MOTOR VEHICLE BODY MANUFACTURING. Organizations: OPERNAME (CONTACT/OPERATOR)
, OWNERNAME (CONTACT/OWNER)
BUENA VISTA MFG (32ND ST PO BOX 152 in BUENA VISTA, VA)
COASTAL MART INORPORATED #868 (60 29TH STREET in BUENA VISTA, VA)
Conditionally Exempt Small Quantity Generators, less than 100 kg/month of hazardous waste (Resource Conservation and Recovery Act (tracking hazardous waste)) - notification Organizations: OPERNAME (CONTACT/OPERATOR)
, HUGHEY L M CO (CONTACT/OWNER)
Alternative names: COASTAL MART INC #868
BUENA VISTA CITY SCHOOL DIST. (2039 SYCAMORE AVE. in BUENA VISTA, VA)
COMPLIANCE ACTIVITY (Tracking inspections of insecticide, fungicide, and rodenticide, and toxic substances)
Housing units lacking complete plumbing facilities: 2.2% Housing units lacking complete kitchen facilities: 2.0%
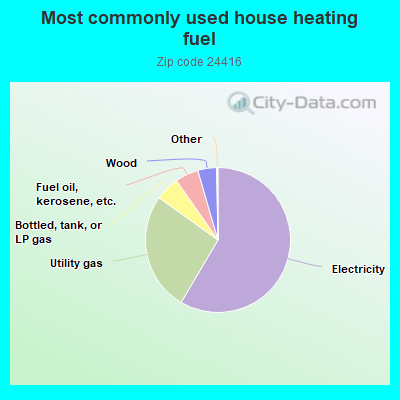
58.5%Electricity
26.4%Utility gas
5.4%Bottled, tank, or LP gas
5.2%Fuel oil, kerosene, etc.
4.2%Wood
Population in 1990: 8,464. Population change in the 1990s: +163 (+1.9%).
Place of birth for U.S.-born residents:
This state: 6,440
Northeast: 562
Midwest: 192
South: 1,099
West: 1,045
62% of the 24416 zip code residents lived in the same house 5 years ago. Out of people who lived in different houses, 25% lived in this county. Out of people who lived in different counties, 50% lived in Virginia.
86% of the 24416 zip code residents lived in the same house 1 year ago. Out of people who lived in different houses, 18% moved from this county. Out of people who lived in different houses, 56% moved from different county within same state. Out of people who lived in different houses, 27% moved from different state.
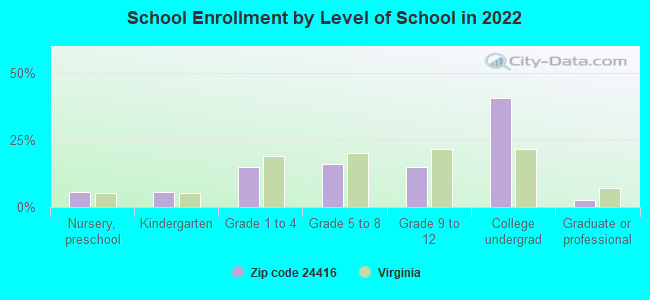
Private vs. public school enrollment:
Students in private schools in grades 1 to 8 (elementary and middle school): 102
Here:
11.5%
Virginia:
13.2%
Students in private schools in grades 9 to 12 (high school): 54
Here:
12.5%
Virginia:
10.2%
Students in private undergraduate colleges: 802
Here:
71.8%
Virginia:
18.7%
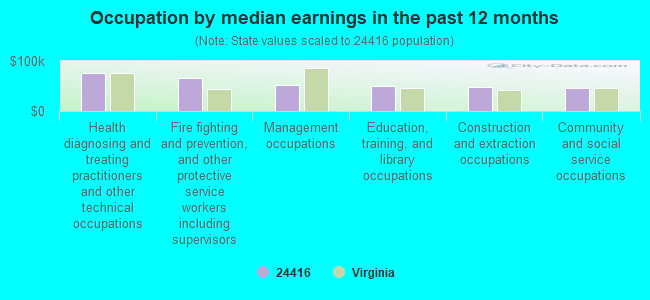
Occupation by median earnings in the past 12 months ($)
75,482Health diagnosing and treating practitioners and other technical occupations
65,531Fire fighting and prevention, and other protective service workers including supervisors
52,212Management occupations
50,254Education, training, and library occupations
47,819Construction and extraction occupations
46,311Community and social service occupations
Companies with federal contracts located in this zip code:
SAYRE ENTERPRISES INC (324 E 32ND ST in BUENA VISTA, VA; small business) : $5,030,367 in 527 contractsfrom 2001 to 2006
Contracts for Badges and Insignia, Outerwear, Men's, Athletic and Sporting Equipment, Jewelry, and moreby Defense Logistics Agency, Federal Supply Service, Army, Bureau of Immigration and Customs Enforcement, and others Signed by year:2000: $0; 2001: $111,838; 2002: $153,779; 2003: $1,145,900; 2004: $1,393,835; 2005: $1,260,098; 2006: $964,917.
Biggest contracts:
$142,504 with Defense Logistics Agency for Badges and Insignia. Signed on 2004-04-02. Completion date: 2004-04-30.
$93,975 with Federal Supply Service for Outerwear, Men's. Signed on 2006-02-21. Completion date: 2006-03-26.
$81,250 with Army for Outerwear, Men's. Signed on 2001-01-29. Completion date: 2001-02-05.
$77,865 with Federal Supply Service for Outerwear, Men's. Signed on 2006-02-27. Completion date: 2006-04-01.
Top industries in this zip code by the number of employees in 2005:
Educational Services: Colleges, Universities, and Professional Schools (250-499 employees: 1 establishment)
Health Care and Social Assistance: Nursing Care Facilities (50-99: 2)
Health Care and Social Assistance: Services for the Elderly and Persons with Disabilities (50-99: 2)
Administrative and Support and Waste Management and Remediation Services: Temporary Help Services (50-99: 1)
People in group quarters in 2010:
326 people in college/university student housing
74 people in nursing facilities/skilled-nursing facilities
People in group quarters in 2000:
202 people in college dormitories (includes college quarters off campus)
89 people in nursing homes
Fatal accident statistics in 2014:
Fatal accident count: 1
Vehicles involved in fatal accidents: 1
Fatal accidents caused by drunken drivers: 0
Fatalities: 1
Persons involved in fatal accidents: 2
Pedestrians involved in fatal accidents: 0
2002 - 2018 National Fire Incident Reporting System (NFIRS) incidents
According to the data from the years 2002 - 2018 the average number of fires per year is 56. The highest number of fire incidents - 86 took place in 2011, and the least - 28 in 2018. The data has a declining trend.
When looking into fire subcategories, the most reports belonged to: Structure Fires (55.8%), and Outside Fires (25.0%).
Fire incident types reported to NFIRS in Zip Code 24416
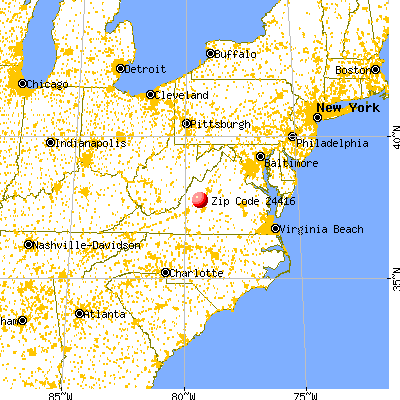


 Nearest zip codes: 24555, 24483, 24435, 24450, 24574, 24526.


 According to the data from the years 2002 - 2018 the average number of fires per year is 56. The highest number of fire incidents - 86 took place in 2011, and the least - 28 in 2018. The data has a declining trend.
 When looking into fire subcategories, the most reports belonged to: Structure Fires (55.8%), and Outside Fires (25.0%).