Races in Stratford, Connecticut (CT) Detailed Stats
Data:
Races - White alone (%)
Races - White alone (% change since 2000)
Races - Black alone (%)
Races - Black alone (% change since 2000)
Races - American Indian alone (%)
Races - American Indian alone (% change since 2000)
Races - Asian alone (%)
Races - Asian alone (% change since 2000)
Races - Hispanic (%)
Races - Hispanic (% change since 2000)
Races - Native Hawaiian and Other Pacific Islander alone (%)
Races - Native Hawaiian and Other Pacific Islander alone (% change since 2000)
Races - Two or more races(%)
Races - Two or more races(% change since 2000)
Races - Other race alone (%)
Races - Other race alone (% change since 2000)
Racial diversity
Place of birth - Born in state of residence (%)
Place of birth - Born in state of residence (%) - White
Place of birth - Born in state of residence (%) - Black or African American
Place of birth - Born in state of residence (%) - Asian
Place of birth - Born in state of residence (%) - Hispanic or Latino
Place of birth - Born in state of residence (%) - American Indian and Alaska Native
Place of birth - Born in state of residence (%) - Multirace
Place of birth - Born in state of residence (%) - Other Race
Place of birth - Born in other state (%)
Place of birth - Born in other state (%) - White
Place of birth - Born in other state (%) - Black or African American
Place of birth - Born in other state (%) - Asian
Place of birth - Born in other state (%) - Hispanic or Latino
Place of birth - Born in other state (%) - American Indian and Alaska Native
Place of birth - Born in other state (%) - Multirace
Place of birth - Born in other state (%) - Other Race
Place of birth - Native, outside of US (%)
Place of birth - Native, outside of US (%) - White
Place of birth - Native, outside of US (%) - Black or African American
Place of birth - Native, outside of US (%) - Asian
Place of birth - Native, outside of US (%) - Hispanic or Latino
Place of birth - Native, outside of US (%) - American Indian and Alaska Native
Place of birth - Native, outside of US (%) - Multirace
Place of birth - Native, outside of US (%) - Other Race
Place of birth - Foreign born (%)
Place of birth - Foreign born (%) - White
Place of birth - Foreign born (%) - Black or African American
Place of birth - Foreign born (%) - Asian
Place of birth - Foreign born (%) - Hispanic or Latino
Place of birth - Foreign born (%) - American Indian and Alaska Native
Place of birth - Foreign born (%) - Multirace
Place of birth - Foreign born (%) - Other Race
Residents speaking English at home (%)
Residents speaking English at home - Born in the United States (%)
Residents speaking English at home - Native, born elsewhere (%)
Residents speaking English at home - Foreign born (%)
Residents speaking Spanish at home (%)
Residents speaking Spanish at home - Born in the United States (%)
Residents speaking Spanish at home - Native, born elsewhere (%)
Residents speaking Spanish at home - Foreign born (%)
Residents speaking other language at home (%)
Residents speaking other language at home - Born in the United States (%)
Residents speaking other language at home - Native, born elsewhere (%)
Residents speaking other language at home - Foreign born (%)
Marital status - Never married (%)
Marital status - Now married (%)
Marital status - Separated (%)
Marital status - Widowed (%)
Marital status - Divorced (%)
Ancestries Reported - Arab (%)
Ancestries Reported - Czech (%)
Ancestries Reported - Danish (%)
Ancestries Reported - Dutch (%)
Ancestries Reported - English (%)
Ancestries Reported - French (%)
Ancestries Reported - French Canadian (%)
Ancestries Reported - German (%)
Ancestries Reported - Greek (%)
Ancestries Reported - Hungarian (%)
Ancestries Reported - Irish (%)
Ancestries Reported - Italian (%)
Ancestries Reported - Lithuanian (%)
Ancestries Reported - Norwegian (%)
Ancestries Reported - Polish (%)
Ancestries Reported - Portuguese (%)
Ancestries Reported - Russian (%)
Ancestries Reported - Scotch-Irish (%)
Ancestries Reported - Scottish (%)
Ancestries Reported - Slovak (%)
Ancestries Reported - Subsaharan African (%)
Ancestries Reported - Swedish (%)
Ancestries Reported - Swiss (%)
Ancestries Reported - Ukrainian (%)
Ancestries Reported - United States (%)
Ancestries Reported - Welsh (%)
Ancestries Reported - West Indian (%)
Ancestries Reported - Other (%)
Geographical mobility - Same house 1 year ago (%)
Geographical mobility - Same house 1 year ago (%) - White
Geographical mobility - Same house 1 year ago (%) - Black or African American
Geographical mobility - Same house 1 year ago (%) - Asian
Geographical mobility - Same house 1 year ago (%) - Hispanic or Latino
Geographical mobility - Same house 1 year ago (%) - American Indian and Alaska Native
Geographical mobility - Same house 1 year ago (%) - Multirace
Geographical mobility - Same house 1 year ago (%) - Other Race
Geographical mobility - Moved within same county (%)
Geographical mobility - Moved within same county (%) - White
Geographical mobility - Moved within same county (%) - Black or African American
Geographical mobility - Moved within same county (%) - Asian
Geographical mobility - Moved within same county (%) - Hispanic or Latino
Geographical mobility - Moved within same county (%) - American Indian and Alaska Native
Geographical mobility - Moved within same county (%) - Multirace
Geographical mobility - Moved within same county (%) - Other Race
Geographical mobility - Moved from different county within same state (%)
Geographical mobility - Moved from different county within same state (%) - White
Geographical mobility - Moved from different county within same state (%) - Black or African American
Geographical mobility - Moved from different county within same state (%) - Asian
Geographical mobility - Moved from different county within same state (%) - Hispanic or Latino
Geographical mobility - Moved from different county within same state (%) - American Indian and Alaska Native
Geographical mobility - Moved from different county within same state (%) - Multirace
Geographical mobility - Moved from different county within same state (%) - Other Race
Geographical mobility - Moved from different state (%)
Geographical mobility - Moved from different state (%) - White
Geographical mobility - Moved from different state (%) - Black or African American
Geographical mobility - Moved from different state (%) - Asian
Geographical mobility - Moved from different state (%) - Hispanic or Latino
Geographical mobility - Moved from different state (%) - American Indian and Alaska Native
Geographical mobility - Moved from different state (%) - Multirace
Geographical mobility - Moved from different state (%) - Other Race
Geographical mobility - Moved from abroad (%)
Geographical mobility - Moved from abroad (%) - White
Geographical mobility - Moved from abroad (%) - Black or African American
Geographical mobility - Moved from abroad (%) - Asian
Geographical mobility - Moved from abroad (%) - Hispanic or Latino
Geographical mobility - Moved from abroad (%) - American Indian and Alaska Native
Geographical mobility - Moved from abroad (%) - Multirace
Geographical mobility - Moved from abroad (%) - Other Race
Place of birth for the foreign-born population - Ireland (%)
Place of birth for the foreign-born population - Denmark (%)
Place of birth for the foreign-born population - Norway (%)
Place of birth for the foreign-born population - Sweden (%)
Place of birth for the foreign-born population - United Kingdom (%)
Place of birth for the foreign-born population - England (%)
Place of birth for the foreign-born population - Scotland (%)
Place of birth for the foreign-born population - Other Northern Europe (%)
Place of birth for the foreign-born population - Austria (%)
Place of birth for the foreign-born population - Belgium (%)
Place of birth for the foreign-born population - France (%)
Place of birth for the foreign-born population - Germany (%)
Place of birth for the foreign-born population - Netherlands (%)
Place of birth for the foreign-born population - Switzerland (%)
Place of birth for the foreign-born population - Other Western Europe (%)
Place of birth for the foreign-born population - Greece (%)
Place of birth for the foreign-born population - Italy (%)
Place of birth for the foreign-born population - Portugal (%)
Place of birth for the foreign-born population - Spain (%)
Place of birth for the foreign-born population - Other Southern Europe (%)
Place of birth for the foreign-born population - Albania (%)
Place of birth for the foreign-born population - Belarus (%)
Place of birth for the foreign-born population - Bosnia and Herzegovina (%)
Place of birth for the foreign-born population - Bulgaria (%)
Place of birth for the foreign-born population - Croatia (%)
Place of birth for the foreign-born population - Czechoslovakia (%)
Place of birth for the foreign-born population - Hungary (%)
Place of birth for the foreign-born population - Latvia (%)
Place of birth for the foreign-born population - Lithuania (%)
Place of birth for the foreign-born population - North Macedonia (Macedonia) (%)
Place of birth for the foreign-born population - Moldova (%)
Place of birth for the foreign-born population - Poland (%)
Place of birth for the foreign-born population - Romania (%)
Place of birth for the foreign-born population - Russia (%)
Place of birth for the foreign-born population - Serbia (%)
Place of birth for the foreign-born population - Ukraine (%)
Place of birth for the foreign-born population - Other Eastern Europe (%)
Place of birth for the foreign-born population - China (%)
Place of birth for the foreign-born population - Hong Kong (%)
Place of birth for the foreign-born population - Taiwan (%)
Place of birth for the foreign-born population - Japan (%)
Place of birth for the foreign-born population - Korea (%)
Place of birth for the foreign-born population - Other Eastern Asia (%)
Place of birth for the foreign-born population - Afghanistan (%)
Place of birth for the foreign-born population - Bangladesh (%)
Place of birth for the foreign-born population - India (%)
Place of birth for the foreign-born population - Iran (%)
Place of birth for the foreign-born population - Kazakhstan (%)
Place of birth for the foreign-born population - Nepal (%)
Place of birth for the foreign-born population - Pakistan (%)
Place of birth for the foreign-born population - Sri Lanka (%)
Place of birth for the foreign-born population - Uzbekistan (%)
Place of birth for the foreign-born population - Other South Central Asia (%)
Place of birth for the foreign-born population - Burma (%)
Place of birth for the foreign-born population - Cambodia (%)
Place of birth for the foreign-born population - Indonesia (%)
Place of birth for the foreign-born population - Laos (%)
Place of birth for the foreign-born population - Malaysia (%)
Place of birth for the foreign-born population - Philippines (%)
Place of birth for the foreign-born population - Singapore (%)
Place of birth for the foreign-born population - Thailand (%)
Place of birth for the foreign-born population - Vietnam (%)
Place of birth for the foreign-born population - Other South Eastern Asia (%)
Place of birth for the foreign-born population - Armenia (%)
Place of birth for the foreign-born population - Iraq (%)
Place of birth for the foreign-born population - Israel (%)
Place of birth for the foreign-born population - Jordan (%)
Place of birth for the foreign-born population - Kuwait (%)
Place of birth for the foreign-born population - Lebanon (%)
Place of birth for the foreign-born population - Saudi Arabia (%)
Place of birth for the foreign-born population - Syria (%)
Place of birth for the foreign-born population - Turkey (%)
Place of birth for the foreign-born population - Yemen (%)
Place of birth for the foreign-born population - Other Western Asia (%)
Place of birth for the foreign-born population - Eritrea (%)
Place of birth for the foreign-born population - Ethiopia (%)
Place of birth for the foreign-born population - Kenya (%)
Place of birth for the foreign-born population - Somalia (%)
Place of birth for the foreign-born population - Uganda (%)
Place of birth for the foreign-born population - Zimbabwe (%)
Place of birth for the foreign-born population - Other Eastern Africa (%)
Place of birth for the foreign-born population - Cameroon (%)
Place of birth for the foreign-born population - Congo (%)
Place of birth for the foreign-born population - Democratic Republic of Congo (Zaire) (%)
Place of birth for the foreign-born population - Other Middle Africa (%)
Place of birth for the foreign-born population - Egypt (%)
Place of birth for the foreign-born population - Morocco (%)
Place of birth for the foreign-born population - Sudan (%)
Place of birth for the foreign-born population - Other Northern Africa (%)
Place of birth for the foreign-born population - South Africa (%)
Place of birth for the foreign-born population - Other Southern Africa (%)
Place of birth for the foreign-born population - Cabo Verde (%)
Place of birth for the foreign-born population - Ghana (%)
Place of birth for the foreign-born population - Liberia (%)
Place of birth for the foreign-born population - Nigeria (%)
Place of birth for the foreign-born population - Senegal (%)
Place of birth for the foreign-born population - Sierra Leone (%)
Place of birth for the foreign-born population - Other Western Africa (%)
Place of birth for the foreign-born population - Australia (%)
Place of birth for the foreign-born population - New Zealand (%)
Place of birth for the foreign-born population - Fiji (%)
Place of birth for the foreign-born population - Micronesia (%)
Place of birth for the foreign-born population - Bahamas (%)
Place of birth for the foreign-born population - Barbados (%)
Place of birth for the foreign-born population - Cuba (%)
Place of birth for the foreign-born population - Dominica (%)
Place of birth for the foreign-born population - Dominican Republic (%)
Place of birth for the foreign-born population - Grenada (%)
Place of birth for the foreign-born population - Haiti (%)
Place of birth for the foreign-born population - Jamaica (%)
Place of birth for the foreign-born population - St. Vincent and the Grenadines (%)
Place of birth for the foreign-born population - Trinidad and Tobago (%)
Place of birth for the foreign-born population - West Indies (%)
Place of birth for the foreign-born population - Other Caribbean (%)
Place of birth for the foreign-born population - Belize (%)
Place of birth for the foreign-born population - Costa Rica (%)
Place of birth for the foreign-born population - El Salvador (%)
Place of birth for the foreign-born population - Guatemala (%)
Place of birth for the foreign-born population - Honduras (%)
Place of birth for the foreign-born population - Mexico (%)
Place of birth for the foreign-born population - Nicaragua (%)
Place of birth for the foreign-born population - Panama (%)
Place of birth for the foreign-born population - Other Central America (%)
Place of birth for the foreign-born population - Argentina (%)
Place of birth for the foreign-born population - Bolivia (%)
Place of birth for the foreign-born population - Brazil (%)
Place of birth for the foreign-born population - Chile (%)
Place of birth for the foreign-born population - Colombia (%)
Place of birth for the foreign-born population - Ecuador (%)
Place of birth for the foreign-born population - Guyana (%)
Place of birth for the foreign-born population - Peru (%)
Place of birth for the foreign-born population - Uruguay (%)
Place of birth for the foreign-born population - Venezuela (%)
Place of birth for the foreign-born population - Other South America (%)
Place of birth for the foreign-born population - Canada (%)
Place of birth for the foreign-born population - Other Northern America (%)
Place of birth for the foreign-born population - Other (%)
Latest news about races in Stratford, CT collected exclusively by city-data.com from local newspapers, TV, and radio stations
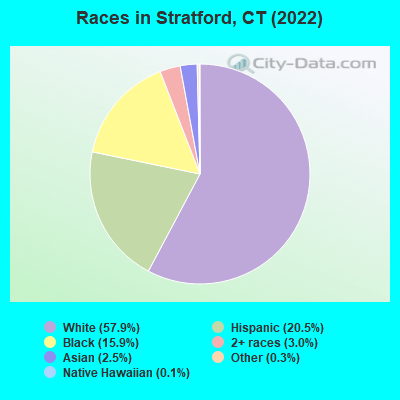
According to 2022 data, the most numerous races in Stratford, CT are White alone (30,421 residents), Hispanic (10,745 residents), and Black alone (8,339 residents). 79.2% of Stratford residents speak English at home. 14.3% of Stratford, CT residents are foreign-born (8.4% born in Latin America, 2.8% born in Europe, 2.0% born in Asia), which is 4.6% less than the foreign-born rate of 15.0% across the entire state of Connecticut.
Race distribution in Stratford
2000 2022
2,638,845 77.5% White alone 320,323 9.4% Hispanic 295,571 8.7% Black alone 81,564 2.4% Asian alone 52,896 1.6% Two or more races 8,141 0.2% Other race alone 7,267 0.2% American Indian alone 958 0.03% Native Hawaiian and Other
2,246,913 62.0% White alone 658,978 18.2% Hispanic 353,973 9.8% Black alone 172,929 4.8% Asian alone 159,631 4.4% Two or more races 29,761 0.8% Other race alone 3,428 0.09% American Indian alone 592 0.02% Native Hawaiian and Other
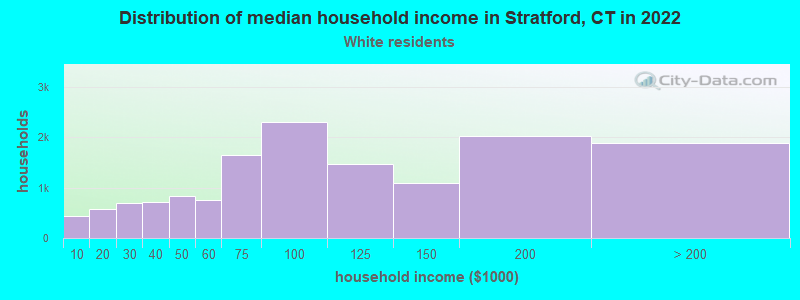
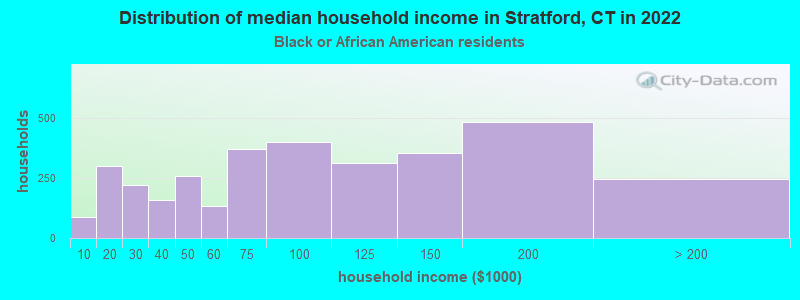
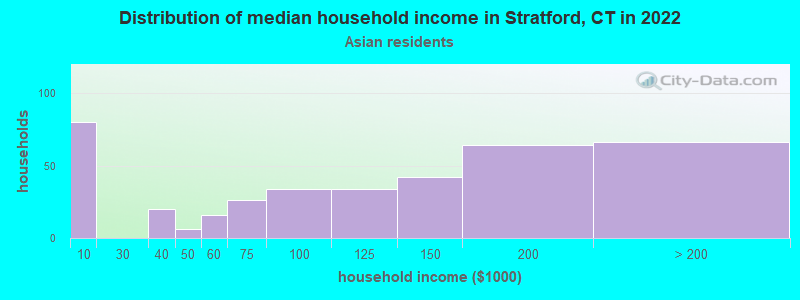
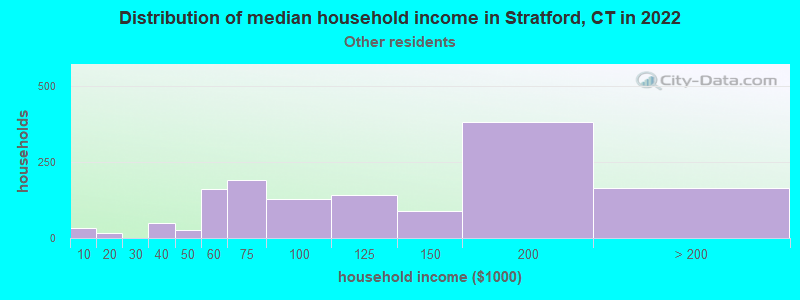
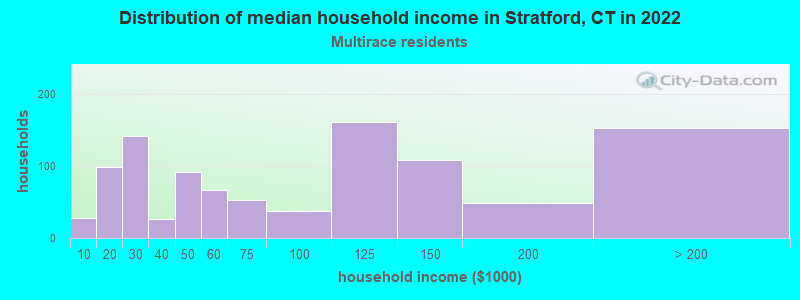
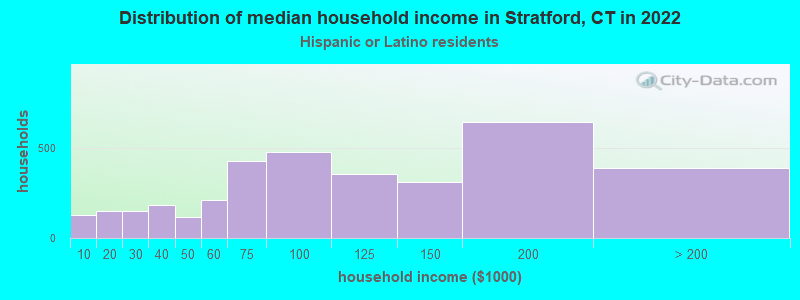
Income and house value in Stratford Median household income in 2022 $96,485 White non-Hispanic householders$81,865 Black householders$100,874 American Indian and Alaska Native householders$116,332 Asian householders$76,590 Some other race householders$65,054 Two or more races householders$102,166 Hispanic or Latino race householdersMedian 2022 house value $359,522 White Non-Hispanic householders$263,534 Black or African American householders$391,951 American Indian or Alaska Native householders $402,976 Asian householders$308,934 Some other race householders$316,284 Two or more races householders$312,177 Hispanic or Latino householders
Median age by race in Stratford
48.7 Median age for White residents47.0 50.8 37.5 Median age for Black or African American residents36.1 38.1 19.3 Median age for American Indian / Alaska Native residents33.1 Median age for Asian residents31.6 33.5 15.9 Median age for Native Hawaiian / Pacific Islander residents38.4 Median age for Other race residents35.4 40.0 30.3 Median age for Two or more races residents31.1 30.3 51.5 Median age for White alone residents49.2 52.8 34.5 Median age for Hispanic or Latino residents34.7 34.4
Owner/renter occupied households by race in Stratford
House owners and renters - White residents 12,445 83.7% Owner occupied2,427 16.3% Renter occupiedHouse owners and renters - Black or African American residents 1,864 58.7% Owner occupied1,312 41.3% Renter occupiedHouse owners and renters - American Indian / Alaska Native residents 10 100.0% Owner occupiedHouse owners and renters - Asian residents 256 64.2% Owner occupied143 35.8% Renter occupiedHouse owners and renters - Native Hawaiian / Pacific Islander residents 32 100.0% Owner occupiedHouse owners and renters - Other race residents 971 84.9% Owner occupied173 15.1% Renter occupiedHouse owners and renters - Two or more races residents 792 71.8% Owner occupied311 28.2% Renter occupiedHouse owners and renters - White alone residents 11,313 83.8% Owner occupied2,185 16.2% Renter occupiedHouse owners and renters - Hispanic or Latino residents 2,717 77.9% Owner occupied770 22.1% Renter occupied
Language usage in Stratford
English speakers - Total 79.2% of residents of Stratford speak English at home.
12.4% of residents speak Spanish at home 4,223 68.1% Speak English very well1,974 31.9% Speak English less than very well8.4% of residents speak other language at home 2,606 62.0% Speak English very well1,596 38.0% Speak English less than very well
English speakers - Born in the United States 88.5% of residents of Stratford speak English at home.
8.2% of residents speak Spanish at home 787 90.0% Speak English very well87 10.0% Speak English less than very well3.5% of residents speak other language at home 328 86.8% Speak English very well50 13.2% Speak English less than very well
English speakers - Native, born elsewhere 36.7% of residents of Stratford speak English at home.
60.0% of residents speak Spanish at home 510 56.1% Speak English very well399 43.9% Speak English less than very well5.3% of residents speak other language at home 81 100.0% Speak English very well
English speakers - Foreign-born 32.3% of residents of Stratford speak English at home.
31.3% of residents speak Spanish at home 1,182 49.2% Speak English very well1,221 50.8% Speak English less than very well36.7% of residents speak other language at home 1,340 47.6% Speak English very well1,478 52.4% Speak English less than very well
White (Caucasian) - Speak only English Native:
93.2% (28,436)Foreign-born:
22.7% (671)
White (Caucasian) - Speak another language Native:
6.9% (2,104)Foreign-born:
76.4% (2,259)
Black or African American - Speak only English Native:
92.9% (5,892)Foreign-born:
63.8% (1,489)
Black or African American - Speak another language Native:
7.5% (473)Foreign-born:
34.9% (814)
American Indian / Alaska Native - Speak only English Native:
60.4% (15)Foreign-born:
87.5% (38)
Asian - Speak only English Native:
59.4% (173)Foreign-born:
28.9% (261)
Asian - Speak another language Native:
40.7% (119)Foreign-born:
73.3% (661)
Other race - Speak only English Native:
31.8% (700)Foreign-born:
2.9% (29)
Other race - Speak another language Native:
68.2% (1,503)Foreign-born:
95.9% (935)
Two or more races - Speak only English Native:
67.0% (1,762)Foreign-born:
4.3% (28)
Two or more races - Speak another language Native:
31.2% (820)Foreign-born:
100.0% (650)
White alone - Speak only English Native:
96.9% (26,609)Foreign-born:
29.6% (568)
White alone - Speak another language Native:
3.2% (889)Foreign-born:
70.3% (1,349)
Hispanic or Latino - Speak only English Native:
54.3% (3,869)Foreign-born:
6.8% (185)
Hispanic or Latino - Speak another language Native:
49.0% (3,490)Foreign-born:
93.2% (2,541)
Foreign-born residents in Stratford 7,544 residents are foreign born (8.4% Latin America , 2.8% Europe , 2.0% Asia ).
This city:
14.3%Connecticut:
100.0%
Marital status for residents in Stratford Marital status - White (Caucasian) population 15 years and over
Males 32.1% Never married55.5% Now married1.2% Separated3.7% Widowed7.4% DivorcedFemales 25.6% Never married48.1% Now married0.7% Separated12.7% Widowed13.0% DivorcedWomen who gave birth in the past 12 months Now married:
75.4% (245)Unmarried:
24.6% (80)
Women who did not give birth in the past 12 months Now married:
44.5% (3,012)Unmarried:
55.5% (3,753)
Marital status - Black or African American population 15 years and over
Males 37.3% Never married52.4% Now married0.0% Separated1.0% Widowed9.3% DivorcedFemales 42.2% Never married34.6% Now married1.4% Separated6.0% Widowed15.7% DivorcedWomen who gave birth in the past 12 months Now married:
29.5% (40)Unmarried:
70.5% (95)
Women who did not give birth in the past 12 months Now married:
29.1% (732)Unmarried:
70.9% (1,785)
Marital status - American Indian / Alaska Native population 15 years and over
Males 67.6% Never married32.4% Now married0.0% Separated0.0% Widowed0.0% DivorcedFemales 0.0% Never married100.0% Now married0.0% Separated0.0% Widowed0.0% DivorcedWomen who did not give birth in the past 12 months Now married:
100.0% (15)Unmarried:
0.0% (0)
Marital status - Asian population 15 years and over
Males 33.3% Never married54.4% Now married0.0% Separated8.9% Widowed3.4% DivorcedFemales 31.6% Never married54.0% Now married0.0% Separated10.3% Widowed4.0% DivorcedWomen who gave birth in the past 12 months Now married:
41.3% (38)Unmarried:
58.7% (54)
Women who did not give birth in the past 12 months Now married:
61.9% (152)Unmarried:
38.1% (93)
Marital status - Other race population 15 years and over
Males 36.6% Never married57.3% Now married1.5% Separated0.6% Widowed4.0% DivorcedFemales 30.0% Never married59.8% Now married0.0% Separated0.0% Widowed10.2% DivorcedWomen who gave birth in the past 12 months Now married:
100.0% (15)Unmarried:
0.0% (0)
Women who did not give birth in the past 12 months Now married:
54.4% (601)Unmarried:
45.6% (503)
Marital status - Two or more races population 15 years and over
Males 62.7% Never married25.0% Now married2.4% Separated0.0% Widowed9.9% DivorcedFemales 62.5% Never married24.2% Now married2.8% Separated0.0% Widowed10.5% DivorcedWomen who gave birth in the past 12 months Now married:
0.0% (0)Unmarried:
100.0% (24)
Women who did not give birth in the past 12 months Now married:
19.6% (161)Unmarried:
80.4% (663)
Marital status - White alone, not Hispanic / Latino population 15 years and over
Males 31.8% Never married54.6% Now married1.2% Separated4.3% Widowed8.1% DivorcedFemales 23.9% Never married48.1% Now married0.4% Separated14.0% Widowed13.6% DivorcedWomen who gave birth in the past 12 months Now married:
91.7% (232)Unmarried:
8.3% (21)
Women who did not give birth in the past 12 months Now married:
45.0% (2,557)Unmarried:
55.0% (3,126)
Marital status - Hispanic or Latino population 15 years and over
Males 37.8% Never married57.2% Now married1.0% Separated0.2% Widowed3.8% DivorcedFemales 37.0% Never married47.9% Now married1.5% Separated3.0% Widowed10.5% DivorcedWomen who gave birth in the past 12 months Now married:
33.1% (43)Unmarried:
66.9% (87)
Women who did not give birth in the past 12 months Now married:
41.9% (1,187)Unmarried:
58.1% (1,648)
Ancestries in Stratford
3,375 12.4% Italian1,931 7.1% Irish1,323 4.9% American1,148 4.2% Jamaican1,058 3.9% Polish679 2.5% Haitian600 2.2% African546 2.0% English502 1.8% European397 1.5% Slovak392 1.4% Hungarian361 1.3% German282 1.0% Portuguese275 1.0% Albanian240 0.9% Afghan209 0.8% French Canadian180 0.7% Eastern European176 0.6% Greek171 0.6% Russian170 0.6% Trinidadian and Tobagonian142 0.5% French135 0.5% Scottish121 0.4% Turkish110 0.4% Ukrainian103 0.4% Swedish98 0.4% Slavic92 0.3% British65 0.2% Lithuanian62 0.2% Czechoslovakian61 0.2% Canadian59 0.2% Finnish58 0.2% Syrian58 0.2% West Indian44 0.2% Scotch-Irish43 0.2% Brazilian32 0.1% Dutch31 0.1% Ghanaian30 0.1% Czech29 0.1% Arab29 0.1% Romanian29 0.1% Bulgarian23 0.08% Austrian22 0.08% Lebanese19 0.07% Armenian18 0.07% Nigerian17 0.06% Carpatho Rusyn16 0.06% U.S. Virgin Islander11 0.04% Belgian11 0.04% Guyanese11 0.04% Norwegian10 0.04% Welsh10 0.04% Celtic7 0.03% Barbadian7 0.03% Northern European6 0.02% British West Indian5 0.02% Yugoslavian
Geographical mobility in Stratford Same house 1 year ago 32,544 94.0% White (Caucasian)8,201 89.9% Black or African American17 36.9% American Indian / Alaska Native1,143 89.4% Asian15 18.8% Native Hawaiian / Pacific Islander3,107 93.9% Other race3,552 95.2% Two or more races29,211 94.6% White alone, not Hispanic / Latino9,470 92.7% Hispanic or LatinoMoved within same county 1,023 3.0% White / Caucasian579 6.4% Black or African American15 1.2% Asian30 37.1% Native Hawaiian / Pacific Islander91 2.8% Other race199 5.3% Two or more races891 2.9% White alone, not Hispanic / Latino369 3.6% Hispanic or LatinoMoved within same state 560 1.6% White / Caucasian42 0.5% Black or African American34 2.6% Asian25 30.8% Native Hawaiian / Pacific Islander314 1.0% White alone, not Hispanic / Latino275 2.7% Hispanic or LatinoMoved from different state 470 1.4% White / Caucasian277 3.0% Black or African American205 16.0% Asian11 14.0% Native Hawaiian / Pacific Islander45 1.4% Other race46 1.2% Two or more races398 1.3% White alone, not Hispanic / Latino190 1.9% Hispanic or LatinoMoved from abroad 62 0.2% White41 0.5% Black or African American11 22.8% American Indian / Alaska Native7 0.5% Asian120 3.6% Other race13 0.3% Two or more races47 0.2% White alone, not Hispanic / Latino84 0.8% Hispanic or Latino
Children Nativity (place of birth) in Stratford
Children under 6 years - Living with two parents Both parents native 1,264 100.0% NativeBoth parents foreign-born 478 100.0% NativeOne native, one foreign-born parent 200 100.0% NativeChildren under 6 years - Living with one parent Native parent 797 100.0% Native0 0.0% Foreign-bornForeign-born parent 87 83.4% Native17 16.6% Foreign-bornChildren 6 to 17 years - Living with two parents Both parents native 2,695 99.6% Native12 0.4% Foreign-bornBoth parents foreign-born 853 83.3% Native170 16.7% Foreign-bornOne native, one foreign-born parent 829 98.6% Native12 1.4% Foreign-bornChildren 6 to 17 years - Living with one parent Native parent 1,516 100.0% NativeForeign-born parent 297 51.7% Native278 48.3% Foreign-born
Grandparents responsible for own grandchildren in Stratford
Grandparents (30 to 59 years) White / Caucasian 37 33.9% Responsible for grandchildren71 66.1% Not responsible for grandchildrenBlack or African American 50 63.1% Responsible for grandchildren29 36.9% Not responsible for grandchildrenAsian 11 100.0% Not responsible for grandchildrenOther race 40 100.0% Not responsible for grandchildrenWhite alone, not Hispanic / Latino 18 39.5% Responsible for grandchildren27 60.5% Not responsible for grandchildrenHispanic or Latino 9 5.3% Responsible for grandchildren157 94.7% Not responsible for grandchildrenGrandparents (60 years and over) White / Caucasian 132 29.4% Responsible for grandchildren317 70.6% Not responsible for grandchildrenBlack or African American 12 15.2% Responsible for grandchildren68 84.8% Not responsible for grandchildrenAsian 54 100.0% Not responsible for grandchildrenOther race 125 100.0% Not responsible for grandchildrenWhite alone, not Hispanic / Latino 150 37.4% Responsible for grandchildren251 62.6% Not responsible for grandchildrenHispanic or Latino 8 3.7% Responsible for grandchildren196 96.3% Not responsible for grandchildren