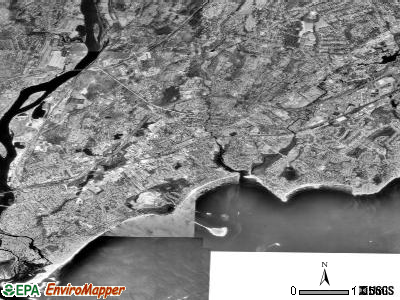
Stratford, Connecticut
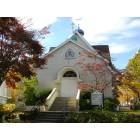
Stratford: Russian Church

Stratford: Booth Park
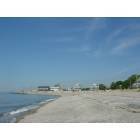
Stratford: Russian Beach

Stratford: Cemetary Behind Stratford Library
- add
your


Submit your own pictures of this place and show them to the world
- OSM Map
- General Map
- Google Map
- MSN Map
Population change since 2000: +2.8%
| Males: 24,293 | |
| Females: 27,091 |
| Median resident age: | 42.5 years |
| Connecticut median age: | 40.9 years |
| Stratford: | $87,706 |
| CT: | $88,429 |
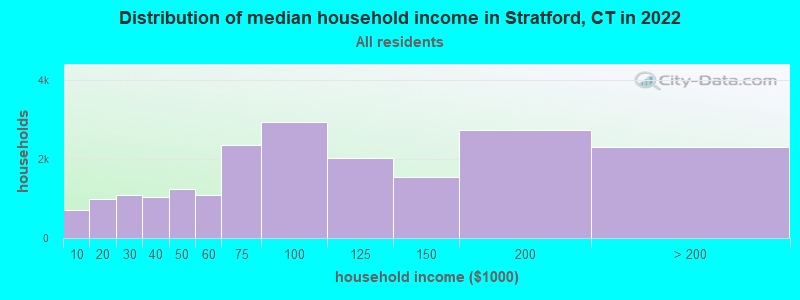
Estimated per capita income in 2022: $47,520 (it was $26,501 in 2000)
Stratford CDP income, earnings, and wages data
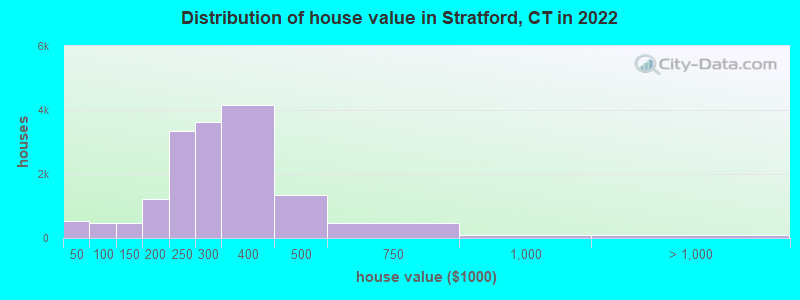
Estimated median house or condo value in 2022: $344,606 (it was $159,400 in 2000)
| Stratford: | $344,606 |
| CT: | $347,200 |
Mean prices in 2022: all housing units: $325,139; detached houses: $348,906; townhouses or other attached units: $254,219; in 2-unit structures: $249,810; in 3-to-4-unit structures: $243,836; in 5-or-more-unit structures: $194,948
Median gross rent in 2022: $1,518.
(4.7% for White Non-Hispanic residents, 15.4% for Black residents, 10.6% for Hispanic or Latino residents, 21.4% for American Indian residents, 24.1% for Native Hawaiian and other Pacific Islander residents, 7.3% for other race residents, 11.5% for two or more races residents)
Detailed information about poverty and poor residents in Stratford, CT

Compare current foreclosures in Stratford, CT:
| Photo | Address | Area | Beds / Baths | Price | Details |
|---|---|---|---|---|---|

|
#1
Alfred Ct
Stratford, CT 06615
|
1,406 sq. feet
|
2 baths 3 beds |
$449,900
|
show details |

|
#2
Allencrest Dr
Stratford, CT 06614
|
1,884 sq. feet
|
2 baths 4 beds |
show details | |

|
#3
High View Dr
Stratford, CT 06614
|
2,574 sq. feet
|
2 baths 4 beds |
show details | |

|
#4
Reitter St
Stratford, CT 06614
|
1,310 sq. feet
|
1 baths 3 beds |
show details | |

|
#5
Graham St
Stratford, CT 06615
|
1,056 sq. feet
|
2 baths 3 beds |
show details | |

|
#6
Newton St
Stratford, CT 06614
|
1,660 sq. feet
|
1 baths 3 beds |
show details | |

|
#7
Marcroft St
Stratford, CT 06614
|
1,346 sq. feet
|
2 baths 3 beds |
show details | |

|
#8
King St
Stratford, CT 06614
|
1,040 sq. feet
|
1 baths 2 beds |
show details | |

|
#9
Henry Ave Unit 32k
Stratford, CT 06614
|
662 sq. feet
|
1 baths 1 beds |
show details | |

|
#10
General St
Stratford, CT 06615
|
1,200 sq. feet
|
1 baths 2 beds |
show details |
| Photo | Address | Area | Beds / Baths | Price | Details |
|---|---|---|---|---|---|

|
#11
Hawley Gln
Stratford, CT 06614
|
1,090 sq. feet
|
1 baths 1 beds |
show details | |

|
#12
Seminole Ln # B
Stratford, CT 06614
|
1,454 sq. feet
|
2 baths 1 beds |
show details | |

|
#13
Prospect Dr
Stratford, CT 06615
|
1,924 sq. feet
|
1 baths 2 beds |
show details | |

|
#14
Thompson St
Stratford, CT 06615
|
1,483 sq. feet
|
2 baths 3 beds |
show details | |

|
#15
Seminole Ln
Stratford, CT 06614
|
1,454 sq. feet
|
2 baths 1 beds |
show details | |

|
#16
Nichols Ave
Stratford, CT 06614
|
1,373 sq. feet
|
1 baths 3 beds |
show details | |

|
#17
Stratford Rd
Stratford, CT 06615
|
2,106 sq. feet
|
2 baths 3 beds |
show details | |

|
#18
Canary Pl
Stratford, CT 06614
|
1,171 sq. feet
|
1 baths 3 beds |
show details | |

|
#19
Drome Ave
Stratford, CT 06615
|
1,382 sq. feet
|
1 baths 3 beds |
show details | |

|
#20
Henry Ave
Stratford, CT 06614
|
1,363 sq. feet
|
1 baths 3 beds |
show details |
| Photo | Address | Area | Beds / Baths | Price | Details |
|---|---|---|---|---|---|

|
#21
Knowlton St
Stratford, CT 06615
|
1,135 sq. feet
|
2 baths 3 beds |
show details | |

|
#22
Briarfield Dr
Stratford, CT 06614
|
1,423 sq. feet
|
1 baths 4 beds |
show details | |

|
#23
High Park Ave
Stratford, CT 06615
|
1,191 sq. feet
|
1 baths 3 beds |
show details | |

|
#24
Barnum Ave
Stratford, CT 06615
|
3,263 sq. feet
|
3 baths 5 beds |
show details | |

|
#25
Fernwood Dr
Stratford, CT 06614
|
1,300 sq. feet
|
1 baths 3 beds |
show details | |

|
#26
Denton Pl
Stratford, CT 06614
|
1,276 sq. feet
|
1 baths 3 beds |
show details | |

|
#27
Guzzi Dr
Stratford, CT 06615
|
1,040 sq. feet
|
1 baths 3 beds |
show details | |

|
#28
Silver Ln
Stratford, CT 06614
|
1,080 sq. feet
|
2 baths 3 beds |
show details | |

|
#29
Goldbach Dr
Stratford, CT 06614
|
1,318 sq. feet
|
1 baths 3 beds |
show details | |

|
#30
Sun Ridge Ln
Stratford, CT 06614
|
1,767 sq. feet
|
3 baths 3 beds |
show details |
| Photo | Address | Area | Beds / Baths | Price | Details |
|---|---|---|---|---|---|

|
#31
Perry Ln
Stratford, CT 06614
|
2,637 sq. feet
|
2 baths 4 beds |
show details | |

|
#32
Boswell St
Stratford, CT 06615
|
1,887 sq. feet
|
2 baths 4 beds |
show details | |

|
#33
Lawlor Ter
Stratford, CT 06614
|
1,682 sq. feet
|
1 baths 3 beds |
show details | |

|
#34
Greenfield Ave
Stratford, CT 06614
|
1,272 sq. feet
|
2 baths 3 beds |
show details | |

|
#35
Swanson Ave
Stratford, CT 06614
|
1,386 sq. feet
|
1 baths 3 beds |
show details | |

|
#36
Riverdale Dr
Stratford, CT 06615
|
1,426 sq. feet
|
2 baths 3 beds |
show details | |

|
#37
Franklin Ave
Stratford, CT 06614
|
1,707 sq. feet
|
1 baths 4 beds |
show details | |

|
#38
Warwick Ave
Stratford, CT 06615
|
- sq. feet
|
- baths - beds |
show details | |

|
#39
Sherwood Pl Apt D10
Stratford, CT 06615
|
- sq. feet
|
- baths - beds |
show details | |

|
#40
Penny Meadow Ln Unit D
Stratford, CT 06614
|
- sq. feet
|
- baths - beds |
show details |
| Photo | Address | Area | Beds / Baths | Price | Details |
|---|---|---|---|---|---|

|
#41
Burritt Ave # A1
Stratford, CT 06615
|
- sq. feet
|
- baths - beds |
show details | |

|
#42
Avon St
Stratford, CT 06615
|
- sq. feet
|
- baths - beds |
show details | |

|
#43
Gregory Cir
Stratford, CT 06615
|
- sq. feet
|
- baths - beds |
show details | |

|
#44
Philo St
Stratford, CT 06615
|
- sq. feet
|
- baths - beds |
show details | |

|
#45
Happy Hollow Cir, Unit C
Stratford, CT 06614
|
- sq. feet
|
- baths - beds |
show details | |

|
#46
Success Ave
Stratford, CT 06614
|
- sq. feet
|
- baths - beds |
show details | |

|
Check over 1 million property listings on Foreclosure.com!
|
browse all offers | |||


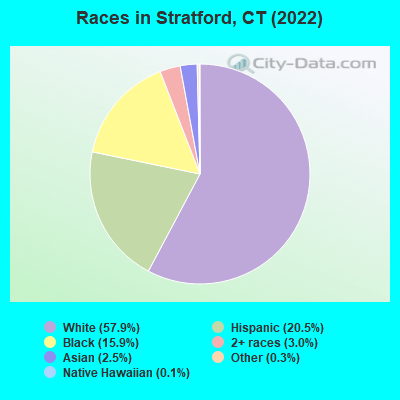
- 30,42157.9%White alone
- 10,74520.5%Hispanic
- 8,33915.9%Black alone
- 1,5783.0%Two or more races
- 1,3352.5%Asian alone
- 1830.3%Other race alone
- 760.1%Native Hawaiian and Other
Pacific Islander alone - 280.05%American Indian alone
Races in Stratford detailed stats: ancestries, foreign born residents, place of birth
According to our research of Connecticut and other state lists, there were 37 registered sex offenders living in Stratford, Connecticut as of May 14, 2024.
The ratio of all residents to sex offenders in Stratford is 1,417 to 1.
The ratio of registered sex offenders to all residents in this city is lower than the state average.
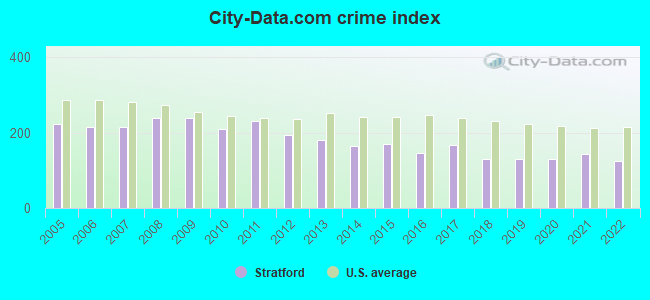
The City-Data.com crime index weighs serious crimes and violent crimes more heavily. Higher means more crime, U.S. average is 246.1. It adjusts for the number of visitors and daily workers commuting into cities.
- means the value is smaller than the state average.- means the value is about the same as the state average.
- means the value is bigger than the state average.
Crime rate in Stratford detailed stats: murders, rapes, robberies, assaults, burglaries, thefts, arson
Full-time law enforcement employees in 2021, including police officers: 109 (103 officers - 88 male; 15 female).
| Officers per 1,000 residents here: | 1.99 |
| Connecticut average: | 2.10 |
 Recent articles from our blog. Our writers, many of them Ph.D. graduates or candidates, create easy-to-read articles on a wide variety of topics.


Latest news from Stratford, CT collected exclusively by city-data.com from local newspapers, TV, and radio stations
Stratford, CT City Guides:
Ancestries: Italian (13.5%), Irish (7.9%), American (5.0%), Polish (4.3%), Jamaican (3.7%), African (2.5%).
Current Local Time: EST time zone
Incorporated in 1639
Elevation: 42 feet
Land area: 17.6 square miles.
Population density: 2,922 people per square mile (average).
7,544 residents are foreign born (8.4% Latin America, 2.8% Europe, 2.0% Asia).
| This place: | 14.3% |
| Connecticut: | 100.0% |
Median real estate property taxes paid for housing units with mortgages in 2022: $7,357 (2.3%)
Median real estate property taxes paid for housing units with no mortgage in 2022: $7,062 (2.2%)
Nearest city with pop. 50,000+: Bridgeport, CT  (3.3 miles , pop. 139,529).
Nearest city with pop. 200,000+: North Hempstead, NY (40.4 miles , pop. 222,611).
Nearest city with pop. 1,000,000+: Bronx, NY (45.7 miles , pop. 1,332,650).
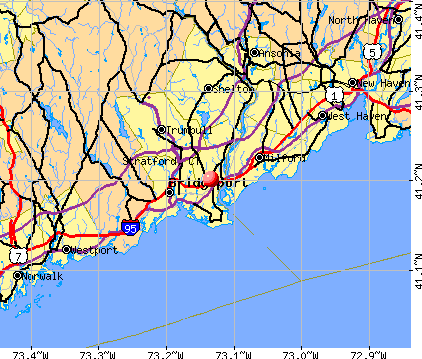
Nearest cities:
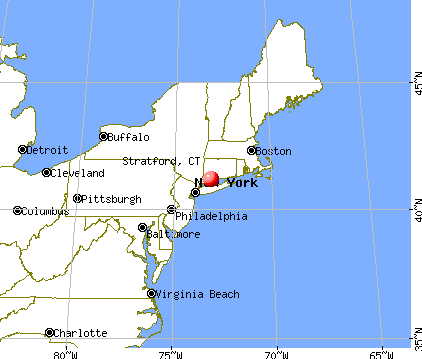
), Latitude: 41.20 N, Longitude: 73.13 W
Daytime population change due to commuting: -477 (-0.9%)
Workers who live and work in this place: 7,254 (26.6%)
Area code commonly used in this area: 203
Stratford, Connecticut accommodation & food services, waste management - Economy and Business Data
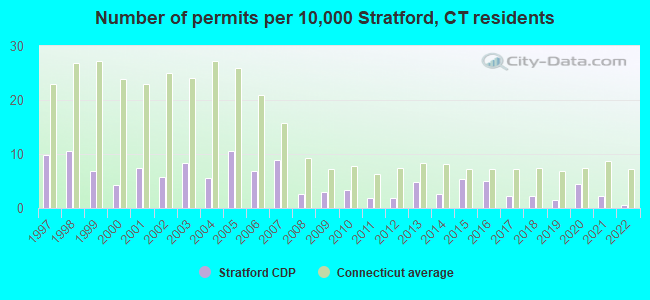
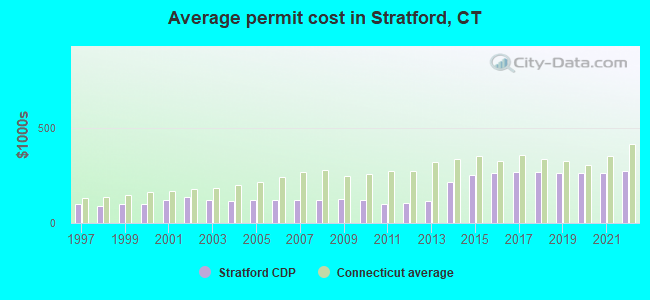
Single-family new house construction building permits:
- 2022: 3 buildings, average cost: $276,300
- 2021: 11 buildings, average cost: $263,700
- 2020: 22 buildings, average cost: $265,000
- 2019: 7 buildings, average cost: $264,600
- 2018: 11 buildings, average cost: $266,400
- 2017: 11 buildings, average cost: $266,200
- 2016: 25 buildings, average cost: $260,800
- 2015: 27 buildings, average cost: $255,400
- 2014: 13 buildings, average cost: $214,800
- 2013: 24 buildings, average cost: $114,000
- 2012: 9 buildings, average cost: $105,200
- 2011: 9 buildings, average cost: $102,200
- 2010: 17 buildings, average cost: $120,400
- 2009: 15 buildings, average cost: $126,300
- 2008: 13 buildings, average cost: $120,400
- 2007: 44 buildings, average cost: $122,800
- 2006: 34 buildings, average cost: $118,700
- 2005: 53 buildings, average cost: $120,000
- 2004: 28 buildings, average cost: $115,600
- 2003: 42 buildings, average cost: $119,700
- 2002: 29 buildings, average cost: $135,800
- 2001: 37 buildings, average cost: $118,600
- 2000: 21 buildings, average cost: $101,500
- 1999: 34 buildings, average cost: $99,100
- 1998: 53 buildings, average cost: $91,300
- 1997: 49 buildings, average cost: $98,200
| Here: | 4.0% |
| Connecticut: | 3.9% |
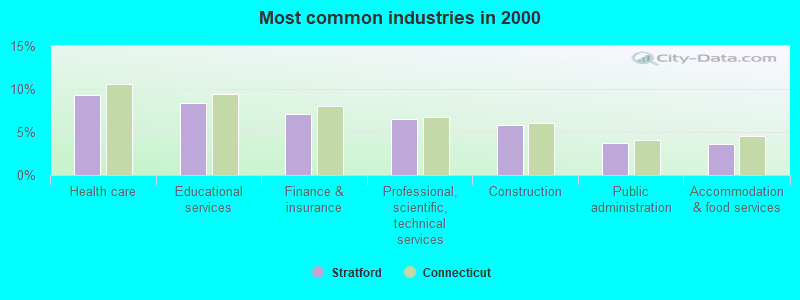
- Health care (9.3%)
- Educational services (8.4%)
- Finance & insurance (7.1%)
- Professional, scientific, technical services (6.6%)
- Construction (5.8%)
- Public administration (3.8%)
- Accommodation & food services (3.6%)
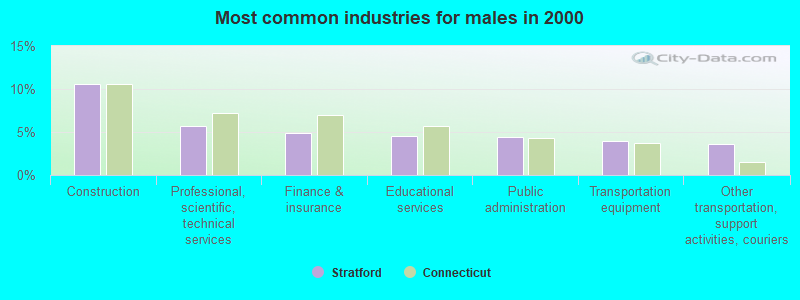
- Construction (10.6%)
- Professional, scientific, technical services (5.7%)
- Finance & insurance (4.8%)
- Educational services (4.5%)
- Public administration (4.4%)
- Transportation equipment (3.9%)
- Other transportation, support activities, couriers (3.6%)

- Health care (15.2%)
- Educational services (12.4%)
- Finance & insurance (9.5%)
- Professional, scientific, technical services (7.4%)
- Accommodation & food services (3.9%)
- Administrative & support & waste management services (3.2%)
- Public administration (3.1%)
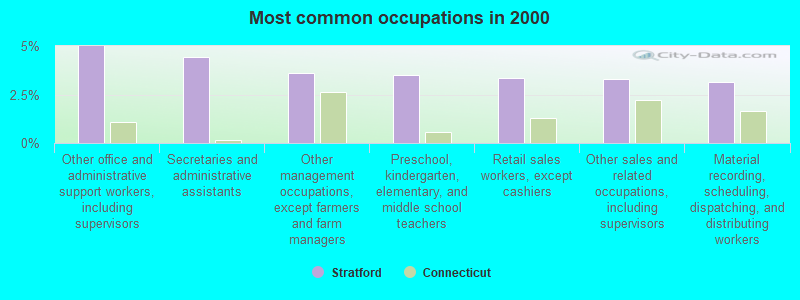
- Other office and administrative support workers, including supervisors (5.0%)
- Secretaries and administrative assistants (4.5%)
- Other management occupations, except farmers and farm managers (3.6%)
- Preschool, kindergarten, elementary, and middle school teachers (3.5%)
- Retail sales workers, except cashiers (3.3%)
- Other sales and related occupations, including supervisors (3.3%)
- Material recording, scheduling, dispatching, and distributing workers (3.2%)
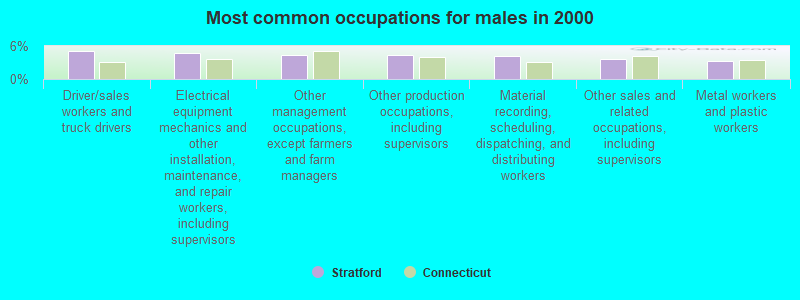
- Driver/sales workers and truck drivers (5.1%)
- Electrical equipment mechanics and other installation, maintenance, and repair workers, including supervisors (4.7%)
- Other management occupations, except farmers and farm managers (4.4%)
- Other production occupations, including supervisors (4.3%)
- Material recording, scheduling, dispatching, and distributing workers (4.2%)
- Other sales and related occupations, including supervisors (3.6%)
- Metal workers and plastic workers (3.2%)
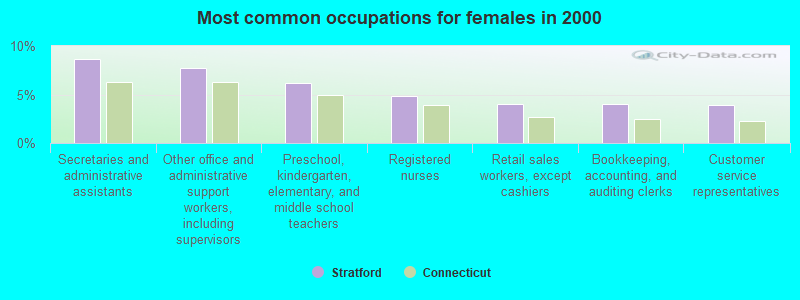
- Secretaries and administrative assistants (8.7%)
- Other office and administrative support workers, including supervisors (7.7%)
- Preschool, kindergarten, elementary, and middle school teachers (6.2%)
- Registered nurses (4.9%)
- Retail sales workers, except cashiers (4.1%)
- Bookkeeping, accounting, and auditing clerks (4.0%)
- Customer service representatives (3.9%)
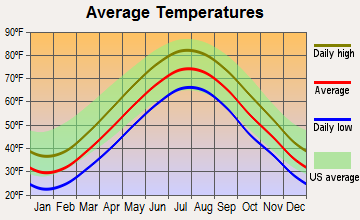
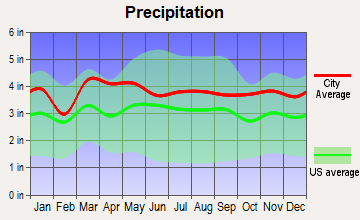
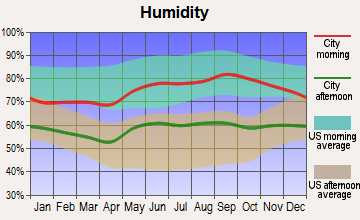
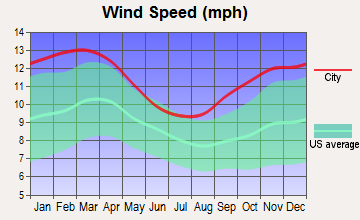
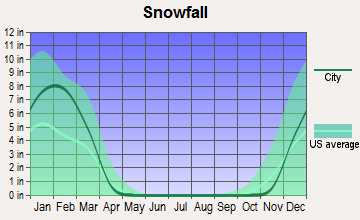
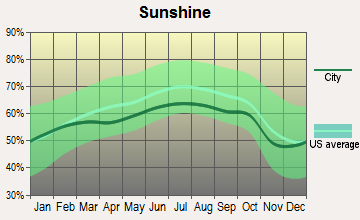
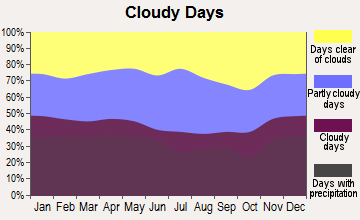
Average climate in Stratford, Connecticut
Based on data reported by over 4,000 weather stations
(lower is better)
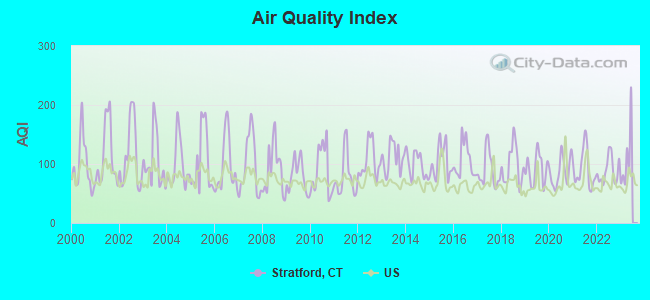
Air Quality Index (AQI) level in 2022 was 88.6. This is worse than average.
| City: | 88.6 |
| U.S.: | 72.6 |

Carbon Monoxide (CO) [ppm] level in 2022 was 0.223. This is about average. Closest monitor was 2.4 miles away from the city center.
| City: | 0.223 |
| U.S.: | 0.251 |
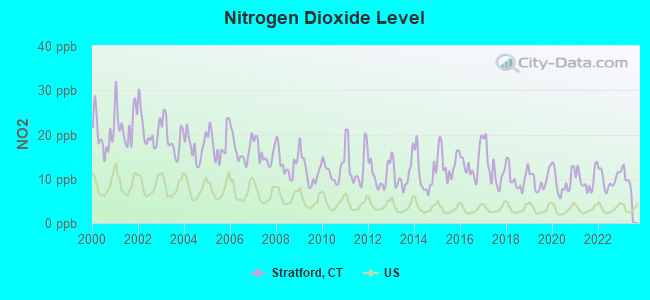
Nitrogen Dioxide (NO2) [ppb] level in 2022 was 9.79. This is significantly worse than average. Closest monitor was 0.3 miles away from the city center.
| City: | 9.79 |
| U.S.: | 5.11 |

Sulfur Dioxide (SO2) [ppb] level in 2022 was 0.220. This is significantly better than average. Closest monitor was 0.3 miles away from the city center.
| City: | 0.220 |
| U.S.: | 1.515 |

Ozone [ppb] level in 2022 was 30.1. This is about average. Closest monitor was 2.4 miles away from the city center.
| City: | 30.1 |
| U.S.: | 33.3 |

Particulate Matter (PM10) [µg/m3] level in 2022 was 14.8. This is better than average. Closest monitor was 1.8 miles away from the city center.
| City: | 14.8 |
| U.S.: | 19.2 |
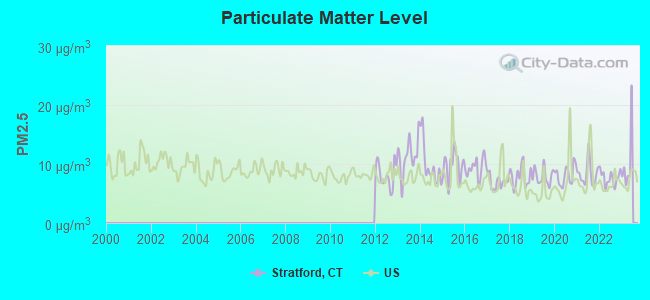
Particulate Matter (PM2.5) [µg/m3] level in 2022 was 7.63. This is about average. Closest monitor was 3.1 miles away from the city center.
| City: | 7.63 |
| U.S.: | 8.11 |
Tornado activity:
Stratford-area historical tornado activity is slightly below Connecticut state average. It is 41% smaller than the overall U.S. average.
On 7/10/1989, a category F4 (max. wind speeds 207-260 mph) tornado 13.8 miles away from the Stratford place center injured 40 people and caused between $50,000,000 and $500,000,000 in damages.
On 5/24/1962, a category F3 (max. wind speeds 158-206 mph) tornado 24.1 miles away from the place center killed one person and injured 50 people and caused between $500,000 and $5,000,000 in damages.
Earthquake activity:
Stratford-area historical earthquake activity is significantly above Connecticut state average. It is 70% smaller than the overall U.S. average.On 10/7/1983 at 10:18:46, a magnitude 5.3 (5.1 MB, 5.3 LG, 5.1 ML, Class: Moderate, Intensity: VI - VII) earthquake occurred 200.0 miles away from the city center
On 4/20/2002 at 10:50:47, a magnitude 5.3 (5.3 ML, Depth: 3.0 mi) earthquake occurred 230.8 miles away from Stratford center
On 4/20/2002 at 10:50:47, a magnitude 5.2 (5.2 MB, 4.2 MS, 5.2 MW, 5.0 MW) earthquake occurred 229.2 miles away from Stratford center
On 8/23/2011 at 17:51:04, a magnitude 5.8 (5.8 MW, Depth: 3.7 mi) earthquake occurred 342.6 miles away from Stratford center
On 1/19/1982 at 00:14:42, a magnitude 4.7 (4.5 MB, 4.7 MD, 4.5 LG, Class: Light, Intensity: IV - V) earthquake occurred 177.3 miles away from Stratford center
On 1/16/1994 at 01:49:16, a magnitude 4.6 (4.6 MB, 4.6 LG, Depth: 3.1 mi) earthquake occurred 163.6 miles away from the city center
Magnitude types: regional Lg-wave magnitude (LG), body-wave magnitude (MB), duration magnitude (MD), local magnitude (ML), surface-wave magnitude (MS), moment magnitude (MW)
Natural disasters:
The number of natural disasters in Fairfield County (24) is greater than the US average (15).Major Disasters (Presidential) Declared: 13
Emergencies Declared: 11
Causes of natural disasters: Storms: 6, Floods: 5, Hurricanes: 5, Snowstorms: 4, Blizzards: 3, Snows: 3, Winter Storms: 3, Tropical Storms: 2, Snowfall: 1, Wind: 1 (Note: some incidents may be assigned to more than one category).

Hospitals and medical centers in Stratford:
Heliports located in Stratford:
Amtrak stations near Stratford:
- 4 miles: BRIDGEPORT (525 WATER ST.) . Services: fully wheelchair accessible, enclosed waiting area, public restrooms, public payphones, snack bar, paid short-term parking, paid long-term parking, call for car rental service, taxi stand, intercity bus service, public transit connection.
- 13 miles: NEW HAVEN (50 UNION AVE.) . Services: ticket office, partially wheelchair accessible, enclosed waiting area, public restrooms, public payphones, snack bar, ATM, paid short-term parking, paid long-term parking, car rental agency, taxi stand, intercity bus service, public transit connection.
Colleges/Universities in Stratford:
- Porter and Chester Institute of Stratford (Full-time enrollment: 2,822; Location: 670 Lordship Blvd; Private, for-profit; Website: www.porterchester.com)
- Stratford School of Aviation Maintenance Technicians (Full-time enrollment: 41; Location: 200 Great Meadows Rd; Public; Website: www.cttech.org/ssamt/index.htm)
Other colleges/universities with over 2000 students near Stratford:
- Housatonic Community College (about 4 miles; Bridgeport, CT; Full-time enrollment: 3,677)
- University of Bridgeport (about 4 miles; Bridgeport, CT; FT enrollment: 3,708)
- Sacred Heart University (about 6 miles; Fairfield, CT; FT enrollment: 5,650)
- Fairfield University (about 8 miles; Fairfield, CT; FT enrollment: 4,640)
- University of New Haven (about 11 miles; West Haven, CT; FT enrollment: 6,205)
- Gateway Community College (about 13 miles; New Haven, CT; FT enrollment: 4,672)
- Yale University (about 14 miles; New Haven, CT; FT enrollment: 13,121)
Public high schools in Stratford:
- BUNNELL HIGH SCHOOL (Students: 1,102, Location: ONE BULLDOG BOULEVARD, Grades: 9-12)
- STRATFORD HIGH SCHOOL (Students: 721, Location: 45 NORTH PARADE, Grades: 9-12)
- STRIVE (Location: 55 SUTTON AVE, Grades: 12)
- HIGH SCHOOL SAILS (Location: 1 BULLDOG BLVD, Grades: 9-12)
- ALPHA (Location: 468 BIRDSEYE STREET, Grades: 9-12)
- HIGH SCHOOL STEPS 9-12 (Location: 468 BIRDSEYE STREET, Grades: 10-11)
- INTENSIVE NEED CLASSROOM (Location: 490 CHAPEL STREET, Grades: 9-12)
Private high school in Stratford:
- CENTER SCHOOL (Students: 22, Location: 55 SUTTON AVE, Grades: 1-12)
Biggest public elementary/middle schools in Stratford:
- SECOND HILL LANE SCHOOL (Students: 794, Location: 65 SECOND HILL LANE, Grades: PK-6)
- HARRY B. FLOOD MIDDLE SCHOOL (Students: 677, Location: 490 CHAPEL STREET, Grades: 7-8)
- ELI WHITNEY SCHOOL (Students: 602, Location: 1130 HUNTINGTON ROAD, Grades: KG-6)
- CHAPEL SCHOOL (Students: 544, Location: 380 CHAPEL STREET, Grades: KG-6)
- DAVID WOOSTER MIDDLE SCHOOL (Students: 486, Location: 150 LINCOLN STREET, Grades: 7-8)
- NICHOLS SCHOOL (Students: 453, Location: 396 NICHOLS AVENUE, Grades: KG-6)
- WILCOXSON SCHOOL (Students: 449, Location: 600 WILCOXSON AVENUE, Grades: KG-6)
- FRANKLIN SCHOOL (Students: 420, Location: 1895 BARNUM AVENUE, Grades: PK-6)
- LORDSHIP SCHOOL (Students: 260, Location: 254 CROWN STREET, Grades: KG-6)
- STRATFORD ACADEMY - JOHNSON HOUSE (Location: 719 BIRDSEYE STREET, Grades: PK-6)
Private elementary/middle schools in Stratford:
Points of interest:
Notable locations in Stratford: Three Thousand Three Hundred and Fifty Five Shopping Plaza (A), Stratford Station (B), Short Beach Golf Course (C), Pootatuck Yacht Club (D), Oronoque Village Country Club (E), Housatonic Boat Club (F), Mill River Country Club (G), Bonds Dock (H), Catharine B Mitchell Museum (I), Boothe Memorial Museum (J), Stratford Library Association (K), Stratford Historical Society Library (L), Stratford Historical Society Building (M), Red Cross Headquarters (N), Stratford Emergency Medical Services (O), Sikorsky Aircraft Fire Department (P), Stratford Fire Department Station 4 (Q), Stratford Fire Department Station 3 (R), Stratford Fire Department Station 2 (S), Stratford Fire Department Station 1 Headquarters (T). Display/hide their locations on the map
Shopping Centers: The Dock Shopping Center (1), Academy Hill Square Shopping Center (2). Display/hide their locations on the map
Churches in Stratford include: Bethany Church (A), Advent Christian Church (B), Bethany Alliance Church (C), Christian Assembly Church (D), Evangelical Assembly of God Church (E), First Congregational Church (F), Christ Church (G), Kingdom Hall of Jehovahs Witnesses (H), Lordship Community Church (I). Display/hide their locations on the map
Cemeteries: Boothe Memorial Park (1), Saint Johns Cemetery (2), Saint Michaels Cemetery (3), Union Cemetery (4), Christ Church Cemetery (5), Old Congregational Burying Ground (6). Display/hide their locations on the map
Lakes, reservoirs, and swamps: Cooks Pond (A), Frash Pond (B), Selby Pond (C), Motil Pond (D), Pecks Mill Pond (E), Beaver Dam Lake (F), Brewsters Pond (G), Beaver Dam Lake (H). Display/hide their locations on the map
Streams, rivers, and creeks: Long Brook (A), Freeman Brook (B), Pumpkin Ground Brook (C), Raven Stream (D), Bruce Brook (E), Cemetery Pond Brook (F), Ferry Creek (G). Display/hide their locations on the map
Parks in Stratford include: Yeomans Park and Athletic Field (1), YMCA Park (2), Wooster Park (3), Clover Field (4), High Park (5), Long Brook Park (6), North End Park (7), Low Park (8), Paradise Green Park (9). Display/hide their locations on the map
Beach: Lordship Beach (A). Display/hide its location on the map
Tourist attractions: Judson House (Museums; 967 Academy Hill Road) (1), Rotary Travel (Ski & Helicopter Tours; 300 Ferry Boulevard Suite 1) (2), Stratford Historical Society Inc (Cultural Attractions- Events- & Facilities; 967 Academy Hill Road) (3), Marnicks Restaurant & Motel (10 Washington Parkway) (4), Bavarian Tours America (Tours & Charters; 1341 West Broad Street) (5). Display/hide their approximate locations on the map
Hotels: New Stratford Motor Inn (2200 Stratford Avenue) (1), Ramada Inn (225 Lordship Boulevard) (2), Homewood Suites by Hilton (6905 Main Street) (3), Honeyspot Motor Inn - HOJO Inn by Howard Johnson (360 Honeyspot Road) (4), Camelot Motel (1500 South Avenue) (5), Marnicks Restaurant & Motel (10 Washington Parkway) (6). Display/hide their approximate locations on the map
Court: Stratford Town - Administrative Departments- Town Hall- Probate Court (468 Birdseye Street) (1). Display/hide its approximate location on the map
Birthplace of: Javier Colon - Rhythm and blues singer, Tom Penders - Baseball player, David Hawley - Continental Navy officer and privateer in the Revolutionary War, David Wooster - General of the Continental Army, Jaime Sifers - Ice hockey player, William Samuel Johnson - Politician, Andrew Adams (congressman) - Politician, Gideon Tomlinson - Politician, Jeff Kalapos - College basketball player (Rhode Island Rams), Marcus Easley - Football player.
| This place: | 2.5 people |
| Connecticut: | 2.5 people |
| This place: | 67.7% |
| Whole state: | 66.3% |
| This place: | 5.9% |
| Whole state: | 6.6% |
Likely homosexual households (counted as self-reported same-sex unmarried-partner households)
- Lesbian couples: 0.6% of all households
- Gay men: 0.3% of all households
People in group quarters in Stratford in 2010:
- 283 people in nursing facilities/skilled-nursing facilities
- 53 people in group homes intended for adults
- 5 people in group homes for juveniles (non-correctional)
- 3 people in residential treatment centers for juveniles (non-correctional)
People in group quarters in Stratford in 2000:
- 307 people in nursing homes
- 53 people in other nonhousehold living situations
- 6 people in homes for the mentally retarded
Banks with most branches in Stratford (2011 data):
- People's United Bank: Ryder's Landing Branch, Stratford Branch, Paradise Green Branch, The Dock Stop And Shop Branch. Info updated 2012/02/16: Bank assets: $27,319.3 mil, Deposits: $20,835.4 mil, headquarters in Bridgeport, CT, positive income, Commercial Lending Specialization, 374 total offices
- Bank of America, National Association: Dock Branch at 955 Ferry Boulevard, branch established on 1972/11/04; Stratford Branch at 2944 Main Street, branch established on 1959/06/19. Info updated 2009/11/18: Bank assets: $1,451,969.3 mil, Deposits: $1,077,176.8 mil, headquarters in Charlotte, NC, positive income, 5782 total offices, Holding Company: Bank Of America Corporation
- The Milford Bank: Barnum Avenue Stratford Branch at 250 Barnum Avenue, branch established on 2011/10/05; Stratford Branch at 2366 Main Street, branch established on 2007/03/19. Info updated 2006/11/03: Bank assets: $371.8 mil, Deposits: $326.3 mil, headquarters in Milford, CT, positive income, Commercial Lending Specialization, 9 total offices
- JPMorgan Chase Bank, National Association: Barnum Avenue Branch at 2855 Main Street, branch established on 1959/08/06; Paradise Green Branch at 3226 Main Street, branch established on 1964/08/22. Info updated 2011/11/10: Bank assets: $1,811,678.0 mil, Deposits: $1,190,738.0 mil, headquarters in Columbus, OH, positive income, International Specialization, 5577 total offices, Holding Company: Jpmorgan Chase & Co.
- Webster Bank, National Association: Stratford Branch at 450 Barnum Avenue, branch established on 2005/12/12. Info updated 2008/12/23: Bank assets: $18,674.3 mil, Deposits: $13,861.5 mil, headquarters in Waterbury, CT, positive income, Commercial Lending Specialization, 167 total offices, Holding Company: Webster Financial Corporation
- Hudson Valley Bank, National Association: Stratford Branch at 2505 Main Street, branch established on 2009/10/06. Info updated 2012/03/13: Bank assets: $2,794.2 mil, Deposits: $2,433.4 mil, headquarters in Stamford, CT, negative income in the last year, Commercial Lending Specialization, 36 total offices, Holding Company: Hudson Valley Holding Corp.
- Citibank, National Association: Stratford Branch at 955 Ferry Blvd., branch established on 2007/07/20. Info updated 2012/01/10: Bank assets: $1,288,658.0 mil, Deposits: $882,541.0 mil, headquarters in Sioux Falls, SD, positive income, International Specialization, 1048 total offices, Holding Company: Citigroup Inc.
- TD Bank, National Association: Stratford Branch at 951 Stratford Avenue, branch established on 1984/02/25. Info updated 2010/10/04: Bank assets: $188,912.6 mil, Deposits: $153,149.8 mil, headquarters in Wilmington, DE, positive income, 1314 total offices, Holding Company: Toronto-Dominion Bank, The
- First Niagara Bank, National Association: Stratford Branch at 225 Hawley Lane, branch established on 2008/02/25. Info updated 2011/06/09: Bank assets: $32,750.6 mil, Deposits: $19,595.4 mil, headquarters in Buffalo, NY, positive income, Commercial Lending Specialization, 351 total offices, Holding Company: First Niagara Financial Group, Inc.
For population 15 years and over in Stratford:
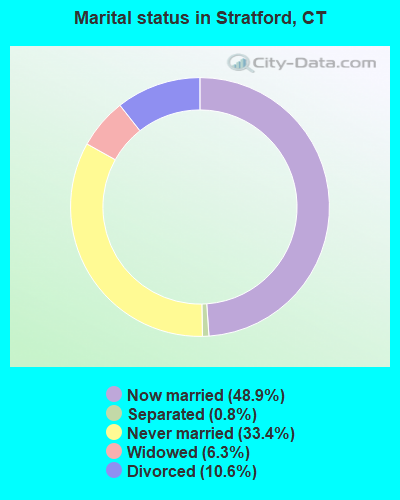
- Never married: 33.4%
- Now married: 48.9%
- Separated: 0.8%
- Widowed: 6.3%
- Divorced: 10.6%
For population 25 years and over in Stratford:
- High school or higher: 91.2%
- Bachelor's degree or higher: 33.2%
- Graduate or professional degree: 13.5%
- Unemployed: 4.1%
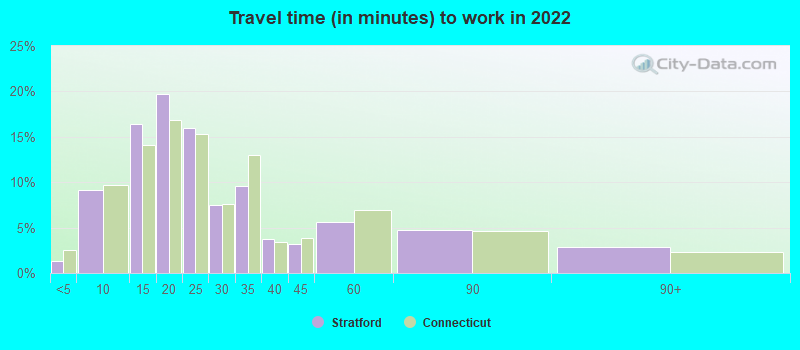
- Mean travel time to work (commute): 26.4 minutes

| Here: | 12.3 |
| Connecticut average: | 12.6 |
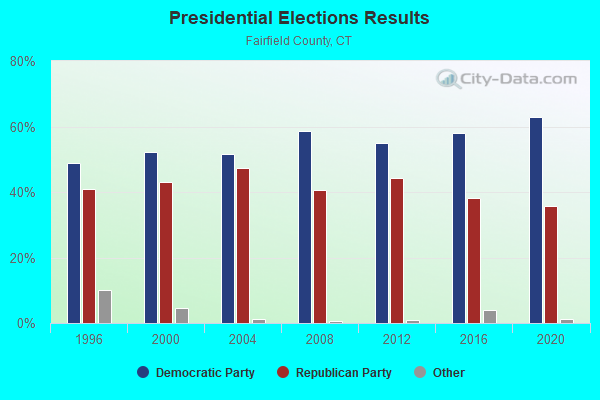
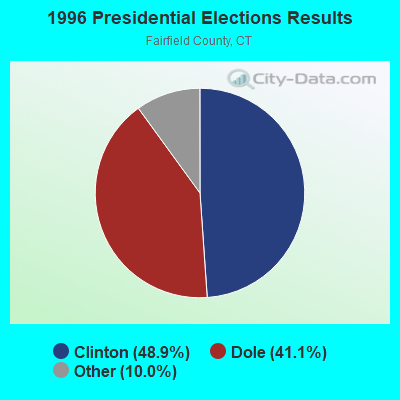
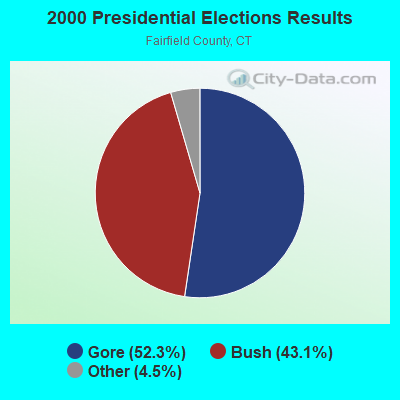
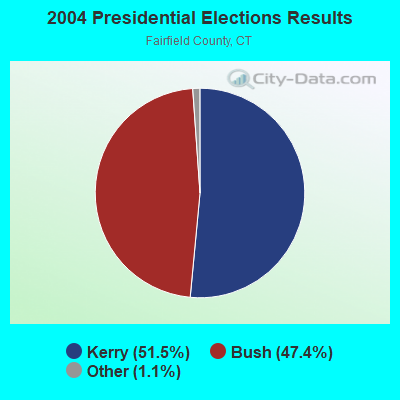
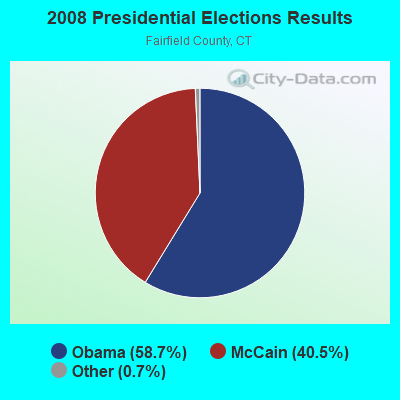
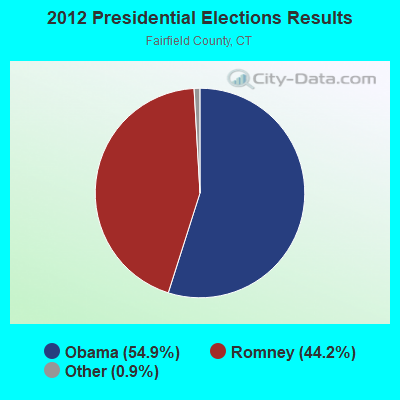
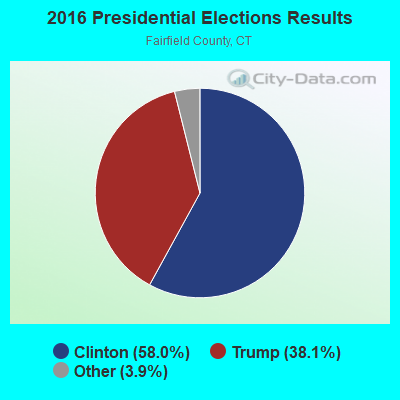
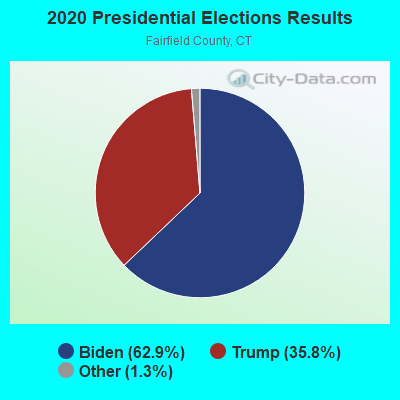
Graphs represent county-level data. Detailed 2008 Election Results
Neighborhoods in Stratford:
(Stratford, Connecticut Neighborhood Map)Religion statistics for Stratford, CT (based on Fairfield County data)
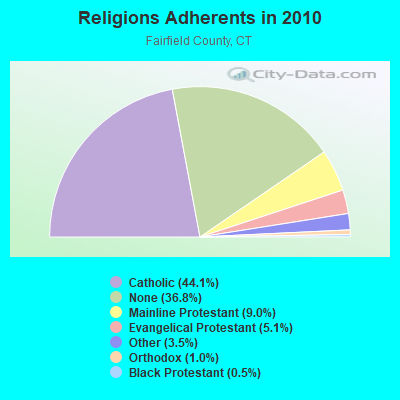
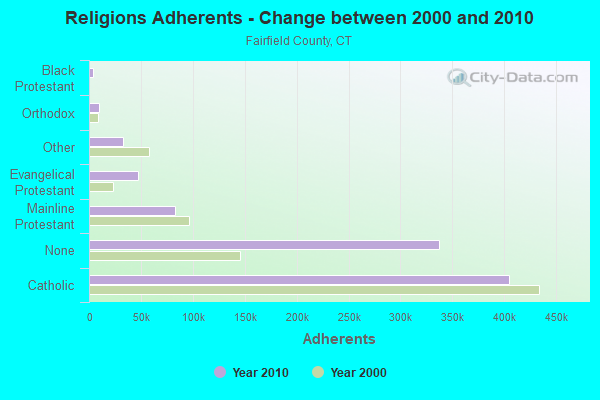
| Religion | Adherents | Congregations |
|---|---|---|
| Catholic | 404,341 | 94 |
| Mainline Protestant | 82,604 | 175 |
| Evangelical Protestant | 46,888 | 242 |
| Other | 32,501 | 95 |
| Orthodox | 9,215 | 21 |
| Black Protestant | 4,144 | 27 |
| None | 337,136 | - |
Food Environment Statistics:
| Here: | 2.50 / 10,000 pop. |
| State: | 2.21 / 10,000 pop. |
| This county: | 0.06 / 10,000 pop. |
| Connecticut: | 0.07 / 10,000 pop. |
| Fairfield County: | 0.85 / 10,000 pop. |
| Connecticut: | 1.02 / 10,000 pop. |
| Fairfield County: | 1.70 / 10,000 pop. |
| State: | 2.27 / 10,000 pop. |
| Fairfield County: | 9.67 / 10,000 pop. |
| Connecticut: | 9.19 / 10,000 pop. |
| Fairfield County: | 6.5% |
| Connecticut: | 7.3% |
| Here: | 17.9% |
| Connecticut: | 21.5% |
| Fairfield County: | 17.2% |
| Connecticut: | 15.8% |
Health and Nutrition:
| Here: | 51.7% |
| Connecticut: | 50.0% |
| Stratford: | 49.2% |
| Connecticut: | 47.5% |
| This city: | 28.7 |
| State: | 28.7 |
| Stratford: | 20.2% |
| Connecticut: | 20.9% |
| This city: | 10.8% |
| Connecticut: | 10.5% |
| Stratford: | 6.9 |
| Connecticut: | 6.8 |
| Stratford: | 35.5% |
| Connecticut: | 34.2% |
| This city: | 57.1% |
| State: | 56.4% |
| Stratford: | 78.1% |
| Connecticut: | 78.9% |
More about Health and Nutrition of Stratford, CT Residents
5.92% of this county's 2021 resident taxpayers lived in other counties in 2020 ($194,373 average adjusted gross income)
| Here: | 5.92% |
| Connecticut average: | 5.79% |
0.01% of residents moved from foreign countries ($50 average AGI)
Fairfield County: 0.01% Connecticut average: 0.02%
Top counties from which taxpayers relocated into this county between 2020 and 2021:
| from Westchester County, NY | |
| from New York County, NY | |
| from New Haven County, CT |
6.13% of this county's 2020 resident taxpayers moved to other counties in 2021 ($174,109 average adjusted gross income)
| Here: | 6.13% |
| Connecticut average: | 5.82% |
0.01% of residents moved to foreign countries ($428 average AGI)
Fairfield County: 0.01% Connecticut average: 0.02%
Top counties to which taxpayers relocated from this county between 2020 and 2021:
| to New Haven County, CT | |
| to New York County, NY | |
| to Westchester County, NY |
| Businesses in Stratford, CT | ||||
| Name | Count | Name | Count | |
|---|---|---|---|---|
| 7-Eleven | 2 | La-Z-Boy | 1 | |
| AT&T | 1 | Little Caesars Pizza | 1 | |
| AutoZone | 1 | Marshalls | 1 | |
| Bally Total Fitness | 1 | MasterBrand Cabinets | 14 | |
| Blockbuster | 1 | McDonald's | 2 | |
| Burger King | 1 | New Balance | 1 | |
| Burlington Coat Factory | 1 | Payless | 1 | |
| CVS | 2 | Penske | 1 | |
| Comfort Suites | 1 | Quiznos | 1 | |
| Curves | 1 | Ramada | 1 | |
| DHL | 1 | Rite Aid | 1 | |
| Dairy Queen | 1 | Rodeway Inn | 1 | |
| Decora Cabinetry | 12 | Staples | 1 | |
| Domino's Pizza | 1 | Starbucks | 1 | |
| Dunkin Donuts | 8 | Stop & Shop | 1 | |
| Fashion Bug | 1 | UPS | 8 | |
| FedEx | 10 | Verizon Wireless | 1 | |
| Firestone Complete Auto Care | 1 | Volkswagen | 1 | |
| GameStop | 1 | Walgreens | 1 | |
| H&R Block | 2 | Walmart | 1 | |
| Home Depot | 1 | Wendy's | 1 | |
| KFC | 1 | YMCA | 1 | |
Strongest AM radio stations in Stratford:
- WFIF (1500 AM; daytime; 5 kW; MILFORD, CT)
- WICC (600 AM; 1 kW; BRIDGEPORT, CT; Owner: CUMULUS LICENSING CORP.)
- WDJZ (1530 AM; daytime; 5 kW; BRIDGEPORT, CT; Owner: PEOPLE'S BROADCAST NETWORK, LLC)
- WCUM (1450 AM; 1 kW; BRIDGEPORT, CT; Owner: RADIO CUMBRE BROADCASTING, INC.)
- WADS (690 AM; daytime; 3 kW; ANSONIA, CT; Owner: RADIO AMOR, INC.)
- WFAN (660 AM; 50 kW; NEW YORK, NY; Owner: INFINITY BROADCASTING OPERATIONS, INC.)
- WGSM (740 AM; 25 kW; HUNTINGTON, NY; Owner: K RADIO LICENSEE, INC.)
- WCBS (880 AM; 50 kW; NEW YORK, NY; Owner: INFINITY BROADCASTING OPERATIONS, INC.)
- WTIC (1080 AM; 50 kW; HARTFORD, CT; Owner: INFINITY RADIO OPERATIONS INC.)
- WMCA (570 AM; 50 kW; NEW YORK, NY; Owner: SALEM MEDIA OF NEW YORK, LLC)
- WABC (770 AM; 50 kW; NEW YORK, NY; Owner: WABC-AM RADIO, INC.)
- WELI (960 AM; 5 kW; NEW HAVEN, CT; Owner: CLEAR CHANNEL BROADCASTING LICENSES, INC.)
- WOR (710 AM; 50 kW; NEW YORK, NY; Owner: BUCKLEY BROADCASTING CORPORATION)
Strongest FM radio stations in Stratford:
- WEBE (107.9 FM; WESTPORT, CT; Owner: CUMULUS LICENSING CORP.)
- WEZN-FM (99.9 FM; BRIDGEPORT, CT; Owner: CXR HOLDINGS, INC.)
- WSHU-FM (91.1 FM; FAIRFIELD, CT; Owner: SACRED HEART UNIVERSITY, INC.)
- WPKN (89.5 FM; BRIDGEPORT, CT; Owner: WPKN, INC.)
- WMNR-FM1 (88.1 FM; HUNTINGTON, CT; Owner: MONROE BOARD OF EDUCATION)
- W220CF (91.9 FM; HUNTINGTON, CT; Owner: MONROE BOARD OF EDUCATION)
- WKCI-FM (101.3 FM; HAMDEN, CT; Owner: CLEAR CHANNEL BROADCASTING LICENSES, INC.)
- WPLR (99.1 FM; NEW HAVEN, CT; Owner: COX RADIO, INC.)
- WRXC (90.1 FM; SHELTON, CT; Owner: MONROE BOARD OF EDUCATION)
- WMNR (88.1 FM; MONROE, CT; Owner: MONROE BOARD OF EDUCATION)
- W285DE (104.9 FM; BRIDGEPORT, CT; Owner: DANBURY COMMUNITY RADIO, INC.)
- WYBC-FM (94.3 FM; NEW HAVEN, CT; Owner: YALE BROADCASTING CO., INC.)
- WALK-FM (97.5 FM; PATCHOGUE, NY; Owner: AMFM RADIO LICENSES, L.L.C.)
- WDAQ (98.3 FM; DANBURY, CT; Owner: BERKSHIRE BROADCASTING CORP.)
- WKSS (95.7 FM; HARTFORD-MERIDEN, CT; Owner: CAPSTAR TX LIMITED PARTNERSHIP)
- WWYZ (92.5 FM; WATERBURY, CT; Owner: CAPSTAR TX LIMITED PARTNERSHIP)
- WRCH (100.5 FM; NEW BRITAIN, CT; Owner: INFINITY RADIO OPERATIONS INC.)
- WZMX (93.7 FM; HARTFORD, CT; Owner: INFINITY RADIO OPERATIONS INC.)
- WHCN (105.9 FM; HARTFORD, CT; Owner: CAPSTAR TX LIMITED PARTNERSHIP)
- WMRQ (104.1 FM; WATERBURY, CT; Owner: CAPSTAR TX LIMITED PARTNERSHIP)
TV broadcast stations around Stratford:
- WEDW (Channel 49; BRIDGEPORT, CT; Owner: CONNECTICUT PUBLIC BROADCASTING, INC.)
- WTNH (Channel 8; NEW HAVEN, CT; Owner: WTNH BROADCASTING, INC.)
- WEDY (Channel 65; NEW HAVEN, CT; Owner: CONNECTICUT PUBLIC BROADCASTING, INC.)
- WCTX (Channel 59; NEW HAVEN, CT; Owner: WTNH BROADCASTING, INC.)
- WTIC-TV (Channel 61; HARTFORD, CT; Owner: TRIBUNE TELEVISION COMPANY)
- W11BJ (Channel 11; HARTFORD, CT; Owner: COMMUNICATIONS SITE MANAGEMENT LLC)
- WSAH (Channel 43; BRIDGEPORT, CT; Owner: WSAH LICENSE, INC.)
- W65DZ (Channel 65; BRIDGEPORT, CT; Owner: PAGING ASSOCIATES, INC.)
- WNYW (Channel 5; NEW YORK, NY; Owner: FOX TELEVISION STATIONS, INC.)
- WTXX (Channel 20; WATERBURY, CT; Owner: WTXX INC.)
- WFTY (Channel 67; SMITHTOWN, NY; Owner: UNIVISION NEW YORK LLC)
- WLNY (Channel 55; RIVERHEAD, NY; Owner: WLNY-TV, INC.)
- WVIT (Channel 30; NEW BRITAIN, CT; Owner: OUTLET BROADCASTING, INC)
- WEDH (Channel 24; HARTFORD, CT; Owner: CONNECTICUT PUBLIC BROADCASTING, INC.)
- W28AJ (Channel 28; ALLINGTOWN, CT; Owner: PAGING ASSOCIATES, INC.)
- WNJU (Channel 47; LINDEN, NJ; Owner: WNJU LICENSE CORPORATION)
- WUVN (Channel 18; HARTFORD, CT; Owner: ENTRAVISION HOLDINGS, LLC)
- WXNY-LP (Channel 32; NEW YORK, NY; Owner: ISLAND BROADCASTING COMPANY)
- National Bridge Inventory (NBI) Statistics
- 31Number of bridges
- 351ft / 107mTotal length
- 1,623,759Total average daily traffic
- 117,283Total average daily truck traffic
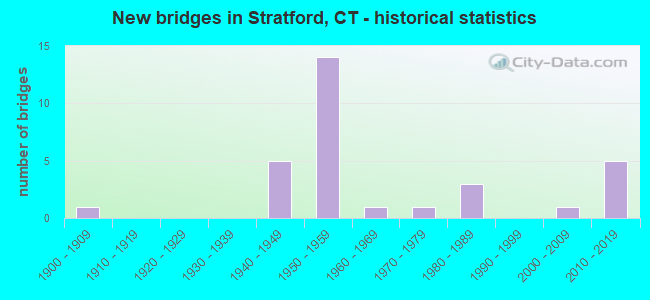
- New bridges - historical statistics
- 11900-1909
- 51940-1949
- 141950-1959
- 11960-1969
- 11970-1979
- 31980-1989
- 12000-2009
- 52010-2019
FCC Registered Broadcast Land Mobile Towers: 23 (See the full list of FCC Registered Broadcast Land Mobile Towers in Stratford, CT)
FCC Registered Microwave Towers: 6 (See the full list of FCC Registered Microwave Towers in this town)
FCC Registered Maritime Coast & Aviation Ground Towers: 21 (See the full list of FCC Registered Maritime Coast & Aviation Ground Towers)
FCC Registered Amateur Radio Licenses: 183 (See the full list of FCC Registered Amateur Radio Licenses in Stratford)
FAA Registered Aircraft Manufacturers and Dealers: 5 (See the full list of FAA Registered Manufacturers and Dealers in Stratford)
FAA Registered Aircraft: 125 (See the full list of FAA Registered Aircraft)
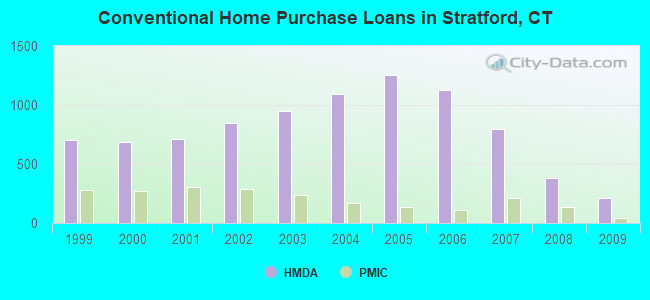
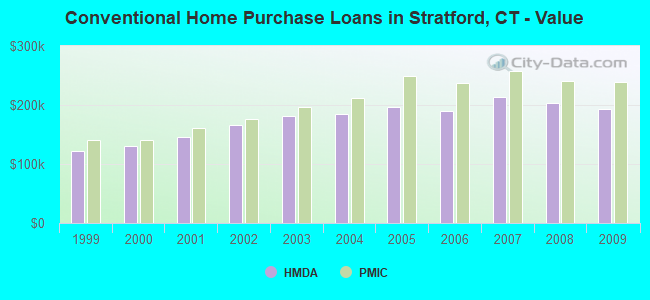
| Home Mortgage Disclosure Act Aggregated Statistics For Year 2009 (Based on 12 full tracts) | ||||||||||||||
| A) FHA, FSA/RHS & VA Home Purchase Loans | B) Conventional Home Purchase Loans | C) Refinancings | D) Home Improvement Loans | E) Loans on Dwellings For 5+ Families | F) Non-occupant Loans on < 5 Family Dwellings (A B C & D) | G) Loans On Manufactured Home Dwelling (A B C & D) | ||||||||
|---|---|---|---|---|---|---|---|---|---|---|---|---|---|---|
| Number | Average Value | Number | Average Value | Number | Average Value | Number | Average Value | Number | Average Value | Number | Average Value | Number | Average Value | |
| LOANS ORIGINATED | 277 | $224,791 | 213 | $194,033 | 971 | $213,859 | 52 | $90,500 | 0 | $0 | 36 | $191,639 | 0 | $0 |
| APPLICATIONS APPROVED, NOT ACCEPTED | 18 | $239,056 | 22 | $202,318 | 117 | $225,376 | 15 | $13,533 | 0 | $0 | 4 | $213,250 | 0 | $0 |
| APPLICATIONS DENIED | 59 | $202,305 | 38 | $175,579 | 403 | $231,682 | 42 | $68,690 | 1 | $483,000 | 22 | $164,136 | 1 | $5,000 |
| APPLICATIONS WITHDRAWN | 27 | $193,852 | 25 | $199,880 | 227 | $226,515 | 7 | $123,714 | 1 | $2,000,000 | 4 | $152,250 | 0 | $0 |
| FILES CLOSED FOR INCOMPLETENESS | 8 | $216,250 | 11 | $219,545 | 56 | $238,589 | 3 | $115,333 | 0 | $0 | 2 | $185,000 | 0 | $0 |
Detailed mortgage data for all 12 tracts in Stratford, CT
| Private Mortgage Insurance Companies Aggregated Statistics For Year 2009 (Based on 12 full tracts) | ||||
| A) Conventional Home Purchase Loans | B) Refinancings | |||
|---|---|---|---|---|
| Number | Average Value | Number | Average Value | |
| LOANS ORIGINATED | 41 | $238,366 | 13 | $310,846 |
| APPLICATIONS APPROVED, NOT ACCEPTED | 20 | $252,050 | 16 | $272,250 |
| APPLICATIONS DENIED | 6 | $244,333 | 8 | $274,375 |
| APPLICATIONS WITHDRAWN | 3 | $354,000 | 4 | $249,500 |
| FILES CLOSED FOR INCOMPLETENESS | 2 | $146,000 | 0 | $0 |
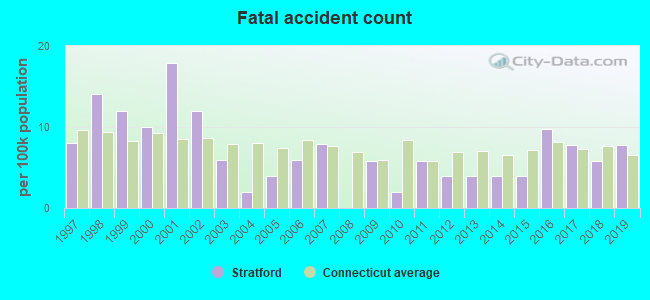
2002 - 2018 National Fire Incident Reporting System (NFIRS) incidents
- Fire incident types reported to NFIRS in Stratford, CT
- 1,04240.4%Structure Fires
- 93336.2%Outside Fires
- 44517.3%Mobile Property/Vehicle Fires
- 1586.1%Other
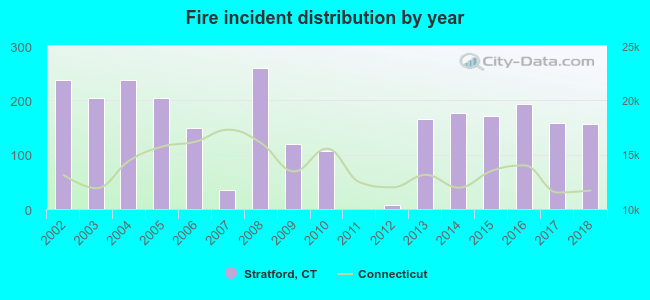 Based on the data from the years 2002 - 2018 the average number of fires per year is 152. The highest number of fires - 259 took place in 2008, and the least - 0 in 2011. The data has a dropping trend.
 When looking into fire subcategories, the most reports belonged to: Structure Fires (40.4%), and Outside Fires (36.2%).
Fire-safe hotels and motels in Stratford, Connecticut:
- Marnicks Rodeway Inn, 10 Washington Pkwy, Stratford, Connecticut 06615 , Phone: (203) 377-6288, Fax: (203) 378-3612
- Homewood Suites By Hilton, 6905 Main St, Stratford, Connecticut 06614 , Phone: (203) 377-3322, Fax: (203) 378-6677
- 225 Lordship Blvd, 225 Lordship Blvd, Stratford, Connecticut 06615 , Phone: (203) 375-8866, Fax: (203) 380-2728
- Quality Suites, 1500 South Ave, Stratford, Connecticut 06615 , Phone: (203) 375-9528, Fax: (203) 375-4028
| Most common first names in Stratford, CT among deceased individuals | ||
| Name | Count | Lived (average) |
|---|---|---|
| John | 798 | 74.9 years |
| Mary | 767 | 81.6 years |
| Joseph | 550 | 75.2 years |
| William | 478 | 74.4 years |
| Anna | 443 | 81.9 years |
| George | 362 | 75.3 years |
| Helen | 353 | 80.2 years |
| Michael | 284 | 74.4 years |
| Margaret | 277 | 79.8 years |
| Frank | 262 | 76.2 years |
| Most common last names in Stratford, CT among deceased individuals | ||
| Last name | Count | Lived (average) |
|---|---|---|
| Smith | 108 | 76.2 years |
| Johnson | 69 | 78.6 years |
| Brown | 45 | 76.8 years |
| Miller | 42 | 76.2 years |
| Williams | 37 | 71.9 years |
| Anderson | 36 | 77.4 years |
| Jones | 35 | 71.3 years |
| Lucas | 32 | 80.0 years |
| White | 29 | 75.7 years |
| Wargo | 28 | 78.6 years |
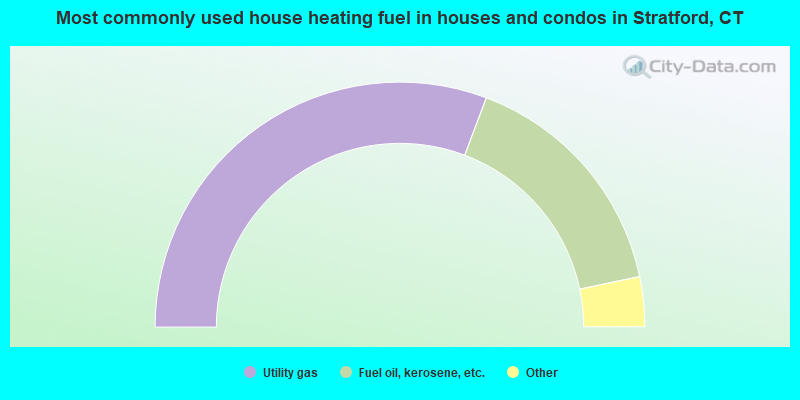
- 61.5%Utility gas
- 31.9%Fuel oil, kerosene, etc.
- 3.1%Electricity
- 1.5%Bottled, tank, or LP gas
- 1.0%Coal or coke
- 0.5%Wood
- 0.2%Other fuel
- 0.2%No fuel used
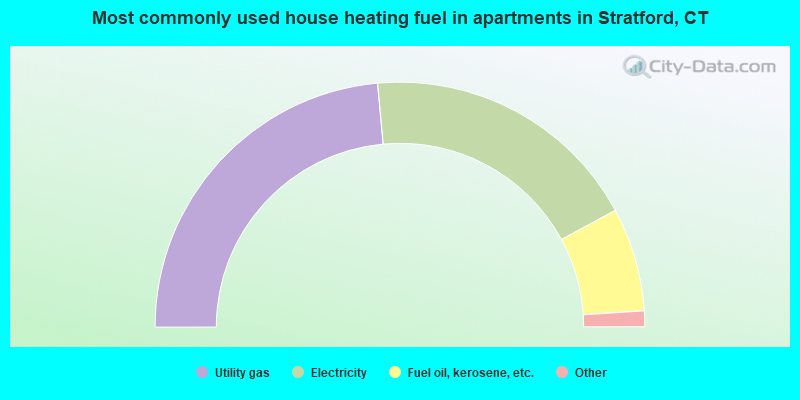
- 47.1%Utility gas
- 37.1%Electricity
- 13.7%Fuel oil, kerosene, etc.
- 1.4%Bottled, tank, or LP gas
- 0.7%Other fuel
Stratford compared to Connecticut state average:
- Unemployed percentage significantly below state average.
- Black race population percentage above state average.
- Renting percentage below state average.
- Length of stay since moving in significantly above state average.
- House age significantly below state average.
Stratford on our top lists:
- #1 on the list of "Top 101 cities with the lowest number of murders per 100,000 residents (population 50,000+)"
- #6 on the list of "Top 101 cities with largest percentage of males in industries: management of companies and enterprises (population 50,000+)"
- #33 on the list of "Top 101 cities with the largest city-data.com crime index decrease from 2011 to 2012 (population 50,000+)"
- #36 on the list of "Top 101 cities with largest percentage of females in industries: management of companies and enterprises (population 50,000+)"
- #51 on the list of "Top 100 cities with oldest residents (pop. 50,000+)"
- #58 on the list of "Top 101 cities with the highest average wind speeds (population 50,000+)"
- #60 on the list of "Top 101 cities where residents moved in more then 10 years ago (10,000+ households)"
- #63 on the list of "Top 101 cities with the lowest cost per building permit (population 50,000+)"
- #65 on the list of "Top 101 cities with the smallest differences between daily high and daily low temperatures (population 50,000+)"
- #65 on the list of "Top 100 cities with the largest percentage of females (pop. 50,000+)"
- #80 on the list of "Top 101 cities with the smallest precipitation differences during a year (population 50,000+)"
- #90 on the list of "Top 101 cities with the largest percentage of likely lesbian couples (counted as self-reported female-female unmarried-partner households) (population 50,000+)"
- #92 on the list of "Top 101 cities with the lowest maximum monthly sunshine amount (population 50,000+)"
- #92 on the list of "Top 101 cities with largest percentage of females in industries: utilities (population 50,000+)"
- #59 (06614) on the list of "Top 101 zip codes with the largest percentage of Slovak first ancestries (pop 5,000+)"
- #14 on the list of "Top 101 counties with the most Orthodox congregations"
- #18 on the list of "Top 101 counties with the best general health status score of residents (1-5), 3 years of data"
- #21 on the list of "Top 101 counties with the most Catholic congregations"
- #21 on the list of "Top 101 counties with the most Catholic adherents"
- #22 on the list of "Top 101 counties with the highest percentage of residents that visited a dentist within the past year"

|
|
Total of 513 patent applications in 2008-2024.