Races in Paterson, New Jersey (NJ) Detailed Stats
Data:
Races - White alone (%)
Races - White alone (% change since 2000)
Races - Black alone (%)
Races - Black alone (% change since 2000)
Races - American Indian alone (%)
Races - American Indian alone (% change since 2000)
Races - Asian alone (%)
Races - Asian alone (% change since 2000)
Races - Hispanic (%)
Races - Hispanic (% change since 2000)
Races - Native Hawaiian and Other Pacific Islander alone (%)
Races - Native Hawaiian and Other Pacific Islander alone (% change since 2000)
Races - Two or more races(%)
Races - Two or more races(% change since 2000)
Races - Other race alone (%)
Races - Other race alone (% change since 2000)
Racial diversity
Place of birth - Born in state of residence (%)
Place of birth - Born in state of residence (%) - White
Place of birth - Born in state of residence (%) - Black or African American
Place of birth - Born in state of residence (%) - Asian
Place of birth - Born in state of residence (%) - Hispanic or Latino
Place of birth - Born in state of residence (%) - American Indian and Alaska Native
Place of birth - Born in state of residence (%) - Multirace
Place of birth - Born in state of residence (%) - Other Race
Place of birth - Born in other state (%)
Place of birth - Born in other state (%) - White
Place of birth - Born in other state (%) - Black or African American
Place of birth - Born in other state (%) - Asian
Place of birth - Born in other state (%) - Hispanic or Latino
Place of birth - Born in other state (%) - American Indian and Alaska Native
Place of birth - Born in other state (%) - Multirace
Place of birth - Born in other state (%) - Other Race
Place of birth - Native, outside of US (%)
Place of birth - Native, outside of US (%) - White
Place of birth - Native, outside of US (%) - Black or African American
Place of birth - Native, outside of US (%) - Asian
Place of birth - Native, outside of US (%) - Hispanic or Latino
Place of birth - Native, outside of US (%) - American Indian and Alaska Native
Place of birth - Native, outside of US (%) - Multirace
Place of birth - Native, outside of US (%) - Other Race
Place of birth - Foreign born (%)
Place of birth - Foreign born (%) - White
Place of birth - Foreign born (%) - Black or African American
Place of birth - Foreign born (%) - Asian
Place of birth - Foreign born (%) - Hispanic or Latino
Place of birth - Foreign born (%) - American Indian and Alaska Native
Place of birth - Foreign born (%) - Multirace
Place of birth - Foreign born (%) - Other Race
Residents speaking English at home (%)
Residents speaking English at home - Born in the United States (%)
Residents speaking English at home - Native, born elsewhere (%)
Residents speaking English at home - Foreign born (%)
Residents speaking Spanish at home (%)
Residents speaking Spanish at home - Born in the United States (%)
Residents speaking Spanish at home - Native, born elsewhere (%)
Residents speaking Spanish at home - Foreign born (%)
Residents speaking other language at home (%)
Residents speaking other language at home - Born in the United States (%)
Residents speaking other language at home - Native, born elsewhere (%)
Residents speaking other language at home - Foreign born (%)
Marital status - Never married (%)
Marital status - Now married (%)
Marital status - Separated (%)
Marital status - Widowed (%)
Marital status - Divorced (%)
Ancestries Reported - Arab (%)
Ancestries Reported - Czech (%)
Ancestries Reported - Danish (%)
Ancestries Reported - Dutch (%)
Ancestries Reported - English (%)
Ancestries Reported - French (%)
Ancestries Reported - French Canadian (%)
Ancestries Reported - German (%)
Ancestries Reported - Greek (%)
Ancestries Reported - Hungarian (%)
Ancestries Reported - Irish (%)
Ancestries Reported - Italian (%)
Ancestries Reported - Lithuanian (%)
Ancestries Reported - Norwegian (%)
Ancestries Reported - Polish (%)
Ancestries Reported - Portuguese (%)
Ancestries Reported - Russian (%)
Ancestries Reported - Scotch-Irish (%)
Ancestries Reported - Scottish (%)
Ancestries Reported - Slovak (%)
Ancestries Reported - Subsaharan African (%)
Ancestries Reported - Swedish (%)
Ancestries Reported - Swiss (%)
Ancestries Reported - Ukrainian (%)
Ancestries Reported - United States (%)
Ancestries Reported - Welsh (%)
Ancestries Reported - West Indian (%)
Ancestries Reported - Other (%)
Geographical mobility - Same house 1 year ago (%)
Geographical mobility - Same house 1 year ago (%) - White
Geographical mobility - Same house 1 year ago (%) - Black or African American
Geographical mobility - Same house 1 year ago (%) - Asian
Geographical mobility - Same house 1 year ago (%) - Hispanic or Latino
Geographical mobility - Same house 1 year ago (%) - American Indian and Alaska Native
Geographical mobility - Same house 1 year ago (%) - Multirace
Geographical mobility - Same house 1 year ago (%) - Other Race
Geographical mobility - Moved within same county (%)
Geographical mobility - Moved within same county (%) - White
Geographical mobility - Moved within same county (%) - Black or African American
Geographical mobility - Moved within same county (%) - Asian
Geographical mobility - Moved within same county (%) - Hispanic or Latino
Geographical mobility - Moved within same county (%) - American Indian and Alaska Native
Geographical mobility - Moved within same county (%) - Multirace
Geographical mobility - Moved within same county (%) - Other Race
Geographical mobility - Moved from different county within same state (%)
Geographical mobility - Moved from different county within same state (%) - White
Geographical mobility - Moved from different county within same state (%) - Black or African American
Geographical mobility - Moved from different county within same state (%) - Asian
Geographical mobility - Moved from different county within same state (%) - Hispanic or Latino
Geographical mobility - Moved from different county within same state (%) - American Indian and Alaska Native
Geographical mobility - Moved from different county within same state (%) - Multirace
Geographical mobility - Moved from different county within same state (%) - Other Race
Geographical mobility - Moved from different state (%)
Geographical mobility - Moved from different state (%) - White
Geographical mobility - Moved from different state (%) - Black or African American
Geographical mobility - Moved from different state (%) - Asian
Geographical mobility - Moved from different state (%) - Hispanic or Latino
Geographical mobility - Moved from different state (%) - American Indian and Alaska Native
Geographical mobility - Moved from different state (%) - Multirace
Geographical mobility - Moved from different state (%) - Other Race
Geographical mobility - Moved from abroad (%)
Geographical mobility - Moved from abroad (%) - White
Geographical mobility - Moved from abroad (%) - Black or African American
Geographical mobility - Moved from abroad (%) - Asian
Geographical mobility - Moved from abroad (%) - Hispanic or Latino
Geographical mobility - Moved from abroad (%) - American Indian and Alaska Native
Geographical mobility - Moved from abroad (%) - Multirace
Geographical mobility - Moved from abroad (%) - Other Race
Place of birth for the foreign-born population - Ireland (%)
Place of birth for the foreign-born population - Denmark (%)
Place of birth for the foreign-born population - Norway (%)
Place of birth for the foreign-born population - Sweden (%)
Place of birth for the foreign-born population - United Kingdom (%)
Place of birth for the foreign-born population - England (%)
Place of birth for the foreign-born population - Scotland (%)
Place of birth for the foreign-born population - Other Northern Europe (%)
Place of birth for the foreign-born population - Austria (%)
Place of birth for the foreign-born population - Belgium (%)
Place of birth for the foreign-born population - France (%)
Place of birth for the foreign-born population - Germany (%)
Place of birth for the foreign-born population - Netherlands (%)
Place of birth for the foreign-born population - Switzerland (%)
Place of birth for the foreign-born population - Other Western Europe (%)
Place of birth for the foreign-born population - Greece (%)
Place of birth for the foreign-born population - Italy (%)
Place of birth for the foreign-born population - Portugal (%)
Place of birth for the foreign-born population - Spain (%)
Place of birth for the foreign-born population - Other Southern Europe (%)
Place of birth for the foreign-born population - Albania (%)
Place of birth for the foreign-born population - Belarus (%)
Place of birth for the foreign-born population - Bosnia and Herzegovina (%)
Place of birth for the foreign-born population - Bulgaria (%)
Place of birth for the foreign-born population - Croatia (%)
Place of birth for the foreign-born population - Czechoslovakia (%)
Place of birth for the foreign-born population - Hungary (%)
Place of birth for the foreign-born population - Latvia (%)
Place of birth for the foreign-born population - Lithuania (%)
Place of birth for the foreign-born population - North Macedonia (Macedonia) (%)
Place of birth for the foreign-born population - Moldova (%)
Place of birth for the foreign-born population - Poland (%)
Place of birth for the foreign-born population - Romania (%)
Place of birth for the foreign-born population - Russia (%)
Place of birth for the foreign-born population - Serbia (%)
Place of birth for the foreign-born population - Ukraine (%)
Place of birth for the foreign-born population - Other Eastern Europe (%)
Place of birth for the foreign-born population - China (%)
Place of birth for the foreign-born population - Hong Kong (%)
Place of birth for the foreign-born population - Taiwan (%)
Place of birth for the foreign-born population - Japan (%)
Place of birth for the foreign-born population - Korea (%)
Place of birth for the foreign-born population - Other Eastern Asia (%)
Place of birth for the foreign-born population - Afghanistan (%)
Place of birth for the foreign-born population - Bangladesh (%)
Place of birth for the foreign-born population - India (%)
Place of birth for the foreign-born population - Iran (%)
Place of birth for the foreign-born population - Kazakhstan (%)
Place of birth for the foreign-born population - Nepal (%)
Place of birth for the foreign-born population - Pakistan (%)
Place of birth for the foreign-born population - Sri Lanka (%)
Place of birth for the foreign-born population - Uzbekistan (%)
Place of birth for the foreign-born population - Other South Central Asia (%)
Place of birth for the foreign-born population - Burma (%)
Place of birth for the foreign-born population - Cambodia (%)
Place of birth for the foreign-born population - Indonesia (%)
Place of birth for the foreign-born population - Laos (%)
Place of birth for the foreign-born population - Malaysia (%)
Place of birth for the foreign-born population - Philippines (%)
Place of birth for the foreign-born population - Singapore (%)
Place of birth for the foreign-born population - Thailand (%)
Place of birth for the foreign-born population - Vietnam (%)
Place of birth for the foreign-born population - Other South Eastern Asia (%)
Place of birth for the foreign-born population - Armenia (%)
Place of birth for the foreign-born population - Iraq (%)
Place of birth for the foreign-born population - Israel (%)
Place of birth for the foreign-born population - Jordan (%)
Place of birth for the foreign-born population - Kuwait (%)
Place of birth for the foreign-born population - Lebanon (%)
Place of birth for the foreign-born population - Saudi Arabia (%)
Place of birth for the foreign-born population - Syria (%)
Place of birth for the foreign-born population - Turkey (%)
Place of birth for the foreign-born population - Yemen (%)
Place of birth for the foreign-born population - Other Western Asia (%)
Place of birth for the foreign-born population - Eritrea (%)
Place of birth for the foreign-born population - Ethiopia (%)
Place of birth for the foreign-born population - Kenya (%)
Place of birth for the foreign-born population - Somalia (%)
Place of birth for the foreign-born population - Uganda (%)
Place of birth for the foreign-born population - Zimbabwe (%)
Place of birth for the foreign-born population - Other Eastern Africa (%)
Place of birth for the foreign-born population - Cameroon (%)
Place of birth for the foreign-born population - Congo (%)
Place of birth for the foreign-born population - Democratic Republic of Congo (Zaire) (%)
Place of birth for the foreign-born population - Other Middle Africa (%)
Place of birth for the foreign-born population - Egypt (%)
Place of birth for the foreign-born population - Morocco (%)
Place of birth for the foreign-born population - Sudan (%)
Place of birth for the foreign-born population - Other Northern Africa (%)
Place of birth for the foreign-born population - South Africa (%)
Place of birth for the foreign-born population - Other Southern Africa (%)
Place of birth for the foreign-born population - Cabo Verde (%)
Place of birth for the foreign-born population - Ghana (%)
Place of birth for the foreign-born population - Liberia (%)
Place of birth for the foreign-born population - Nigeria (%)
Place of birth for the foreign-born population - Senegal (%)
Place of birth for the foreign-born population - Sierra Leone (%)
Place of birth for the foreign-born population - Other Western Africa (%)
Place of birth for the foreign-born population - Australia (%)
Place of birth for the foreign-born population - New Zealand (%)
Place of birth for the foreign-born population - Fiji (%)
Place of birth for the foreign-born population - Micronesia (%)
Place of birth for the foreign-born population - Bahamas (%)
Place of birth for the foreign-born population - Barbados (%)
Place of birth for the foreign-born population - Cuba (%)
Place of birth for the foreign-born population - Dominica (%)
Place of birth for the foreign-born population - Dominican Republic (%)
Place of birth for the foreign-born population - Grenada (%)
Place of birth for the foreign-born population - Haiti (%)
Place of birth for the foreign-born population - Jamaica (%)
Place of birth for the foreign-born population - St. Vincent and the Grenadines (%)
Place of birth for the foreign-born population - Trinidad and Tobago (%)
Place of birth for the foreign-born population - West Indies (%)
Place of birth for the foreign-born population - Other Caribbean (%)
Place of birth for the foreign-born population - Belize (%)
Place of birth for the foreign-born population - Costa Rica (%)
Place of birth for the foreign-born population - El Salvador (%)
Place of birth for the foreign-born population - Guatemala (%)
Place of birth for the foreign-born population - Honduras (%)
Place of birth for the foreign-born population - Mexico (%)
Place of birth for the foreign-born population - Nicaragua (%)
Place of birth for the foreign-born population - Panama (%)
Place of birth for the foreign-born population - Other Central America (%)
Place of birth for the foreign-born population - Argentina (%)
Place of birth for the foreign-born population - Bolivia (%)
Place of birth for the foreign-born population - Brazil (%)
Place of birth for the foreign-born population - Chile (%)
Place of birth for the foreign-born population - Colombia (%)
Place of birth for the foreign-born population - Ecuador (%)
Place of birth for the foreign-born population - Guyana (%)
Place of birth for the foreign-born population - Peru (%)
Place of birth for the foreign-born population - Uruguay (%)
Place of birth for the foreign-born population - Venezuela (%)
Place of birth for the foreign-born population - Other South America (%)
Place of birth for the foreign-born population - Canada (%)
Place of birth for the foreign-born population - Other Northern America (%)
Place of birth for the foreign-born population - Other (%)
Latest news about races in Paterson, NJ collected exclusively by city-data.com from local newspapers, TV, and radio stations
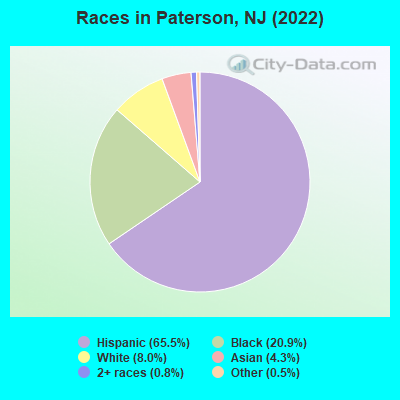
According to 2022 data, the most numerous races in Paterson, NJ are White alone (12,513 residents), Hispanic (102,529 residents), and Black alone (32,770 residents). 33.3% of Paterson residents speak English at home. 44.9% of Paterson, NJ residents are foreign-born (37.1% born in Latin America, 4.8% born in Asia), which is 48.8% greater than the foreign-born rate of 23.0% across the entire state of New Jersey.
Race distribution in Paterson
2000 2022
74,774 50.1% Hispanic 46,882 31.4% Black alone 19,765 13.2% White alone 4,279 2.9% Two or more races 2,728 1.8% Asian alone 496 0.3% Other race alone 242 0.2% American Indian alone 56 0.04% Native Hawaiian and Other
102,529 65.5% Hispanic 32,770 20.9% Black alone 12,513 8.0% White alone 6,782 4.3% Asian alone 1,242 0.8% Two or more races 803 0.5% Other race alone
2000 2022
5,557,209 66.0% White alone 1,117,191 13.3% Hispanic 1,096,171 13.0% Black alone 477,012 5.7% Asian alone 133,689 1.6% Two or more races 19,565 0.2% Other race alone 11,338 0.1% American Indian alone 2,175 0.03% Native Hawaiian and Other
4,766,476 51.5% White alone 2,028,470 21.9% Hispanic 1,111,632 12.0% Black alone 923,546 10.0% Asian alone 332,237 3.6% Two or more races 89,847 1.0% Other race alone 8,557 0.09% American Indian alone 934 0.01% Native Hawaiian and Other
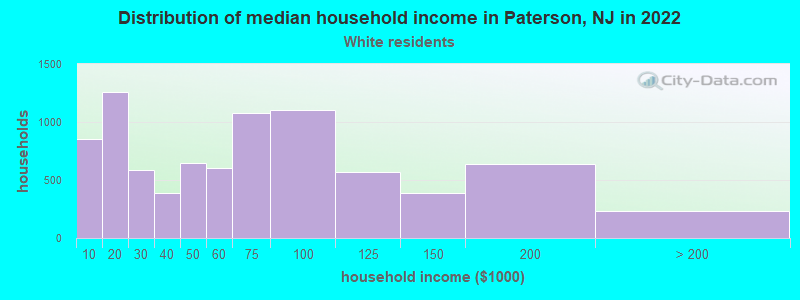
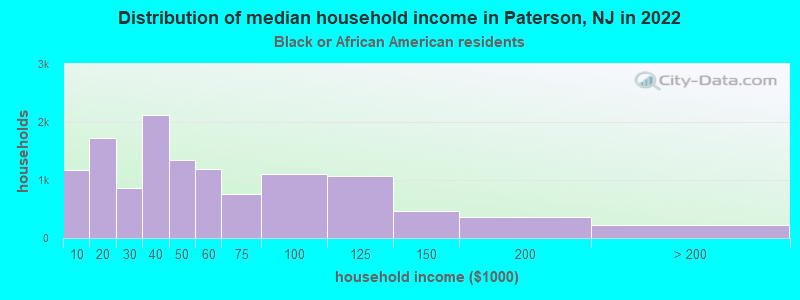
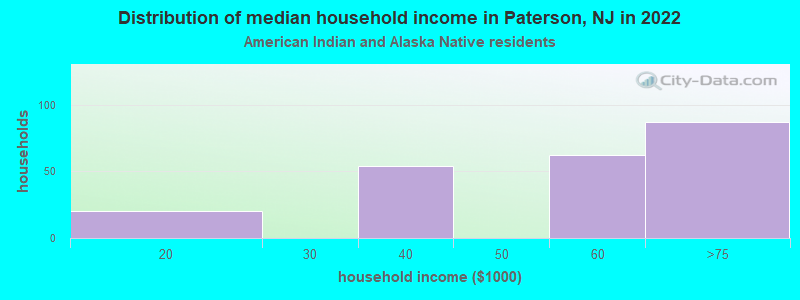
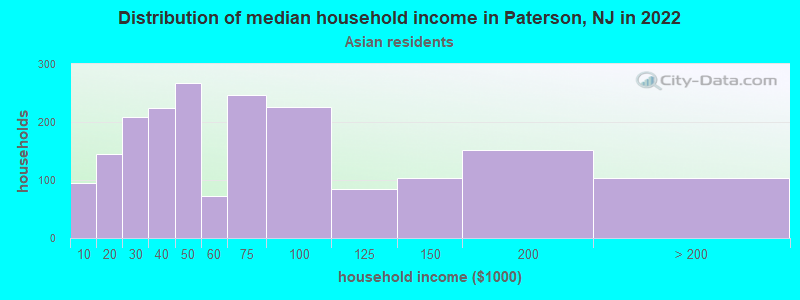
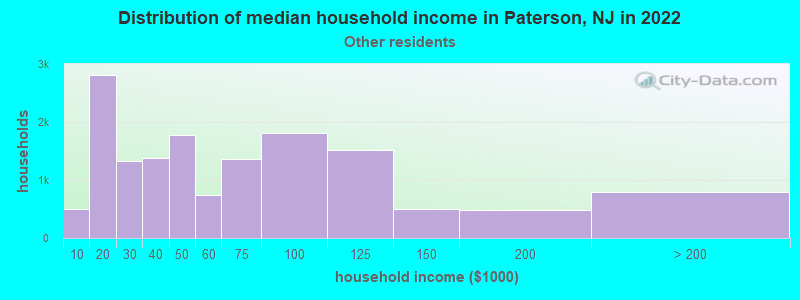
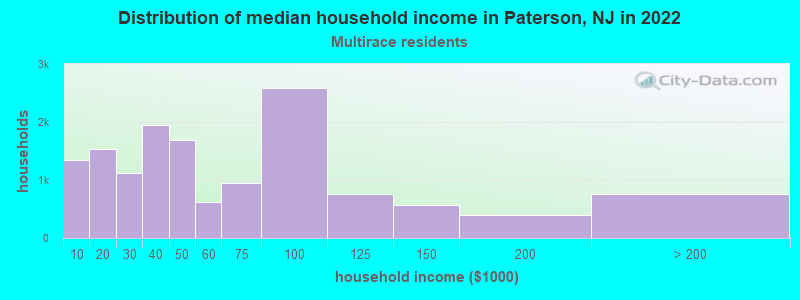
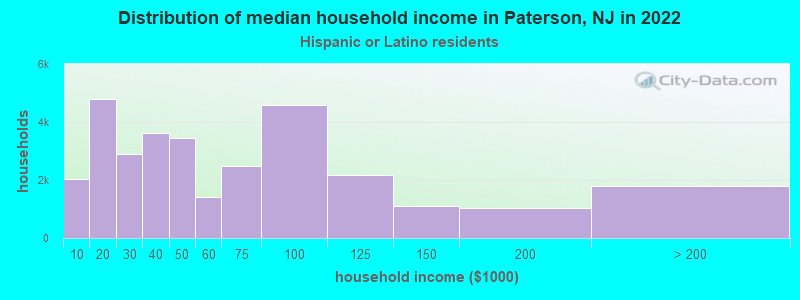
Income and house value in Paterson Median household income in 2022 $58,097 White non-Hispanic householders$42,617 Black householders$80,125 Asian householders$48,227 Some other race householders$47,774 Two or more races householders$47,106 Hispanic or Latino race householdersMedian 2022 house value $300,740 White Non-Hispanic householders$305,552 Black or African American householders$246,060 American Indian or Alaska Native householders $304,896 Asian householders$293,741 Some other race householders$312,770 Two or more races householders$293,741 Hispanic or Latino householders
Median age by race in Paterson
38.3 Median age for White residents38.2 38.8 34.6 Median age for Black or African American residents35.5 30.8 37.7 Median age for American Indian / Alaska Native residents-666,666,666.0 -666,666,666.0 32.2 Median age for Asian residents28.4 32.5 -666,666,666.0 Median age for Native Hawaiian / Pacific Islander residents-666,666,666.0 -666,666,666.0 28.8 Median age for Other race residents28.2 30.7 35.3 Median age for Two or more races residents35.1 35.8 38.9 Median age for White alone residents43.1 38.1 32.5 Median age for Hispanic or Latino residents32.0 33.5
Owner/renter occupied households by race in Paterson
House owners and renters - White residents 3,292 51.3% Owner occupied3,131 48.7% Renter occupiedHouse owners and renters - Black or African American residents 3,007 24.3% Owner occupied9,383 75.7% Renter occupiedHouse owners and renters - American Indian / Alaska Native residents 45 30.8% Owner occupied102 69.2% Renter occupiedHouse owners and renters - Asian residents 671 38.0% Owner occupied1,097 62.0% Renter occupiedHouse owners and renters - Native Hawaiian / Pacific Islander residents 12 100.0% Renter occupiedHouse owners and renters - Other race residents 3,496 23.3% Owner occupied11,493 76.7% Renter occupiedHouse owners and renters - Two or more races residents 3,115 21.8% Owner occupied11,164 78.2% Renter occupiedHouse owners and renters - White alone residents 2,250 54.5% Owner occupied1,882 45.5% Renter occupiedHouse owners and renters - Hispanic or Latino residents 7,401 23.6% Owner occupied23,998 76.4% Renter occupied
Language usage in Paterson
English speakers - Total 33.3% of residents of Paterson speak English at home.
57.2% of residents speak Spanish at home 38,234 46.3% Speak English very well44,380 53.7% Speak English less than very well9.5% of residents speak other language at home 8,159 59.4% Speak English very well5,580 40.6% Speak English less than very well
English speakers - Born in the United States 59.4% of residents of Paterson speak English at home.
30.0% of residents speak Spanish at home 4,252 86.2% Speak English very well682 13.8% Speak English less than very well10.6% of residents speak other language at home 1,433 82.2% Speak English very well311 17.8% Speak English less than very well
English speakers - Native, born elsewhere 10.4% of residents of Paterson speak English at home.
88.8% of residents speak Spanish at home 4,374 68.4% Speak English very well2,020 31.6% Speak English less than very well0.8% of residents speak other language at home 59 100.0% Speak English very well
English speakers - Foreign-born 6.7% of residents of Paterson speak English at home.
79.1% of residents speak Spanish at home 11,056 22.0% Speak English very well39,213 78.0% Speak English less than very well14.2% of residents speak other language at home 3,946 43.7% Speak English very well5,084 56.3% Speak English less than very well
White (Caucasian) - Speak only English Native:
53.0% (6,197)Foreign-born:
8.8% (583)
White (Caucasian) - Speak another language Native:
47.0% (5,493)Foreign-born:
91.2% (6,075)
Black or African American - Speak only English Native:
98.8% (27,403)Foreign-born:
42.5% (1,325)
Black or African American - Speak another language Native:
1.2% (346)Foreign-born:
57.5% (1,789)
American Indian / Alaska Native - Speak another language Native:
77.2% (147)Foreign-born:
97.6% (364)
Asian - Speak only English Native:
42.8% (1,115)Foreign-born:
5.9% (211)
Asian - Speak another language Native:
57.2% (1,493)Foreign-born:
94.1% (3,374)
Other race - Speak only English Native:
19.1% (3,709)Foreign-born:
4.7% (1,307)
Other race - Speak another language Native:
80.9% (15,751)Foreign-born:
95.3% (26,260)
Two or more races - Speak only English Native:
28.0% (5,325)Foreign-born:
3.6% (820)
Two or more races - Speak another language Native:
72.0% (13,704)Foreign-born:
96.4% (21,801)
White alone - Speak only English Native:
65.0% (5,106)Foreign-born:
4.4% (174)
White alone - Speak another language Native:
35.0% (2,748)Foreign-born:
95.6% (3,822)
Hispanic or Latino - Speak only English Native:
22.4% (9,243)Foreign-born:
4.4% (2,321)
Hispanic or Latino - Speak another language Native:
77.6% (31,996)Foreign-born:
95.6% (50,214)
Foreign-born residents in Paterson 70,093 residents are foreign born (37.1% Latin America , 4.8% Asia ).
This city:
44.9%New Jersey:
23.2%
Marital status for residents in Paterson Marital status - White (Caucasian) population 15 years and over
Males 39.7% Never married40.3% Now married4.3% Separated7.0% Widowed8.8% DivorcedFemales 39.7% Never married30.0% Now married6.9% Separated13.2% Widowed10.3% DivorcedWomen who gave birth in the past 12 months Now married:
45.9% (96)Unmarried:
54.1% (113)
Women who did not give birth in the past 12 months Now married:
37.2% (1,792)Unmarried:
62.8% (3,026)
Marital status - Black or African American population 15 years and over
Males 58.3% Never married26.1% Now married1.5% Separated6.7% Widowed7.4% DivorcedFemales 63.7% Never married20.0% Now married0.7% Separated8.7% Widowed6.8% DivorcedWomen who gave birth in the past 12 months Now married:
30.0% (296)Unmarried:
70.0% (692)
Women who did not give birth in the past 12 months Now married:
14.0% (1,208)Unmarried:
86.0% (7,427)
Marital status - American Indian / Alaska Native population 15 years and over
Males 31.0% Never married42.5% Now married0.0% Separated0.0% Widowed26.4% DivorcedFemales 51.5% Never married43.3% Now married0.0% Separated0.0% Widowed5.2% DivorcedWomen who gave birth in the past 12 months Now married:
31.9% (23)Unmarried:
68.1% (49)
Women who did not give birth in the past 12 months Now married:
40.9% (73)Unmarried:
59.1% (105)
Marital status - Asian population 15 years and over
Males 33.7% Never married61.9% Now married1.1% Separated1.8% Widowed1.5% DivorcedFemales 33.5% Never married55.4% Now married0.4% Separated8.2% Widowed2.5% DivorcedWomen who gave birth in the past 12 months Now married:
100.0% (259)Unmarried:
0.0% (0)
Women who did not give birth in the past 12 months Now married:
49.3% (794)Unmarried:
50.7% (818)
Marital status - Native Hawaiian / Pacific Islander population 15 years and over
Males 100.0% Never married0.0% Now married0.0% Separated0.0% Widowed0.0% DivorcedFemales 100.0% Never married0.0% Now married0.0% Separated0.0% Widowed0.0% DivorcedMarital status - Other race population 15 years and over
Males 56.7% Never married35.3% Now married1.9% Separated0.2% Widowed5.8% DivorcedFemales 42.0% Never married29.9% Now married11.8% Separated6.8% Widowed9.5% DivorcedWomen who gave birth in the past 12 months Now married:
38.6% (127)Unmarried:
61.4% (202)
Women who did not give birth in the past 12 months Now married:
37.9% (4,742)Unmarried:
62.1% (7,757)
Marital status - Two or more races population 15 years and over
Males 43.5% Never married35.8% Now married8.1% Separated1.5% Widowed11.0% DivorcedFemales 41.7% Never married32.7% Now married8.3% Separated6.6% Widowed10.7% DivorcedWomen who gave birth in the past 12 months Now married:
79.8% (435)Unmarried:
20.2% (110)
Women who did not give birth in the past 12 months Now married:
29.6% (2,817)Unmarried:
70.4% (6,688)
Marital status - White alone, not Hispanic / Latino population 15 years and over
Males 37.3% Never married44.4% Now married0.0% Separated10.2% Widowed8.2% DivorcedFemales 38.0% Never married35.2% Now married0.0% Separated14.4% Widowed12.5% DivorcedWomen who gave birth in the past 12 months Now married:
100.0% (76)Unmarried:
0.0% (0)
Women who did not give birth in the past 12 months Now married:
42.2% (1,044)Unmarried:
57.8% (1,430)
Marital status - Hispanic or Latino population 15 years and over
Males 49.3% Never married35.5% Now married5.7% Separated0.8% Widowed8.7% DivorcedFemales 42.5% Never married30.3% Now married10.8% Separated6.9% Widowed9.6% DivorcedWomen who gave birth in the past 12 months Now married:
64.3% (562)Unmarried:
35.7% (312)
Women who did not give birth in the past 12 months Now married:
32.7% (7,651)Unmarried:
67.3% (15,771)
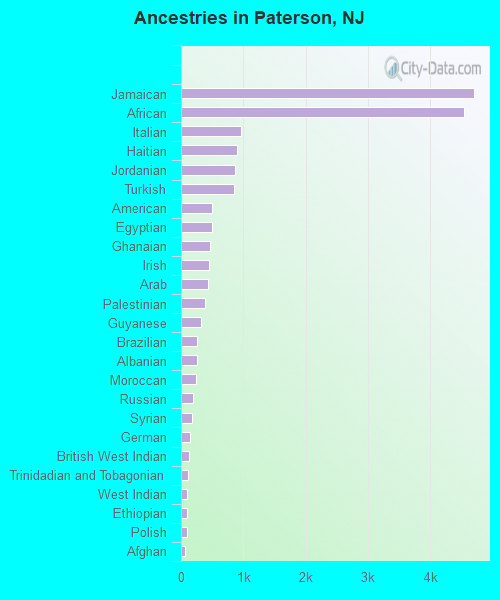
Ancestries in Paterson
4,710 3.9% Jamaican4,540 3.7% African968 0.8% Italian892 0.7% Haitian865 0.7% Jordanian851 0.7% Turkish504 0.4% American490 0.4% Egyptian466 0.4% Ghanaian454 0.4% Irish434 0.4% Arab387 0.3% Palestinian328 0.3% Guyanese253 0.2% Brazilian252 0.2% Albanian238 0.2% Moroccan186 0.2% Russian171 0.1% Syrian149 0.1% German133 0.1% British West Indian105 0.09% Trinidadian and Tobagonian102 0.08% West Indian100 0.08% Ethiopian97 0.08% Polish70 0.06% Afghan69 0.06% Nigerian69 0.06% English61 0.05% Serbian54 0.04% Yugoslavian49 0.04% Hungarian46 0.04% Portuguese40 0.03% Canadian38 0.03% Iraqi33 0.03% Macedonian31 0.03% Greek29 0.02% Slovak27 0.02% Czechoslovakian23 0.02% Norwegian20 0.02% Lebanese16 0.01% Lithuanian15 0.01% Romanian13 0.01% Ugandan12 0.01% Scottish11 0.01% European11 0.01% Armenian8 0.01% French Canadian7 0.01% Dutch
Geographical mobility in Paterson Same house 1 year ago 20,774 91.7% White (Caucasian)30,953 95.0% Black or African American568 96.6% American Indian / Alaska Native7,236 95.2% Asian52 100.0% Native Hawaiian / Pacific Islander45,136 87.2% Other race38,626 93.7% Two or more races10,741 93.8% White alone, not Hispanic / Latino92,306 90.6% Hispanic or LatinoMoved within same county 1,736 7.7% White / Caucasian1,498 4.6% Black or African American170 2.2% Asian3,807 7.4% Other race1,423 3.5% Two or more races321 2.8% White alone, not Hispanic / Latino5,527 5.4% Hispanic or LatinoMoved within same state 378 1.7% White / Caucasian81 0.2% Black or African American39 0.5% Asian1,590 3.1% Other race279 0.7% Two or more races181 1.6% White alone, not Hispanic / Latino1,834 1.8% Hispanic or LatinoMoved from different state 62 0.3% White / Caucasian64 0.2% Black or African American1 0.0% Asian321 0.6% Other race202 0.5% Two or more races22 0.2% White alone, not Hispanic / Latino622 0.6% Hispanic or LatinoMoved from abroad 300 1.3% White198 2.6% Asian887 1.7% Other race322 0.8% Two or more races99 0.9% White alone, not Hispanic / Latino1,542 1.5% Hispanic or Latino
Children Nativity (place of birth) in Paterson
Children under 6 years - Living with two parents Both parents native 1,925 100.0% NativeBoth parents foreign-born 3,137 80.1% Native781 19.9% Foreign-bornOne native, one foreign-born parent 1,733 100.0% NativeChildren under 6 years - Living with one parent Native parent 3,176 100.0% NativeForeign-born parent 3,596 90.1% Native393 9.9% Foreign-bornChildren 6 to 17 years - Living with two parents Both parents native 2,095 100.0% NativeBoth parents foreign-born 5,986 73.6% Native2,149 26.4% Foreign-bornOne native, one foreign-born parent 839 100.0% NativeChildren 6 to 17 years - Living with one parent Native parent 4,517 100.0% NativeForeign-born parent 8,194 59.1% Native5,662 40.9% Foreign-born
Place of birth for residents in Paterson 59,623 Americas59,577 Latin America36,786 Caribbean15,483 South America7,733 Asia7,308 Central America5,173 South Central Asia1,837 Western Asia1,531 Africa1,205 Europe726 Northern Africa677 Eastern Europe641 Western Africa290 Southern Europe213 South Eastern Asia194 Eastern Asia145 Western Europe92 Northern Europe59 Eastern Africa45 Northern America29 China13 Southern Africa31,357 Dominican Republic6,868 Peru5,522 Colombia4,308 Bangladesh4,220 Jamaica3,840 Mexico1,804 Ecuador1,209 El Salvador854 Costa Rica683 Jordan590 Honduras573 Turkey571 Haiti544 Ghana540 Guatemala427 Pakistan398 Egypt397 Guyana371 Albania357 India299 Morocco285 Cuba283 Brazil263 Italy248 Nicaragua210 Venezuela179 Argentina158 Syria148 Trinidad and Tobago145 Korea135 Dominica128 Philippines128 Lebanon105 France78 Chile76 Bolivia76 Yemen74 United Arab Emirates72 Afghanistan70 Serbia69 Saudi Arabia69 Nigeria61 Uruguay59 Kenya51 Russia49 Thailand45 England45 Canada40 Poland39 Iraq38 North Macedonia (Macedonia)35 Indonesia34 St. Vincent and the Grenadines34 Kuwait29 China29 Norway28 Algeria27 Portugal26 Liberia24 Belize23 Germany22 Bahamas20 Hungary19 Japan17 United Kingdom16 Austria14 Romania13 South Africa8 Iran1 Togo1 Bulgaria
Grandparents responsible for own grandchildren in Paterson
Grandparents (30 to 59 years) White / Caucasian 113 40.0% Responsible for grandchildren169 60.0% Not responsible for grandchildrenBlack or African American 164 28.4% Responsible for grandchildren413 71.6% Not responsible for grandchildrenAmerican Indian / Alaska Native 190 100.0% Not responsible for grandchildrenAsian 20 87.0% Responsible for grandchildren3 13.0% Not responsible for grandchildrenOther race 195 15.5% Responsible for grandchildren1,068 84.5% Not responsible for grandchildrenTwo or more races 117 36.6% Responsible for grandchildren202 63.4% Not responsible for grandchildrenWhite alone, not Hispanic / Latino 25 42.3% Responsible for grandchildren34 57.7% Not responsible for grandchildrenHispanic or Latino 445 25.1% Responsible for grandchildren1,331 74.9% Not responsible for grandchildrenGrandparents (60 years and over) White / Caucasian 80 34.5% Responsible for grandchildren152 65.5% Not responsible for grandchildrenBlack or African American 780 67.7% Responsible for grandchildren373 32.3% Not responsible for grandchildrenAsian 135 100.0% Not responsible for grandchildrenOther race 52 2.6% Responsible for grandchildren1,947 97.4% Not responsible for grandchildrenTwo or more races 484 100.0% Not responsible for grandchildrenWhite alone, not Hispanic / Latino 77 49.8% Responsible for grandchildren77 50.2% Not responsible for grandchildrenHispanic or Latino 2,886 100.0% Not responsible for grandchildren