Estimated zip code population in 2022: 22,407 Zip code population in 2010: 20,883 Zip code population in 2000: 21,677
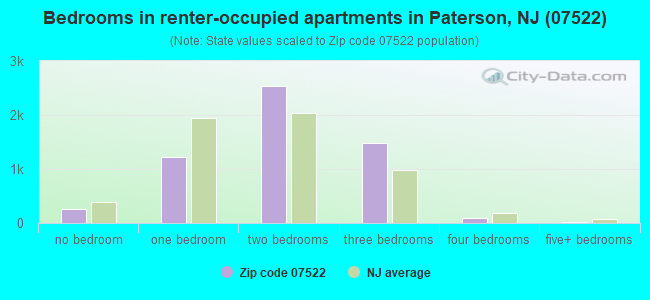
Houses and condos: 7,671 Renter-occupied apartments: 5,649
% of renters here:
78%
State:
35%
March 2022 cost of living index in zip code 07522: 117.0 (more than average, U.S. average is 100)
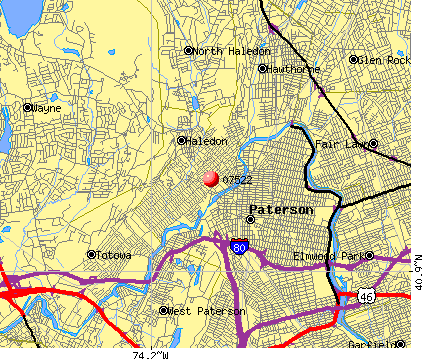
Land area: 0.8 sq. mi. Water area: 0.0 sq. mi.
Population density: 27,306 people per square mile
(very high).
OSM Map
Google Map
MSN Map
OSM Map
General Map
Google Map
MSN Map
OSM Map
Google Map
MSN Map
OSM Map
Google Map
MSN Map
Please wait while loading the map...
Real estate property taxes paid for housing units in 2022:
This zip code:
3.0% ($6,786)
New Jersey:
2.1% ($8,897)
Median real estate property taxes paid for housing units with mortgages in 2022: $6,170 (2.8%) Median real estate property taxes paid for housing units with no mortgage in 2022: $7,756 (3.4%)
Business Search- 14 Million verified businesses
Males: 10,244
(45.7%)
Females: 12,162
(54.3%)
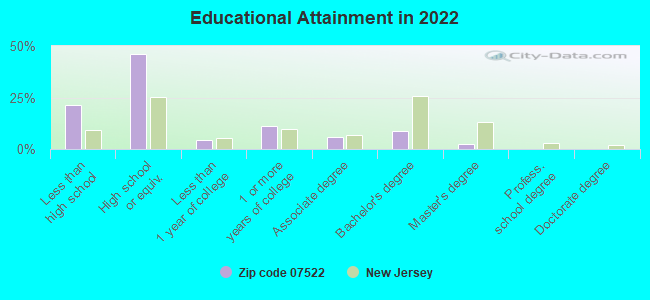
For population 25 years and over in 07522:
High school or higher: 76.9%
Bachelor's degree or higher: 10.8%
Graduate or professional degree: 2.5%
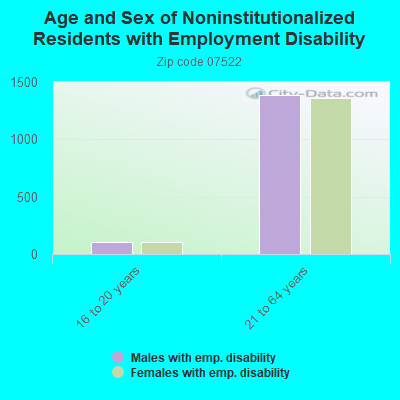
Unemployed: 12.8%
Mean travel time to work (commute): 24.1 minutes
For population 15 years and over in 07522:
Never married: 52.6%
Now married: 33.1%
Separated: 4.8%
Widowed: 2.0%
Divorced: 7.4%
Zip code 07522 compared to state average:
Median household income below state average.
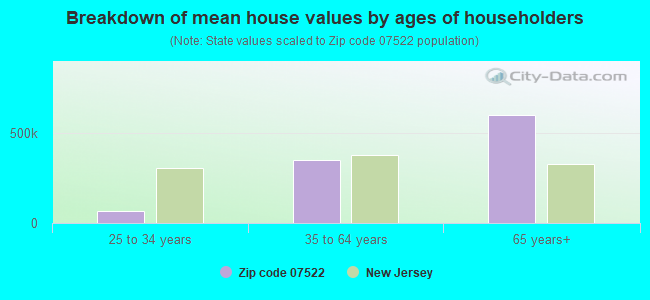
Median house value below state average.
Unemployed percentage above state average.
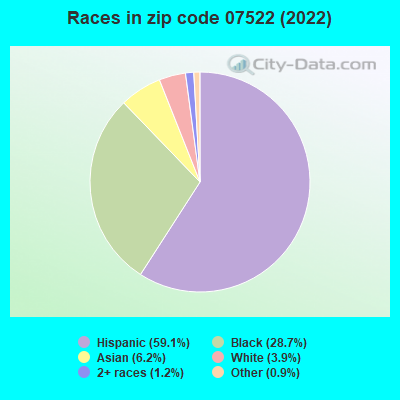
Black race population percentage above state average.
Hispanic race population percentage above state average.
Median age significantly below state average.
Renting percentage above state average.
Length of stay since moving in significantly below state average.
Number of rooms per house below state average.
House age above state average.
Percentage of population with a bachelor's degree or higher significantly below state average.
Averages for the 2020 tax year for zip code 07522, filed in 2021:
Average Adjusted Gross Income (AGI) in 2020: $29,872 (Individual Income Tax Returns)
Here:
$29,872
State:
$95,247
Salary/wage: $27,438 (reported on 85.7% of returns)
Here:
$27,438
State:
$80,635
(% of AGI for various income ranges: 1057.4% for AGIs below $25k, 3337.0% for AGIs $25k-50k, 6819.0% for AGIs $50k-75k, 10058.1% for AGIs $75k-100k, 15875.4% for AGIs $100k-200k)
Taxable interest for individuals: $359 (reported on 4.8% of returns)
This zip code:
$359
New Jersey:
$2,414
(% of AGI for various income ranges: 0.8% for AGIs below $25k, 1.4% for AGIs $25k-50k, 2.1% for AGIs $50k-75k, 30.4% for AGIs $75k-100k, 11.5% for AGIs $100k-200k)
Ordinary dividends: $716 (reported on 1.6% of returns)
Here:
$716
State:
$8,057
(% of AGI for various income ranges: 0.5% for AGIs below $25k, 0.3% for AGIs $25k-50k, 1.5% for AGIs $50k-75k, 23.7% for AGIs $75k-100k, 18.5% for AGIs $100k-200k)
Net capital gain/loss in AGI: +$3,489 (reported on 2.4% of returns)
Here:
+$3,489
State:
+$25,022
(% of AGI for various income ranges: 0.4% for AGIs below $25k, 5.1% for AGIs $25k-50k, 16.2% for AGIs $50k-75k, 22.6% for AGIs $75k-100k, 443.1% for AGIs $100k-200k)
Profit/loss from business: +$6,110 (reported on 17.2% of returns)
Here:
+$6,110
State:
+$18,035
(% of AGI for various income ranges: 142.4% for AGIs below $25k, 80.1% for AGIs $25k-50k, 187.6% for AGIs $50k-75k, 195.9% for AGIs $75k-100k, 523.8% for AGIs $100k-200k)
Taxable individual retirement arrangement distribution: $9,475 (reported on 0.7% of returns)
07522:
$9,475
New Jersey:
$21,558
(% of AGI for various income ranges: 3.0% for AGIs below $25k, 7.1% for AGIs $25k-50k, 138.1% for AGIs $75k-100k)
Total itemized deductions: $24,204 (reported on 2.4% of returns)
Here:
$24,204
State:
$32,863
(% of AGI for various income ranges: 13.8% for AGIs below $25k, 68.2% for AGIs $25k-50k, 178.0% for AGIs $50k-75k, 446.3% for AGIs $75k-100k, 751.5% for AGIs $100k-200k)
Charity contributions: $5,280 (reported on 1.7% of returns)
Here:
$5,280
State:
$7,880
(% of AGI for various income ranges: 11.4% for AGIs $25k-50k, 24.5% for AGIs $50k-75k, 77.4% for AGIs $75k-100k, 176.9% for AGIs $100k-200k)
Taxes paid: $8,014 (reported on 2.4% of returns)
07522:
$8,014
State:
$9,183
(% of AGI for various income ranges: 4.4% for AGIs below $25k, 23.5% for AGIs $25k-50k, 63.3% for AGIs $50k-75k, 126.7% for AGIs $75k-100k, 245.4% for AGIs $100k-200k)
Earned income credit: $2,577 (reported on 38.1% of returns)
Here:
$2,577
State:
$2,148
(% of AGI for various income ranges: 163.5% for AGIs below $25k, 110.6% for AGIs $25k-50k, 1.6% for AGIs $50k-75k)
Percentage of individuals using paid preparers for their 2020 taxes: 94.2%
Here:
94%
State:
92%
(% for various income ranges: 92.7% for AGIs below $25k, 95.9% for AGIs $25k-50k, 94.7% for AGIs $50k-75k, 94.6% for AGIs $75k-100k, 95.0% for AGIs $100k-200k)
Averages for the 2012 tax year for zip code 07522, filed in 2013:
Average Adjusted Gross Income (AGI) in 2012: $25,291 (Individual Income Tax Returns)
Here:
$25,291
State:
$79,688
Salary/wage: $24,847 (reported on 89.2% of returns)
Here:
$24,847
State:
$68,122
(% of AGI for various income ranges: 79.0% for AGIs below $25k, 94.1% for AGIs $25k-50k, 92.2% for AGIs $50k-75k, 87.8% for AGIs $75k-100k, 79.6% for AGIs $100k-200k)
Taxable interest for individuals: $344 (reported on 6.1% of returns)
This zip code:
$344
New Jersey:
$2,193
(% of AGI for various income ranges: 0.2% for AGIs $75k-100k, 0.1% for AGIs $100k-200k)
Ordinary dividends: $954 (reported on 1.4% of returns)
Here:
$954
State:
$6,828
(% of AGI for various income ranges: 0.1% for AGIs $50k-75k, 0.2% for AGIs $100k-200k)
Profit/loss from business: +$7,782 (reported on 12.1% of returns)
Here:
+$7,782
State:
+$19,577
(% of AGI for various income ranges: 10.2% for AGIs below $25k, 0.9% for AGIs $25k-50k, 0.8% for AGIs $50k-75k, 0.3% for AGIs $75k-100k)
Taxable individual retirement arrangement distribution: $7,236 (reported on 1.2% of returns)
07522:
$7,236
New Jersey:
$18,214
(% of AGI for various income ranges: 0.3% for AGIs below $25k, 0.3% for AGIs $25k-50k, 0.7% for AGIs $50k-75k)
Total itemized deductions: $17,514 (35% of AGI, reported on 11.7% of returns)
Here:
$17,514
State:
$30,827
Here:
35.0% of AGI
State:
21.2% of AGI
(% of AGI for various income ranges: 3.8% for AGIs below $25k, 7.7% for AGIs $25k-50k, 11.4% for AGIs $50k-75k, 15.0% for AGIs $75k-100k, 15.3% for AGIs $100k-200k)
Charity contributions: $2,795 (reported on 8.0% of returns)
Here:
$2,795
State:
$3,451
(% of AGI for various income ranges: 0.2% for AGIs below $25k, 0.8% for AGIs $25k-50k, 1.3% for AGIs $50k-75k, 2.1% for AGIs $75k-100k, 2.3% for AGIs $100k-200k)
Taxes paid: $5,943 (reported on 11.6% of returns)
07522:
$5,943
State:
$15,801
(% of AGI for various income ranges: 1.3% for AGIs below $25k, 2.1% for AGIs $25k-50k, 4.1% for AGIs $50k-75k, 6.0% for AGIs $75k-100k, 6.5% for AGIs $100k-200k)
Earned income credit: $2,635 (reported on 45.7% of returns)
Here:
$2,635
State:
$2,182
(% of AGI for various income ranges: 12.5% for AGIs below $25k, 2.2% for AGIs $25k-50k)
Percentage of individuals using paid preparers for their 2012 taxes: 75.2%
Here:
75%
State:
65%
(% for various income ranges: 75.8% for AGIs below $25k, 74.5% for AGIs $25k-50k, 73.5% for AGIs $50k-75k, 76.5% for AGIs $75k-100k, 75.0% for AGIs $100k-200k)
Averages for the 2004 tax year for zip code 07522, filed in 2005:
Average Adjusted Gross Income (AGI) in 2004: $23,877 (Individual Income Tax Returns)
Here:
$23,877
State:
$64,921
Salary/wage: $23,900 (reported on 93.7% of returns)
Here:
$23,900
State:
$57,755
(% of AGI for various income ranges: 87.2% for AGIs below $10k, 91.5% for AGIs $10k-25k, 97.4% for AGIs $25k-50k, 95.6% for AGIs $50k-75k, 89.0% for AGIs $75k-100k, 79.8% for AGIs over 100k)
Taxable interest for individuals: $479 (reported on 13.1% of returns)
This zip code:
$479
New Jersey:
$2,068
(% of AGI for various income ranges: 0.5% for AGIs below $10k, 0.2% for AGIs $10k-25k, 0.2% for AGIs $25k-50k, 0.4% for AGIs $50k-75k, 0.8% for AGIs $75k-100k, 0.2% for AGIs over 100k)
Taxable dividends: $555 (reported on 2.6% of returns)
Here:
$555
State:
$3,959
(% of AGI for various income ranges: 0.3% for AGIs below $10k, 0.0% for AGIs $10k-25k, 0.0% for AGIs $25k-50k, 0.0% for AGIs $50k-75k, 0.2% for AGIs $75k-100k, 0.1% for AGIs over 100k)
Net capital gain/loss: +$5,186 (reported on 1.7% of returns)
Here:
+$5,186
State:
+$13,591
(% of AGI for various income ranges: -0.1% for AGIs below $10k, -0.0% for AGIs $10k-25k, 0.0% for AGIs $25k-50k, 0.4% for AGIs $50k-75k, 0.3% for AGIs $75k-100k, 9.5% for AGIs over 100k)
Profit/loss from business: +$6,332 (reported on 7.5% of returns)
Here:
+$6,332
State:
+$17,520
(% of AGI for various income ranges: 11.1% for AGIs below $10k, 3.7% for AGIs $10k-25k, 0.6% for AGIs $25k-50k, 0.6% for AGIs $50k-75k, 0.4% for AGIs $75k-100k)
IRA payment deduction: $1,565 (reported on 0.5% of returns)
07522:
$1,565
New Jersey:
$3,270
Total itemized deductions: $15,348 (36% of AGI, reported on 14.8% of returns)
Here:
$15,348
State:
$23,924
Here:
36.1% of AGI
State:
21.1% of AGI
(% of AGI for various income ranges: 6.7% for AGIs below $10k, 5.1% for AGIs $10k-25k, 10.0% for AGIs $25k-50k, 13.9% for AGIs $50k-75k, 14.0% for AGIs $75k-100k, 17.3% for AGIs over 100k)
Charity contributions deductions: $2,788 (6% of AGI, reported on 12.0% of returns)
Here:
$2,788
State:
$3,242
Here:
6.1% of AGI
State:
2.7% of AGI
(% of AGI for various income ranges: 0.3% for AGIs below $10k, 0.4% for AGIs $10k-25k, 1.4% for AGIs $25k-50k, 2.4% for AGIs $50k-75k, 2.9% for AGIs $75k-100k, 3.5% for AGIs over 100k)
Total tax: $2,323 (reported on 50.9% of returns)
07522:
$2,323
State:
$12,321
(% of AGI for various income ranges: 2.1% for AGIs below $10k, 2.2% for AGIs $10k-25k, 4.6% for AGIs $25k-50k, 8.0% for AGIs $50k-75k, 10.6% for AGIs $75k-100k, 12.9% for AGIs over 100k)
Earned income credit: $1,956 (reported on 44.1% of returns)
Here:
$1,956
State:
$1,711
Percentage of individuals using paid preparers for their 2004 taxes: 76.2%
Here:
76%
State:
65%
(% for various income ranges: 71.9% for AGIs below $10k, 79.6% for AGIs $10k-25k, 75.4% for AGIs $25k-50k, 75.9% for AGIs $50k-75k, 73.5% for AGIs $75k-100k, 69.2% for AGIs over 100k)
Likely homosexual households (counted as self-reported same-sex unmarried-partner households)
Lesbian couples: 0.1% of all households
Gay men: 0.0% of all households
Household received Food Stamps/SNAP in the past 12 months: 3,370 Household did not receive Food Stamps/SNAP in the past 12 months: 4,268
Women who had a birth in the past 12 months: 500 (248 now married, 244 unmarried) Women who did not have a birth in the past 12 months: 5,637 (1,335 now married, 4,324 unmarried)
Housing units in zip code 07522 with a mortgage: 1,030 (4 second mortgage) Median monthly owner costs for units with a mortgage: $2,111 Median monthly owner costs for units without a mortgage: $1,082
Residents with income below the poverty level in 2022:
This zip code:
28.9%
Whole state:
9.7%
Residents with income below 50% of the poverty level in 2022:
This zip code:
17.8%
Whole state:
5.2%
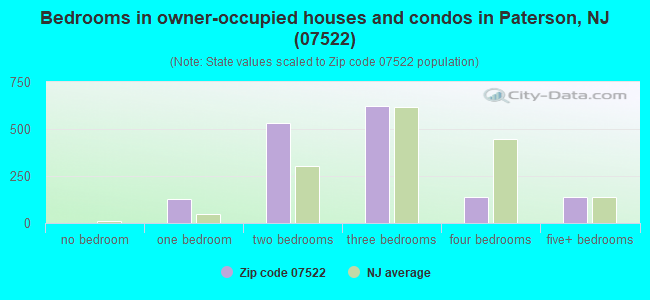
Median number of rooms in houses and condos:
Here:
5.7
State:
6.8
Median number of rooms in apartments:
Here:
4.1
State:
3.9
Notable locations in this zip code not listed on our city pages
Notable locations in zip code 07522: Paterson Engine House Number 8 (A), First Ward Branch Paterson Free Public Library (B), Paterson Fire Station Number 12 (C), Paterson Fire Department North Side Firehouse (D). Display/hide their locations on the map
Churches in zip code 07522 include: Saint Gerald Majella Roman Catholic Church (A), Gospel Tabernacle (B), Pentecostal Lighthouse Church (C), Bethel Christian Reformed Church (D), Kingdom Hall of Jehovahs Witnesses (E), German Seventh Day Adventist Church (F), Trinity Church (G), Memorial Church (H), Paterson Avenue Methodist Episcopal Church (I). Display/hide their locations on the map
In group quarters: 100 (-1 institutionalized population)
Size of family households: 1,460 2-persons, 1,396 3-persons, 1,350 4-persons, 782 5-persons, 353 6-persons, 145 7-or-more-persons
Size of nonfamily households: 1,403 1-person, 348 2-persons, 39 3-persons
1,753 married couples with children.
3,756 single-parent households (530 men, 3,226 women).
43.2% of residents of 07522 zip code speak English at home.
49.0% of residents speak Spanish at home (42% very well, 19% well, 25% not well, 14% not at all).
6.5% of residents speak other Indo-European language at home (48% very well, 20% well, 31% not well).
0.1% of residents speak Asian or Pacific Island language at home (100% very well).
1.2% of residents speak other language at home (46% very well, 31% well, 14% not well, 9% not at all).
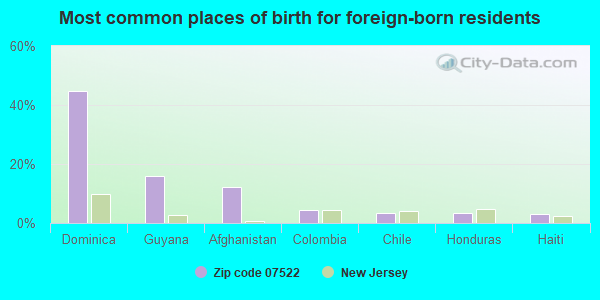
Foreign born population: 7,547 (33.7%) (42.3% of them are naturalized citizens)
Major facilities with environmental interests located in this zip code:
FACILE TECHNOLOGIES INC @ 185 6TH AVENUE (185 6TH AVENUE in PATERSON, NJ)
AIR SYNTHETIC MINOR (AIRS/AFS) (Integrated Compliance Information System) - ICIS-02-1989-0315, FORMAL ENFORCEMENT ACTION COMPLIANCE ACTIVITY (Tracking inspections of insecticide, fungicide, and rodenticide, and toxic substances) CRITERIA AND HAZARDOUS AIR POLLUTANT INVENTORY (Inventory of air pollution sources) STATE MASTER (New Jersey environmental info) - NJEMS-83306000000, RIGHT-TO-KNOW - RPPR & P2 PLANNING, NJEMS-002566, STATE CLEANUP SITE, NJEMS-30045, AIR PROGRAM, NJEMS-NJD002443513, HAZARDOUS WASTE PROGRAM (Resource Conservation and Recovery Act (tracking hazardous waste)) Business SIC classification: PLASTICS PRODUCTS; DRAWING AND INSULATING OF NONFERROUS WIRE; METAL FOIL AND LEAF Business NAICS classification: PLASTICS MATERIAL AND RESIN MANUFACTURING. Organizations: FACILE HOLDINGS INC, FACILE TECHNOLOGY Alternative names: FACILE HOLDINGS INCORPORATED, FACILE TECHNOLOGIES, INCORPORATION
A&B SCRAP CO (222 PRESIDENTIAL BLVD in PATERSON, NJ)
AIR MINOR (AIRS/AFS) - ICIS-, ENFORCEMENT/COMPLIANCE ACTIVITY STATE MASTER (New Jersey environmental info) - NJEMS-161449, STATE CLEANUP SITE, NJEMS-200980, REFUSE DISPOSAL, NJEMS-31925, AIR PROGRAM, NJEMS-44221000000, EPCRA, NJEMS-47531, National Pollutant Discharge Elimination System Permit National Pollutant Discharge Elimination System NON-MAJOR (Tracking pollutant discharge elimination systems) - permit Business SIC classification: SCRAP AND WASTE MATERIALS; SERVICES Organizations: MARTIN SCHLAMOWITZ (CONTACT/OWNER)
, SCHLAMOWITZ MARTIN (CONTACT/OWNER)
PATERSON CITY BD OF ED JOHN F KENNEDY SCHOOL (61-127 PREAKNESS AVE in PATERSON, NJ)
(National Center for Education Statistics) - STATE ID-030 STATE MASTER (New Jersey environmental info) - NJEMS-31113, AIR PROGRAM, NJEMS-NL000700, PESTICIDES - APPLICATION (Resource Conservation and Recovery Act (tracking hazardous waste)) Business SIC classification: ELEMENTARY AND SECONDARY SCHOOLS Alternative names: JOHN F KENNEDY HIGH SCHOOL
PLAZA CLEANERS (160 W BROADWAY in PATERSON, NJ)
AIR MINOR (AIRS/AFS) (Integrated Compliance Information System) - ICIS-02-1999-1016, FORMAL ENFORCEMENT ACTION STATE MASTER (New Jersey environmental info) - NJEMS-00000000407, EPCRA, NJEMS-L3095, AIR PROGRAM Business SIC classification: DRYCLEANING PLANTS, EXCEPT RUG CLEANING
PATERSON CITY BD OF ED SCHOOL #17 (112 N 5TH ST in PATERSON CITY, NJ)
(National Center for Education Statistics) - STATE ID-210 STATE MASTER (New Jersey environmental info) - NJEMS-017773, STATE CLEANUP SITE, NJEMS-31130, AIR PROGRAM, NJEMS-NRG000000580, HAZARDOUS WASTE PROGRAM, NJEMS-4010-210-31, PESTICIDES - APPLICATION Business SIC classification: ELEMENTARY AND SECONDARY SCHOOLS
PATERSON CITY BD OF ED SCHOOL #4 (55 CLINTON ST in PATERSON CITY, NJ)
(National Center for Education Statistics) - STATE ID-080 STATE MASTER (New Jersey environmental info) - NJEMS-017761, STATE CLEANUP SITE, NJEMS-31132, AIR PROGRAM, NJEMS-NRG000000583, HAZARDOUS WASTE PROGRAM, NJEMS-4010-080-31, PESTICIDES - APPLICATION Business SIC classification: ELEMENTARY AND SECONDARY SCHOOLS
ALPART SCRAP IRON & METAL CO (148 EAST HOLSMAN STREET in PATERSON, NJ)
STATE MASTER (New Jersey environmental info) - NJEMS-14956800000, EPCRA, NJEMS-207017, REFUSE DISPOSAL, NJEMS-47523, National Pollutant Discharge Elimination System Permit, NJEMS-NRG000000126, HAZARDOUS WASTE PROGRAM National Pollutant Discharge Elimination System NON-MAJOR (Tracking pollutant discharge elimination systems) - permit Business SIC classification: SCRAP AND WASTE MATERIALS Organizations: ALPART SCRAP IRON CO, ALPART SCRAP IRON & METALS INC, DAVID KUTNER (CONTACT/OWNER)
, KUTNER DAVID (CONTACT/OWNER)
Alternative names: ALPART SCRAP IRON CO
PARMA DISMANTLING INC (251 PRESIDENTIAL BLVD in PATERSON, NJ)
STATE MASTER (New Jersey environmental info) - NJEMS-217799, National Pollutant Discharge Elimination System Permit National Pollutant Discharge Elimination System NON-MAJOR (Tracking pollutant discharge elimination systems) - permit Business SIC classification: MOTOR VEHICLE PARTS, USED
HAYDON CORP (2 JASPER ST in PATERSON, NJ)
COMPLIANCE ACTIVITY (Tracking inspections of insecticide, fungicide, and rodenticide, and toxic substances) STATE MASTER (New Jersey environmental info) - NJEMS-217149, STATE CLEANUP SITE, NJEMS-217684, GROUND WATER PROGRAM, NJEMS-31770, AIR PROGRAM, NJEMS-70621701000, EPCRA, NJEMS-NRG000000537, HAZARDOUS WASTE PROGRAM (Resource Conservation and Recovery Act (tracking hazardous waste)) Business SIC classification: COLD-ROLLED STEEL SHEET, STRIP, AND BARS; STEEL PIPE AND TUBES; HEATING EQUIPMENT, EXCEPT ELECTRIC AND WARM AIR FURNACES; MISCELLANEOUS STRUCTURAL METALWORK Organizations: NON NOTIFIER (CONTACT/OWNER)
AHART CHEMICAL CO (146 N 1ST ST in PATERSON, NJ)
STATE MASTER (New Jersey environmental info) - NJEMS-10197500000, EPCRA, NJEMS-31728, AIR PROGRAM, NJEMS-G000011824, STATE CLEANUP SITE, NJEMS-NRG200000029, HAZARDOUS WASTE PROGRAM (Resource Conservation and Recovery Act (tracking hazardous waste)) Business SIC classification: CHEMICALS AND ALLIED PRODUCTS Organizations: NON REGULATED (CONTACT/OWNER)
480 TORRES SERVICE STATION (480 UNION AVE in PATERSON CITY, NJ)
ENFORCEMENT/COMPLIANCE ACTIVITY (Integrated Compliance Information System) STATE MASTER (New Jersey environmental info) - NJEMS-016885, STATE CLEANUP SITE, NJEMS-A3422, AIR PROGRAM Business SIC classification: GASOLINE SERVICE STATIONS Organizations: TORRES LILA (CONTACT/OWNER)
BEAMAR ELECTRONICS (114 KEARNEY STREET in PATERSON, NJ)
STATE MASTER (New Jersey environmental info) - NJEMS-G000005594, STATE CLEANUP SITE (Resource Conservation and Recovery Act (tracking hazardous waste))
PATERSON CITY RYLE ROAD ILLEGAL DUMP (RYLE ROAD in PATERSON CITY, NJ)
STATE MASTER (New Jersey environmental info) - NJEMS-133650, REFUSE DISPOSAL, NJEMS-G000021833, STATE CLEANUP SITE Small Quantity Generators, between 100 kg and 1000 kg of hazardous waste/month (Resource Conservation and Recovery Act (tracking hazardous waste)) Alternative names: PATERSON CITY OF - RYLE ROAD DUMP SITE
Housing units lacking complete plumbing facilities: 0.5% Housing units lacking complete kitchen facilities: 2.4%
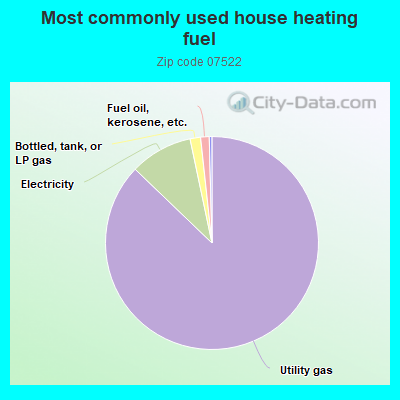
87.1%Utility gas
9.5%Electricity
1.6%Bottled, tank, or LP gas
1.3%Fuel oil, kerosene, etc.
Population in 1990: 21,813.
Place of birth for U.S.-born residents:
This state: 11,989
Northeast: 704
Midwest: 48
South: 831
West: 78
57% of the 07522 zip code residents lived in the same house 5 years ago. Out of people who lived in different houses, 89% lived in this county. Out of people who lived in different counties, 50% lived in New Jersey.
93% of the 07522 zip code residents lived in the same house 1 year ago. Out of people who lived in different houses, 73% moved from this county. Out of people who lived in different houses, 6% moved from different county within same state. Out of people who lived in different houses, 8% moved from different state. Out of people who lived in different houses, 12% moved from abroad.
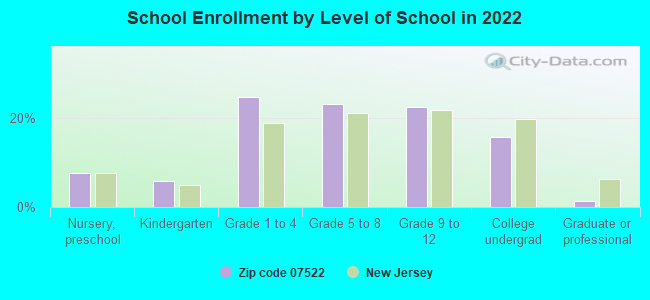
Private vs. public school enrollment:
Students in private schools in grades 1 to 8 (elementary and middle school): 50
Here:
1.8%
New Jersey:
12.3%
Students in private schools in grades 9 to 12 (high school): 36
Here:
2.7%
New Jersey:
13.1%
Students in private undergraduate colleges: 129
Here:
14.1%
New Jersey:
33.2%
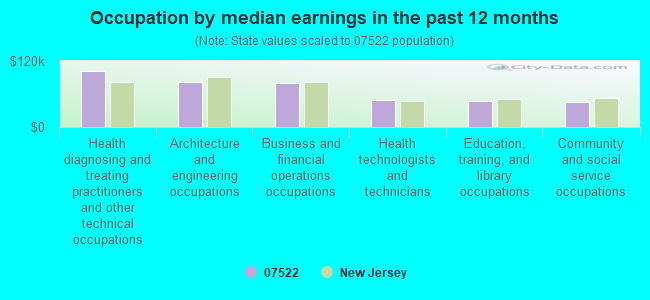
Occupation by median earnings in the past 12 months ($)
101,217Health diagnosing and treating practitioners and other technical occupations
81,755Architecture and engineering occupations
79,432Business and financial operations occupations
49,877Health technologists and technicians
47,967Education, training, and library occupations
45,130Community and social service occupations
Companies with federal contracts located in this zip code:
VISION LIGHTING INC (48 NORTH 2ND STREET in PATERSON, NJ; small business) : $2,867,521 in 15 contractsfrom 2000 to 2004
Contracts for Prefabricated and Portable Buildings, Miscellaneous Maintenance and Repair Shop Specialized Equipment, Electrical Hardware and Supplies, Cable, Cord, and Wire Assemblies: Communications Equipment by Air Force, Army Signed by year:2000: $190,010; 2001: $0; 2002: $1,361,391; 2003: $642,600; 2004: $673,520; 2005: $0; 2006: $0.
Biggest contracts:
$484,166 with Air Force for Prefabricated and Portable Buildings. Signed on 2002-03-15. Completion date: 2002-09-30.
$413,600, same as above.Signed on 2004-03-12. Completion date: 2004-08-31.
$394,080 with Air Force for Miscellaneous Maintenance and Repair Shop Specialized Equipment. Signed on 2003-12-12. Completion date: 2004-06-30.
$330,560, same as above.Signed on 2002-12-02. Completion date: 2003-05-31.
ELECTRONIC TRANSFORMER CORP (460 TOTOWA AVE in PATERSON, NJ; small business) : $1,397,499 in 184 contractsfrom 2002 to 2006
Contracts for Coils and Transformers, Engine Electrical System Components, Aircraft Prime Moving, Launchers, Torpedo and Depth Charge, Refrigeration and Air Conditioning Components by Navy, Defense Logistics Agency, U.S. Coast Guard, Air Force, and others Signed by year:2000: $0; 2001: $0; 2002: $100,079; 2003: $90,033; 2004: $281,528; 2005: $592,216; 2006: $333,643.
Biggest contracts:
$55,630 with Navy for Coils and Transformers. Signed on 2003-02-12. Completion date: 2003-06-12.
$39,600 with Defense Logistics Agency for Coils and Transformers. Signed on 2004-03-02. Completion date: 2004-08-29.
$36,594, same as above.Signed on 2002-07-11. Completion date: 2002-07-11.
$34,403, same as above.Signed on 2003-10-14. Completion date: 2004-01-12.
TABLECLOTH CO INC (514 TOTOWA AVE in PATERSON, NJ; small business) : $24,783 in 2 contractsfrom 2004 to 2005
$21,400 with Air Force for Miscellaneous Items. Signed on 2005-09-13. Completion date: 2005-08-27.
$3,383 with Army for Household Furnishings. Signed on 2004-03-22. Completion date: 2004-04-16.
Top industries in this zip code by the number of employees in 2005:
Accommodation and Food Services: Caterers (100-249 employees: 1 establishment)
Other Services (except Public Administration): Religious Organizations (20-49: 1, 10-19: 1, 5-9: 3, 1-4: 4)
Health Care and Social Assistance: Child Day Care Services (20-49: 2, 1-4: 3)
Professional, Scientific, and Technical Services: Environmental Consulting Services (50-99: 1)
Health Care and Social Assistance: All Other Outpatient Care Centers (50-99: 1)
Health Care and Social Assistance: Nursing Care Facilities (20-49: 1, 1-4: 1)
People in group quarters in 2010:
55 people in other noninstitutional facilities
47 people in nursing facilities/skilled-nursing facilities
People in group quarters in 2000:
103 people in other noninstitutional group quarters
37 people in nursing homes
11 people in religious group quarters
Fatal accident statistics in 2014:
Fatal accident count: 1
Vehicles involved in fatal accidents: 1
Fatal accidents caused by drunken drivers: 1
Fatalities: 2
Persons involved in fatal accidents: 4
Pedestrians involved in fatal accidents: 0
Fatal accident statistics in 2013:
Fatal accident count: 1
Vehicles involved in fatal accidents: 1
Fatal accidents caused by drunken drivers: 0
Fatalities: 1
Persons involved in fatal accidents: 1
Pedestrians involved in fatal accidents: 1
Home Mortgage Disclosure Act Aggregated Statistics For Year 2009 (Based on 4 full and 8 partial tracts)
A) FHA, FSA/RHS & VA Home Purchase Loans
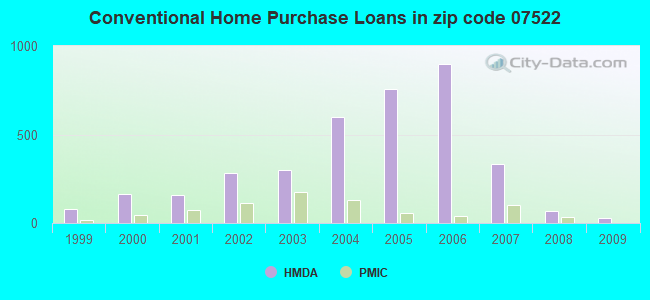
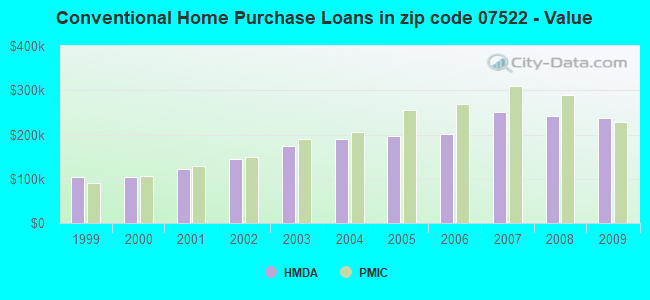
B) Conventional Home Purchase Loans
C) Refinancings
D) Home Improvement Loans
E) Loans on Dwellings For 5+ Families
F) Non-occupant Loans on < 5 Family Dwellings (A B C & D)
G) Loans On Manufactured Home Dwelling (A B C & D)
Number
Average Value
Number
Average Value
Number
Average Value
Number
Average Value
Number
Average Value
Number
Average Value
Number
Average Value
LOANS ORIGINATED
89
$203,125
27
$236,471
175
$245,970
12
$113,916
8
$8,737,548
27
$234,626
2
$220,625
APPLICATIONS APPROVED, NOT ACCEPTED
18
$192,893
5
$161,740
20
$219,330
1
$11,330
0
$0
0
$0
0
$0
APPLICATIONS DENIED
41
$221,985
50
$215,967
183
$225,072
43
$64,850
2
$199,660
53
$188,182
0
$0
APPLICATIONS WITHDRAWN
22
$210,781
19
$307,376
70
$228,439
3
$14,423
2
$314,465
2
$397,240
0
$0
FILES CLOSED FOR INCOMPLETENESS
13
$240,198
2
$348,420
27
$280,190
2
$73,055
0
$0
0
$0
0
$0
Aggregated Statistics For Year 2008 (Based on 4 full and 8 partial tracts)
A) FHA, FSA/RHS & VA Home Purchase Loans
B) Conventional Home Purchase Loans
C) Refinancings
D) Home Improvement Loans
E) Loans on Dwellings For 5+ Families
F) Non-occupant Loans on < 5 Family Dwellings (A B C & D)
G) Loans On Manufactured Home Dwelling (A B C & D)
Number
Average Value
Number
Average Value
Number
Average Value
Number
Average Value
Number
Average Value
Number
Average Value
Number
Average Value
LOANS ORIGINATED
64
$274,144
68
$242,935
235
$253,790
26
$67,369
10
$1,127,400
73
$220,960
0
$0
APPLICATIONS APPROVED, NOT ACCEPTED
8
$254,896
36
$222,698
97
$243,779
9
$87,984
4
$16,379,175
31
$236,263
0
$0
APPLICATIONS DENIED
50
$298,888
83
$256,912
333
$242,633
78
$84,382
6
$346,945
85
$220,394
2
$35,770
APPLICATIONS WITHDRAWN
23
$309,466
14
$280,976
104
$243,158
8
$135,725
0
$0
12
$200,247
0
$0
FILES CLOSED FOR INCOMPLETENESS
2
$256,295
11
$249,075
44
$261,401
0
$0
0
$0
12
$218,783
0
$0
Aggregated Statistics For Year 2007 (Based on 4 full and 8 partial tracts)
A) FHA, FSA/RHS & VA Home Purchase Loans
B) Conventional Home Purchase Loans
C) Refinancings
D) Home Improvement Loans
E) Loans on Dwellings For 5+ Families
F) Non-occupant Loans on < 5 Family Dwellings (A B C & D)
Number
Average Value
Number
Average Value
Number
Average Value
Number
Average Value
Number
Average Value
Number
Average Value
LOANS ORIGINATED
59
$370,549
331
$250,675
532
$248,199
67
$95,168
12
$339,918
120
$208,869
APPLICATIONS APPROVED, NOT ACCEPTED
2
$248,845
121
$203,992
172
$238,900
27
$90,396
0
$0
40
$220,255
APPLICATIONS DENIED
9
$269,961
359
$258,485
590
$247,578
148
$84,769
7
$321,007
139
$242,414
APPLICATIONS WITHDRAWN
25
$318,307
114
$240,528
190
$243,227
21
$175,647
0
$0
51
$243,635
FILES CLOSED FOR INCOMPLETENESS
0
$0
25
$222,910
98
$266,717
6
$33,627
0
$0
5
$266,990
Aggregated Statistics For Year 2006 (Based on 4 full and 8 partial tracts)
A) FHA, FSA/RHS & VA Home Purchase Loans
B) Conventional Home Purchase Loans
C) Refinancings
D) Home Improvement Loans
E) Loans on Dwellings For 5+ Families
F) Non-occupant Loans on < 5 Family Dwellings (A B C & D)
G) Loans On Manufactured Home Dwelling (A B C & D)
Number
Average Value
Number
Average Value
Number
Average Value
Number
Average Value
Number
Average Value
Number
Average Value
Number
Average Value
LOANS ORIGINATED
33
$311,866
899
$201,269
896
$233,789
138
$105,221
19
$409,553
257
$221,206
0
$0
APPLICATIONS APPROVED, NOT ACCEPTED
2
$419,455
137
$195,954
203
$220,477
38
$87,690
0
$0
44
$198,752
0
$0
APPLICATIONS DENIED
9
$319,763
516
$197,375
593
$238,223
167
$82,269
10
$331,907
160
$243,590
4
$70,180
APPLICATIONS WITHDRAWN
13
$298,631
246
$194,939
279
$225,391
16
$55,214
8
$252,005
61
$207,526
0
$0
FILES CLOSED FOR INCOMPLETENESS
2
$465,270
51
$228,765
77
$239,171
4
$232,378
0
$0
10
$246,711
2
$282,375
Aggregated Statistics For Year 2005 (Based on 4 full and 8 partial tracts)
A) FHA, FSA/RHS & VA Home Purchase Loans
B) Conventional Home Purchase Loans
C) Refinancings
D) Home Improvement Loans
E) Loans on Dwellings For 5+ Families
F) Non-occupant Loans on < 5 Family Dwellings (A B C & D)
G) Loans On Manufactured Home Dwelling (A B C & D)
Number
Average Value
Number
Average Value
Number
Average Value
Number
Average Value
Number
Average Value
Number
Average Value
Number
Average Value
LOANS ORIGINATED
48
$272,033
758
$196,230
902
$202,469
120
$103,430
18
$367,980
330
$213,399
1
$180,120
APPLICATIONS APPROVED, NOT ACCEPTED
4
$245,300
122
$209,029
163
$191,521
35
$86,600
2
$191,930
80
$204,152
0
$0
APPLICATIONS DENIED
11
$255,221
397
$184,748
613
$199,666
136
$84,033
11
$319,086
201
$213,875
6
$128,043
APPLICATIONS WITHDRAWN
7
$215,691
225
$191,373
339
$196,159
56
$188,708
2
$109,050
137
$207,716
0
$0
FILES CLOSED FOR INCOMPLETENESS
2
$265,815
63
$188,367
201
$193,042
4
$115,300
0
$0
13
$229,924
0
$0
Aggregated Statistics For Year 2004 (Based on 4 full and 8 partial tracts)
A) FHA, FSA/RHS & VA Home Purchase Loans
B) Conventional Home Purchase Loans
C) Refinancings
D) Home Improvement Loans
E) Loans on Dwellings For 5+ Families
F) Non-occupant Loans on < 5 Family Dwellings (A B C & D)
G) Loans On Manufactured Home Dwelling (A B C & D)
Number
Average Value
Number
Average Value
Number
Average Value
Number
Average Value
Number
Average Value
Number
Average Value
Number
Average Value
LOANS ORIGINATED
115
$238,976
599
$189,482
755
$178,031
91
$80,717
16
$239,966
332
$181,623
0
$0
APPLICATIONS APPROVED, NOT ACCEPTED
22
$236,050
112
$234,436
151
$173,769
29
$93,970
2
$43,620
72
$190,025
0
$0
APPLICATIONS DENIED
27
$240,737
248
$204,879
487
$163,669
118
$61,002
10
$198,859
122
$195,449
2
$11,025
APPLICATIONS WITHDRAWN
33
$220,875
168
$206,704
266
$170,032
28
$77,855
4
$635,872
76
$184,708
0
$0
FILES CLOSED FOR INCOMPLETENESS
6
$234,068
32
$183,250
94
$175,693
4
$36,642
0
$0
22
$174,992
0
$0
Aggregated Statistics For Year 2003 (Based on 4 full and 8 partial tracts)
A) FHA, FSA/RHS & VA Home Purchase Loans
B) Conventional Home Purchase Loans
C) Refinancings
D) Home Improvement Loans
E) Loans on Dwellings For 5+ Families
F) Non-occupant Loans on < 5 Family Dwellings (A B C & D)
Number
Average Value
Number
Average Value
Number
Average Value
Number
Average Value
Number
Average Value
Number
Average Value
LOANS ORIGINATED
170
$188,104
300
$173,125
860
$149,214
61
$29,653
17
$274,719
205
$139,085
APPLICATIONS APPROVED, NOT ACCEPTED
8
$124,475
63
$166,073
249
$136,178
29
$24,679
3
$160,670
37
$128,326
APPLICATIONS DENIED
30
$210,625
121
$174,369
705
$147,821
78
$32,565
6
$205,965
119
$151,806
APPLICATIONS WITHDRAWN
18
$183,029
84
$172,771
299
$147,737
16
$32,633
3
$148,707
74
$137,435
FILES CLOSED FOR INCOMPLETENESS
6
$182,527
11
$160,384
35
$142,368
5
$39,294
0
$0
6
$103,827
Aggregated Statistics For Year 2002 (Based on 4 full and 8 partial tracts)
A) FHA, FSA/RHS & VA Home Purchase Loans
B) Conventional Home Purchase Loans
C) Refinancings
D) Home Improvement Loans
E) Loans on Dwellings For 5+ Families
F) Non-occupant Loans on < 5 Family Dwellings (A B C & D)
Number
Average Value
Number
Average Value
Number
Average Value
Number
Average Value
Number
Average Value
Number
Average Value
LOANS ORIGINATED
122
$163,441
284
$145,573
521
$125,544
113
$22,968
8
$162,239
149
$117,124
APPLICATIONS APPROVED, NOT ACCEPTED
20
$164,411
62
$146,422
158
$113,250
35
$22,893
4
$145,100
34
$109,976
APPLICATIONS DENIED
9
$134,009
87
$128,581
461
$116,854
131
$27,120
2
$213,225
83
$95,662
APPLICATIONS WITHDRAWN
16
$156,564
47
$119,215
216
$129,649
15
$43,910
1
$79,300
22
$128,672
FILES CLOSED FOR INCOMPLETENESS
5
$160,020
11
$176,789
199
$125,558
0
$0
0
$0
12
$111,416
Aggregated Statistics For Year 2001 (Based on 4 full and 8 partial tracts)
A) FHA, FSA/RHS & VA Home Purchase Loans
B) Conventional Home Purchase Loans
C) Refinancings
D) Home Improvement Loans
E) Loans on Dwellings For 5+ Families
F) Non-occupant Loans on < 5 Family Dwellings (A B C & D)
Number
Average Value
Number
Average Value
Number
Average Value
Number
Average Value
Number
Average Value
Number
Average Value
LOANS ORIGINATED
182
$143,517
158
$122,536
373
$117,814
88
$21,755
22
$389,769
88
$98,986
APPLICATIONS APPROVED, NOT ACCEPTED
21
$149,783
27
$116,027
98
$102,637
37
$17,916
0
$0
21
$96,772
APPLICATIONS DENIED
41
$166,437
52
$127,287
417
$88,047
231
$22,599
1
$93,460
42
$96,719
APPLICATIONS WITHDRAWN
28
$133,370
23
$143,895
199
$108,096
28
$23,361
1
$84,960
14
$100,656
FILES CLOSED FOR INCOMPLETENESS
16
$146,293
6
$107,765
89
$114,770
6
$18,873
0
$0
6
$96,665
Aggregated Statistics For Year 2000 (Based on 4 full and 8 partial tracts)
A) FHA, FSA/RHS & VA Home Purchase Loans
B) Conventional Home Purchase Loans
C) Refinancings
D) Home Improvement Loans
E) Loans on Dwellings For 5+ Families
F) Non-occupant Loans on < 5 Family Dwellings (A B C & D)
Number
Average Value
Number
Average Value
Number
Average Value
Number
Average Value
Number
Average Value
Number
Average Value
LOANS ORIGINATED
107
$131,596
162
$103,616
180
$83,854
80
$22,991
4
$154,848
55
$96,409
APPLICATIONS APPROVED, NOT ACCEPTED
22
$138,184
27
$102,764
59
$96,789
79
$16,484
0
$0
16
$91,018
APPLICATIONS DENIED
26
$114,683
75
$105,509
399
$75,839
179
$25,489
0
$0
60
$75,294
APPLICATIONS WITHDRAWN
25
$127,113
41
$93,712
155
$79,593
28
$19,759
0
$0
16
$94,849
FILES CLOSED FOR INCOMPLETENESS
7
$126,826
1
$91,190
186
$111,886
4
$44,232
0
$0
10
$104,464
Aggregated Statistics For Year 1999 (Based on 2 full and 4 partial tracts)
A) FHA, FSA/RHS & VA Home Purchase Loans
B) Conventional Home Purchase Loans
C) Refinancings
D) Home Improvement Loans
E) Loans on Dwellings For 5+ Families
F) Non-occupant Loans on < 5 Family Dwellings (A B C & D)
2002 - 2018 National Fire Incident Reporting System (NFIRS) incidents
Based on the data from the years 2002 - 2018 the average number of fire incidents per year is 15. The highest number of reported fire incidents - 61 took place in 2003, and the least - 0 in 2004. The data has a dropping trend.
When looking into fire subcategories, the most incidents belonged to: Structure Fires (48.6%), and Other (22.4%).
Fire incident types reported to NFIRS in Zip Code 07522


 Nearest zip codes: 07505, 07501, 07502, 07524, 07508, 07514.
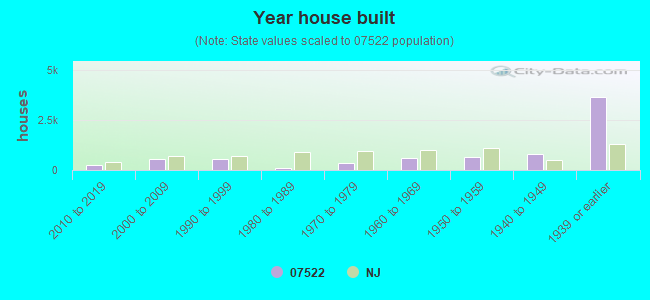


 Based on the data from the years 2002 - 2018 the average number of fire incidents per year is 15. The highest number of reported fire incidents - 61 took place in 2003, and the least - 0 in 2004. The data has a dropping trend.
 When looking into fire subcategories, the most incidents belonged to: Structure Fires (48.6%), and Other (22.4%).