Races in Orland Park, Illinois (IL) Detailed Stats
Data:
Races - White alone (%)
Races - White alone (% change since 2000)
Races - Black alone (%)
Races - Black alone (% change since 2000)
Races - American Indian alone (%)
Races - American Indian alone (% change since 2000)
Races - Asian alone (%)
Races - Asian alone (% change since 2000)
Races - Hispanic (%)
Races - Hispanic (% change since 2000)
Races - Native Hawaiian and Other Pacific Islander alone (%)
Races - Native Hawaiian and Other Pacific Islander alone (% change since 2000)
Races - Two or more races(%)
Races - Two or more races(% change since 2000)
Races - Other race alone (%)
Races - Other race alone (% change since 2000)
Racial diversity
Place of birth - Born in state of residence (%)
Place of birth - Born in state of residence (%) - White
Place of birth - Born in state of residence (%) - Black or African American
Place of birth - Born in state of residence (%) - Asian
Place of birth - Born in state of residence (%) - Hispanic or Latino
Place of birth - Born in state of residence (%) - American Indian and Alaska Native
Place of birth - Born in state of residence (%) - Multirace
Place of birth - Born in state of residence (%) - Other Race
Place of birth - Born in other state (%)
Place of birth - Born in other state (%) - White
Place of birth - Born in other state (%) - Black or African American
Place of birth - Born in other state (%) - Asian
Place of birth - Born in other state (%) - Hispanic or Latino
Place of birth - Born in other state (%) - American Indian and Alaska Native
Place of birth - Born in other state (%) - Multirace
Place of birth - Born in other state (%) - Other Race
Place of birth - Native, outside of US (%)
Place of birth - Native, outside of US (%) - White
Place of birth - Native, outside of US (%) - Black or African American
Place of birth - Native, outside of US (%) - Asian
Place of birth - Native, outside of US (%) - Hispanic or Latino
Place of birth - Native, outside of US (%) - American Indian and Alaska Native
Place of birth - Native, outside of US (%) - Multirace
Place of birth - Native, outside of US (%) - Other Race
Place of birth - Foreign born (%)
Place of birth - Foreign born (%) - White
Place of birth - Foreign born (%) - Black or African American
Place of birth - Foreign born (%) - Asian
Place of birth - Foreign born (%) - Hispanic or Latino
Place of birth - Foreign born (%) - American Indian and Alaska Native
Place of birth - Foreign born (%) - Multirace
Place of birth - Foreign born (%) - Other Race
Residents speaking English at home (%)
Residents speaking English at home - Born in the United States (%)
Residents speaking English at home - Native, born elsewhere (%)
Residents speaking English at home - Foreign born (%)
Residents speaking Spanish at home (%)
Residents speaking Spanish at home - Born in the United States (%)
Residents speaking Spanish at home - Native, born elsewhere (%)
Residents speaking Spanish at home - Foreign born (%)
Residents speaking other language at home (%)
Residents speaking other language at home - Born in the United States (%)
Residents speaking other language at home - Native, born elsewhere (%)
Residents speaking other language at home - Foreign born (%)
Marital status - Never married (%)
Marital status - Now married (%)
Marital status - Separated (%)
Marital status - Widowed (%)
Marital status - Divorced (%)
Ancestries Reported - Arab (%)
Ancestries Reported - Czech (%)
Ancestries Reported - Danish (%)
Ancestries Reported - Dutch (%)
Ancestries Reported - English (%)
Ancestries Reported - French (%)
Ancestries Reported - French Canadian (%)
Ancestries Reported - German (%)
Ancestries Reported - Greek (%)
Ancestries Reported - Hungarian (%)
Ancestries Reported - Irish (%)
Ancestries Reported - Italian (%)
Ancestries Reported - Lithuanian (%)
Ancestries Reported - Norwegian (%)
Ancestries Reported - Polish (%)
Ancestries Reported - Portuguese (%)
Ancestries Reported - Russian (%)
Ancestries Reported - Scotch-Irish (%)
Ancestries Reported - Scottish (%)
Ancestries Reported - Slovak (%)
Ancestries Reported - Subsaharan African (%)
Ancestries Reported - Swedish (%)
Ancestries Reported - Swiss (%)
Ancestries Reported - Ukrainian (%)
Ancestries Reported - United States (%)
Ancestries Reported - Welsh (%)
Ancestries Reported - West Indian (%)
Ancestries Reported - Other (%)
Geographical mobility - Same house 1 year ago (%)
Geographical mobility - Same house 1 year ago (%) - White
Geographical mobility - Same house 1 year ago (%) - Black or African American
Geographical mobility - Same house 1 year ago (%) - Asian
Geographical mobility - Same house 1 year ago (%) - Hispanic or Latino
Geographical mobility - Same house 1 year ago (%) - American Indian and Alaska Native
Geographical mobility - Same house 1 year ago (%) - Multirace
Geographical mobility - Same house 1 year ago (%) - Other Race
Geographical mobility - Moved within same county (%)
Geographical mobility - Moved within same county (%) - White
Geographical mobility - Moved within same county (%) - Black or African American
Geographical mobility - Moved within same county (%) - Asian
Geographical mobility - Moved within same county (%) - Hispanic or Latino
Geographical mobility - Moved within same county (%) - American Indian and Alaska Native
Geographical mobility - Moved within same county (%) - Multirace
Geographical mobility - Moved within same county (%) - Other Race
Geographical mobility - Moved from different county within same state (%)
Geographical mobility - Moved from different county within same state (%) - White
Geographical mobility - Moved from different county within same state (%) - Black or African American
Geographical mobility - Moved from different county within same state (%) - Asian
Geographical mobility - Moved from different county within same state (%) - Hispanic or Latino
Geographical mobility - Moved from different county within same state (%) - American Indian and Alaska Native
Geographical mobility - Moved from different county within same state (%) - Multirace
Geographical mobility - Moved from different county within same state (%) - Other Race
Geographical mobility - Moved from different state (%)
Geographical mobility - Moved from different state (%) - White
Geographical mobility - Moved from different state (%) - Black or African American
Geographical mobility - Moved from different state (%) - Asian
Geographical mobility - Moved from different state (%) - Hispanic or Latino
Geographical mobility - Moved from different state (%) - American Indian and Alaska Native
Geographical mobility - Moved from different state (%) - Multirace
Geographical mobility - Moved from different state (%) - Other Race
Geographical mobility - Moved from abroad (%)
Geographical mobility - Moved from abroad (%) - White
Geographical mobility - Moved from abroad (%) - Black or African American
Geographical mobility - Moved from abroad (%) - Asian
Geographical mobility - Moved from abroad (%) - Hispanic or Latino
Geographical mobility - Moved from abroad (%) - American Indian and Alaska Native
Geographical mobility - Moved from abroad (%) - Multirace
Geographical mobility - Moved from abroad (%) - Other Race
Place of birth for the foreign-born population - Ireland (%)
Place of birth for the foreign-born population - Denmark (%)
Place of birth for the foreign-born population - Norway (%)
Place of birth for the foreign-born population - Sweden (%)
Place of birth for the foreign-born population - United Kingdom (%)
Place of birth for the foreign-born population - England (%)
Place of birth for the foreign-born population - Scotland (%)
Place of birth for the foreign-born population - Other Northern Europe (%)
Place of birth for the foreign-born population - Austria (%)
Place of birth for the foreign-born population - Belgium (%)
Place of birth for the foreign-born population - France (%)
Place of birth for the foreign-born population - Germany (%)
Place of birth for the foreign-born population - Netherlands (%)
Place of birth for the foreign-born population - Switzerland (%)
Place of birth for the foreign-born population - Other Western Europe (%)
Place of birth for the foreign-born population - Greece (%)
Place of birth for the foreign-born population - Italy (%)
Place of birth for the foreign-born population - Portugal (%)
Place of birth for the foreign-born population - Spain (%)
Place of birth for the foreign-born population - Other Southern Europe (%)
Place of birth for the foreign-born population - Albania (%)
Place of birth for the foreign-born population - Belarus (%)
Place of birth for the foreign-born population - Bosnia and Herzegovina (%)
Place of birth for the foreign-born population - Bulgaria (%)
Place of birth for the foreign-born population - Croatia (%)
Place of birth for the foreign-born population - Czechoslovakia (%)
Place of birth for the foreign-born population - Hungary (%)
Place of birth for the foreign-born population - Latvia (%)
Place of birth for the foreign-born population - Lithuania (%)
Place of birth for the foreign-born population - North Macedonia (Macedonia) (%)
Place of birth for the foreign-born population - Moldova (%)
Place of birth for the foreign-born population - Poland (%)
Place of birth for the foreign-born population - Romania (%)
Place of birth for the foreign-born population - Russia (%)
Place of birth for the foreign-born population - Serbia (%)
Place of birth for the foreign-born population - Ukraine (%)
Place of birth for the foreign-born population - Other Eastern Europe (%)
Place of birth for the foreign-born population - China (%)
Place of birth for the foreign-born population - Hong Kong (%)
Place of birth for the foreign-born population - Taiwan (%)
Place of birth for the foreign-born population - Japan (%)
Place of birth for the foreign-born population - Korea (%)
Place of birth for the foreign-born population - Other Eastern Asia (%)
Place of birth for the foreign-born population - Afghanistan (%)
Place of birth for the foreign-born population - Bangladesh (%)
Place of birth for the foreign-born population - India (%)
Place of birth for the foreign-born population - Iran (%)
Place of birth for the foreign-born population - Kazakhstan (%)
Place of birth for the foreign-born population - Nepal (%)
Place of birth for the foreign-born population - Pakistan (%)
Place of birth for the foreign-born population - Sri Lanka (%)
Place of birth for the foreign-born population - Uzbekistan (%)
Place of birth for the foreign-born population - Other South Central Asia (%)
Place of birth for the foreign-born population - Burma (%)
Place of birth for the foreign-born population - Cambodia (%)
Place of birth for the foreign-born population - Indonesia (%)
Place of birth for the foreign-born population - Laos (%)
Place of birth for the foreign-born population - Malaysia (%)
Place of birth for the foreign-born population - Philippines (%)
Place of birth for the foreign-born population - Singapore (%)
Place of birth for the foreign-born population - Thailand (%)
Place of birth for the foreign-born population - Vietnam (%)
Place of birth for the foreign-born population - Other South Eastern Asia (%)
Place of birth for the foreign-born population - Armenia (%)
Place of birth for the foreign-born population - Iraq (%)
Place of birth for the foreign-born population - Israel (%)
Place of birth for the foreign-born population - Jordan (%)
Place of birth for the foreign-born population - Kuwait (%)
Place of birth for the foreign-born population - Lebanon (%)
Place of birth for the foreign-born population - Saudi Arabia (%)
Place of birth for the foreign-born population - Syria (%)
Place of birth for the foreign-born population - Turkey (%)
Place of birth for the foreign-born population - Yemen (%)
Place of birth for the foreign-born population - Other Western Asia (%)
Place of birth for the foreign-born population - Eritrea (%)
Place of birth for the foreign-born population - Ethiopia (%)
Place of birth for the foreign-born population - Kenya (%)
Place of birth for the foreign-born population - Somalia (%)
Place of birth for the foreign-born population - Uganda (%)
Place of birth for the foreign-born population - Zimbabwe (%)
Place of birth for the foreign-born population - Other Eastern Africa (%)
Place of birth for the foreign-born population - Cameroon (%)
Place of birth for the foreign-born population - Congo (%)
Place of birth for the foreign-born population - Democratic Republic of Congo (Zaire) (%)
Place of birth for the foreign-born population - Other Middle Africa (%)
Place of birth for the foreign-born population - Egypt (%)
Place of birth for the foreign-born population - Morocco (%)
Place of birth for the foreign-born population - Sudan (%)
Place of birth for the foreign-born population - Other Northern Africa (%)
Place of birth for the foreign-born population - South Africa (%)
Place of birth for the foreign-born population - Other Southern Africa (%)
Place of birth for the foreign-born population - Cabo Verde (%)
Place of birth for the foreign-born population - Ghana (%)
Place of birth for the foreign-born population - Liberia (%)
Place of birth for the foreign-born population - Nigeria (%)
Place of birth for the foreign-born population - Senegal (%)
Place of birth for the foreign-born population - Sierra Leone (%)
Place of birth for the foreign-born population - Other Western Africa (%)
Place of birth for the foreign-born population - Australia (%)
Place of birth for the foreign-born population - New Zealand (%)
Place of birth for the foreign-born population - Fiji (%)
Place of birth for the foreign-born population - Micronesia (%)
Place of birth for the foreign-born population - Bahamas (%)
Place of birth for the foreign-born population - Barbados (%)
Place of birth for the foreign-born population - Cuba (%)
Place of birth for the foreign-born population - Dominica (%)
Place of birth for the foreign-born population - Dominican Republic (%)
Place of birth for the foreign-born population - Grenada (%)
Place of birth for the foreign-born population - Haiti (%)
Place of birth for the foreign-born population - Jamaica (%)
Place of birth for the foreign-born population - St. Vincent and the Grenadines (%)
Place of birth for the foreign-born population - Trinidad and Tobago (%)
Place of birth for the foreign-born population - West Indies (%)
Place of birth for the foreign-born population - Other Caribbean (%)
Place of birth for the foreign-born population - Belize (%)
Place of birth for the foreign-born population - Costa Rica (%)
Place of birth for the foreign-born population - El Salvador (%)
Place of birth for the foreign-born population - Guatemala (%)
Place of birth for the foreign-born population - Honduras (%)
Place of birth for the foreign-born population - Mexico (%)
Place of birth for the foreign-born population - Nicaragua (%)
Place of birth for the foreign-born population - Panama (%)
Place of birth for the foreign-born population - Other Central America (%)
Place of birth for the foreign-born population - Argentina (%)
Place of birth for the foreign-born population - Bolivia (%)
Place of birth for the foreign-born population - Brazil (%)
Place of birth for the foreign-born population - Chile (%)
Place of birth for the foreign-born population - Colombia (%)
Place of birth for the foreign-born population - Ecuador (%)
Place of birth for the foreign-born population - Guyana (%)
Place of birth for the foreign-born population - Peru (%)
Place of birth for the foreign-born population - Uruguay (%)
Place of birth for the foreign-born population - Venezuela (%)
Place of birth for the foreign-born population - Other South America (%)
Place of birth for the foreign-born population - Canada (%)
Place of birth for the foreign-born population - Other Northern America (%)
Place of birth for the foreign-born population - Other (%)
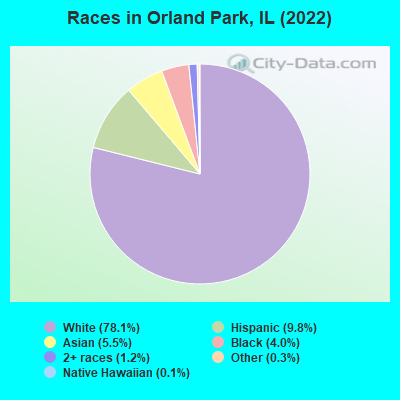
According to 2022 data, the most numerous races in Orland Park, IL are White alone (44,576 residents), Hispanic (5,606 residents), and Black alone (2,294 residents). 75.0% of Orland Park residents speak English at home. 14.9% of Orland Park, IL residents are foreign-born (6.4% born in Asia, 6.2% born in Europe), which is 5.8% greater than the foreign-born rate of 14.0% across the entire state of Illinois.
Race distribution in Orland Park
2000 2022
8,424,140 67.8% White alone 1,856,152 14.9% Black alone 1,530,262 12.3% Hispanic 419,916 3.4% Asian alone 153,996 1.2% Two or more races 13,479 0.1% Other race alone 18,232 0.1% American Indian alone 3,116 0.03% Native Hawaiian and Other
7,356,301 58.5% White alone 2,299,726 18.3% Hispanic 1,660,423 13.2% Black alone 747,296 5.9% Asian alone 458,599 3.6% Two or more races 45,386 0.4% Other race alone 10,405 0.08% American Indian alone 3,896 0.03% Native Hawaiian and Other
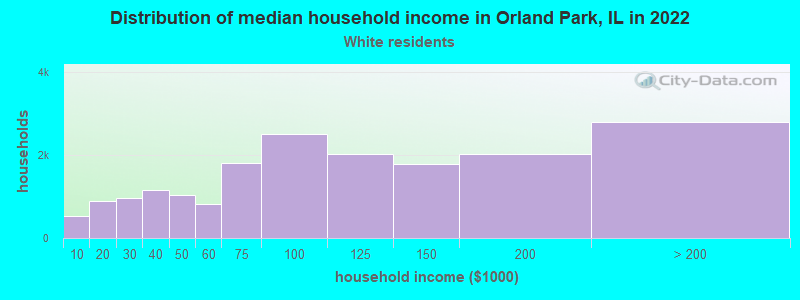
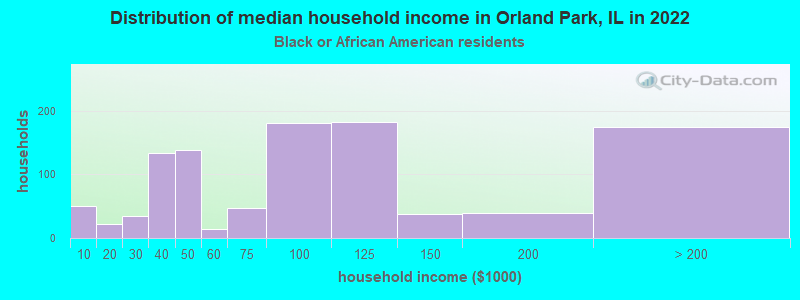
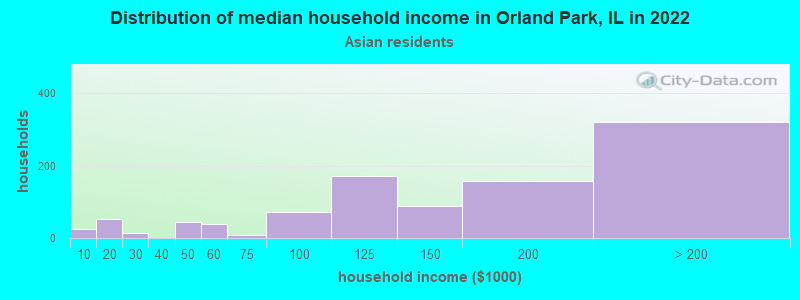
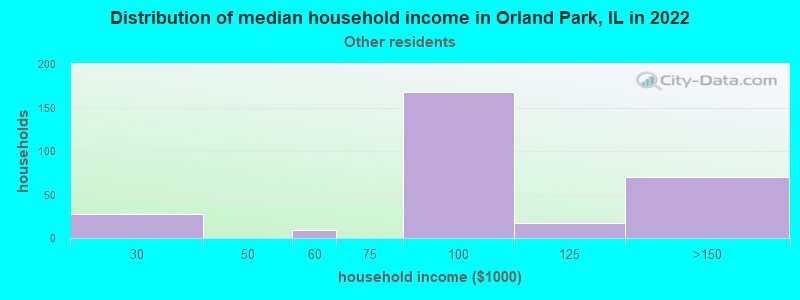
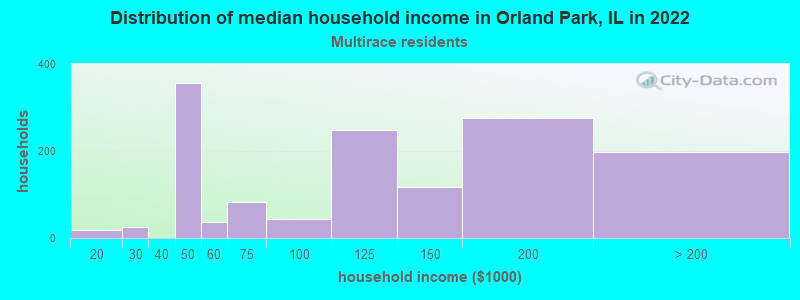
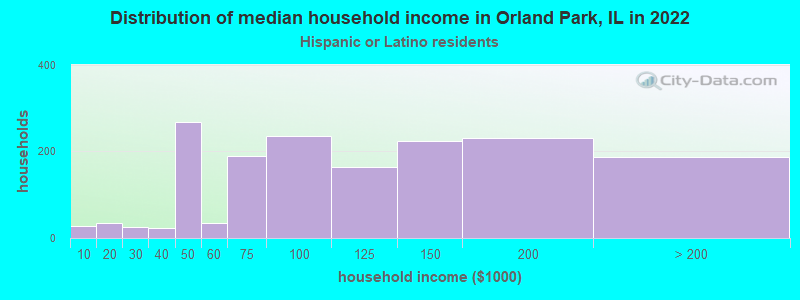
Income and house value in Orland Park Median household income in 2022 $92,792 White non-Hispanic householders$86,654 Black householders$136,506 Asian householders$102,348 Some other race householders$100,898 Two or more races householders$100,827 Hispanic or Latino race householdersMedian 2022 house value $364,808 White Non-Hispanic householders$409,043 Black or African American householders$484,648 American Indian or Alaska Native householders $396,354 Asian householders$362,693 Some other race householders$455,922 Two or more races householders$384,194 Hispanic or Latino householders
Median age by race in Orland Park
50.0 Median age for White residents46.3 54.6 48.1 Median age for Black or African American residents43.5 54.4 -680,473,372.1 Median age for American Indian / Alaska Native residents-736,736,736.0 -641,399,416.3 41.5 Median age for Asian residents40.2 45.1 33.5 Median age for Native Hawaiian / Pacific Islander residents21.9 -610,229,276.3 32.3 Median age for Other race residents32.5 32.0 28.6 Median age for Two or more races residents31.2 23.1 50.4 Median age for White alone residents46.3 54.1 27.3 Median age for Hispanic or Latino residents27.0 30.2
Owner/renter occupied households by race in Orland Park
House owners and renters - White residents 16,174 88.2% Owner occupied2,155 11.8% Renter occupiedHouse owners and renters - Black or African American residents 555 53.0% Owner occupied492 47.0% Renter occupiedHouse owners and renters - Asian residents 980 92.8% Owner occupied76 7.2% Renter occupiedHouse owners and renters - Native Hawaiian / Pacific Islander residents 19 100.0% Owner occupiedHouse owners and renters - Other race residents 233 78.2% Owner occupied65 21.8% Renter occupiedHouse owners and renters - Two or more races residents 1,046 70.3% Owner occupied442 29.7% Renter occupiedHouse owners and renters - White alone residents 16,748 88.6% Owner occupied2,151 11.4% Renter occupiedHouse owners and renters - Hispanic or Latino residents 1,087 65.7% Owner occupied568 34.3% Renter occupied
Language usage in Orland Park
English speakers - Total 75.0% of residents of Orland Park speak English at home.
5.0% of residents speak Spanish at home 1,618 59.1% Speak English very well1,122 40.9% Speak English less than very well19.9% of residents speak other language at home 7,579 70.0% Speak English very well3,246 30.0% Speak English less than very well
English speakers - Born in the United States 84.7% of residents of Orland Park speak English at home.
2.5% of residents speak Spanish at home 117 100.0% Speak English very well14.0% of residents speak other language at home 643 96.3% Speak English very well25 3.7% Speak English less than very well
English speakers - Native, born elsewhere 72.0% of residents of Orland Park speak English at home.
6.4% of residents speak Spanish at home 59 100.0% Speak English very well22.3% of residents speak other language at home 207 100.0% Speak English very well
English speakers - Foreign-born 10.8% of residents of Orland Park speak English at home.
9.8% of residents speak Spanish at home 376 45.3% Speak English very well454 54.7% Speak English less than very well78.9% of residents speak other language at home 3,616 54.3% Speak English very well3,048 45.7% Speak English less than very well
White (Caucasian) - Speak only English Native:
94.1% (34,411)Foreign-born:
15.3% (641)
White (Caucasian) - Speak another language Native:
7.5% (2,730)Foreign-born:
84.8% (3,548)
Black or African American - Speak only English Native:
97.0% (2,128)Foreign-born:
15.4% (26)
Black or African American - Speak another language Native:
3.0% (67)Foreign-born:
79.4% (137)
Asian - Speak only English Native:
60.0% (496)Foreign-born:
6.4% (129)
Asian - Speak another language Native:
40.1% (332)Foreign-born:
94.3% (1,906)
Other race - Speak only English Native:
37.6% (238)Foreign-born:
5.8% (13)
Other race - Speak another language Native:
63.5% (403)Foreign-born:
94.1% (203)
Two or more races - Speak another language Native:
49.1% (1,563)Foreign-born:
100.0% (806)
White alone - Speak only English Native:
89.5% (33,760)Foreign-born:
13.5% (708)
White alone - Speak another language Native:
10.7% (4,025)Foreign-born:
86.7% (4,543)
Hispanic or Latino - Speak only English Native:
63.7% (2,599)Foreign-born:
1.3% (11)
Hispanic or Latino - Speak another language Native:
38.3% (1,560)Foreign-born:
99.1% (823)
Foreign-born residents in Orland Park 8,476 residents are foreign born (6.4% Asia , 6.2% Europe ).
This city:
14.9%Illinois:
14.1%
Marital status for residents in Orland Park Marital status - White (Caucasian) population 15 years and over
Males 28.5% Never married57.8% Now married1.4% Separated3.7% Widowed8.6% DivorcedFemales 21.3% Never married56.5% Now married0.6% Separated13.4% Widowed8.2% DivorcedWomen who gave birth in the past 12 months Now married:
100.0% (245)Unmarried:
0.0% (0)
Women who did not give birth in the past 12 months Now married:
48.3% (3,393)Unmarried:
51.7% (3,627)
Marital status - Black or African American population 15 years and over
Males 47.2% Never married41.0% Now married2.8% Separated5.7% Widowed3.3% DivorcedFemales 32.8% Never married35.4% Now married2.1% Separated10.9% Widowed18.7% DivorcedWomen who gave birth in the past 12 months Now married:
100.0% (16)Unmarried:
0.0% (0)
Women who did not give birth in the past 12 months Now married:
22.4% (105)Unmarried:
77.6% (364)
Marital status - Asian population 15 years and over
Males 13.8% Never married83.7% Now married0.0% Separated1.7% Widowed0.8% DivorcedFemales 17.1% Never married69.4% Now married0.0% Separated13.4% Widowed0.0% DivorcedWomen who did not give birth in the past 12 months Now married:
69.5% (497)Unmarried:
30.5% (218)
Marital status - Native Hawaiian / Pacific Islander population 15 years and over
Males 29.0% Never married71.0% Now married0.0% Separated0.0% Widowed0.0% DivorcedFemales 0.0% Never married100.0% Now married0.0% Separated0.0% Widowed0.0% DivorcedWomen who did not give birth in the past 12 months Now married:
100.0% (18)Unmarried:
0.0% (0)
Marital status - Other race population 15 years and over
Males 33.2% Never married56.0% Now married0.0% Separated4.5% Widowed6.4% DivorcedFemales 22.1% Never married62.0% Now married0.0% Separated7.7% Widowed8.1% DivorcedWomen who gave birth in the past 12 months Now married:
100.0% (8)Unmarried:
0.0% (0)
Women who did not give birth in the past 12 months Now married:
67.6% (141)Unmarried:
32.4% (68)
Marital status - Two or more races population 15 years and over
Males 44.5% Never married42.4% Now married0.0% Separated0.0% Widowed13.2% DivorcedFemales 49.6% Never married38.8% Now married0.0% Separated5.1% Widowed6.5% DivorcedWomen who gave birth in the past 12 months Now married:
100.0% (42)Unmarried:
0.0% (0)
Women who did not give birth in the past 12 months Now married:
19.2% (239)Unmarried:
80.8% (1,001)
Marital status - White alone, not Hispanic / Latino population 15 years and over
Males 27.9% Never married58.1% Now married1.4% Separated3.8% Widowed8.8% DivorcedFemales 21.3% Never married56.3% Now married0.6% Separated13.5% Widowed8.3% DivorcedWomen who gave birth in the past 12 months Now married:
100.0% (275)Unmarried:
0.0% (0)
Women who did not give birth in the past 12 months Now married:
47.4% (3,514)Unmarried:
52.6% (3,895)
Marital status - Hispanic or Latino population 15 years and over
Males 47.3% Never married41.9% Now married0.0% Separated0.9% Widowed9.8% DivorcedFemales 36.9% Never married49.3% Now married0.0% Separated6.6% Widowed7.3% DivorcedWomen who gave birth in the past 12 months Now married:
100.0% (20)Unmarried:
0.0% (0)
Women who did not give birth in the past 12 months Now married:
39.6% (552)Unmarried:
60.4% (843)
Ancestries in Orland Park
5,011 16.6% Polish3,714 12.3% Irish2,441 8.1% Italian2,309 7.6% Palestinian1,793 5.9% American1,708 5.7% German856 2.8% Greek855 2.8% Lithuanian717 2.4% Arab517 1.7% Dutch351 1.2% English335 1.1% Ukrainian222 0.7% Jordanian222 0.7% European140 0.5% Eastern European138 0.5% Albanian136 0.5% Croatian128 0.4% Scottish118 0.4% Serbian118 0.4% Swedish102 0.3% Czech97 0.3% Russian96 0.3% Scandinavian87 0.3% Norwegian71 0.2% British64 0.2% Austrian59 0.2% Lebanese53 0.2% Ethiopian52 0.2% Iraqi52 0.2% Haitian44 0.1% Moroccan40 0.1% Czechoslovakian38 0.1% Egyptian34 0.1% Slovak30 0.10% Hungarian29 0.10% Turkish28 0.09% Brazilian27 0.09% Swiss26 0.09% Scotch-Irish24 0.08% Nigerian19 0.06% French18 0.06% Romanian16 0.05% French Canadian15 0.05% Assyrian15 0.05% African14 0.05% Latvian13 0.04% Macedonian11 0.04% Luxembourger10 0.03% Northern European10 0.03% Estonian10 0.03% Canadian6 0.02% Finnish5 0.02% Slovene5 0.02% Welsh
Geographical mobility in Orland Park Same house 1 year ago 37,428 89.3% White (Caucasian)2,019 84.9% Black or African American2,451 78.7% Asian73 100.0% Native Hawaiian / Pacific Islander878 88.7% Other race3,492 83.0% Two or more races39,664 89.4% White alone, not Hispanic / Latino4,848 86.4% Hispanic or LatinoMoved within same county 3,255 7.8% White / Caucasian294 12.4% Black or African American583 18.7% Asian74 7.5% Other race642 15.3% Two or more races3,441 7.8% White alone, not Hispanic / Latino650 11.6% Hispanic or LatinoMoved within same state 533 1.3% White / Caucasian7 0.2% Asian559 1.3% White alone, not Hispanic / LatinoMoved from different state 294 0.7% White / Caucasian36 1.5% Black or African American52 1.7% Asian45 1.1% Two or more races302 0.7% White alone, not Hispanic / Latino34 0.6% Hispanic or LatinoMoved from abroad 167 0.4% White26 0.8% Asian37 3.8% Other race182 0.4% White alone, not Hispanic / Latino43 0.8% Hispanic or Latino
Children Nativity (place of birth) in Orland Park
Children under 6 years - Living with two parents Both parents native 1,845 100.0% NativeBoth parents foreign-born 469 94.6% Native27 5.4% Foreign-bornOne native, one foreign-born parent 439 100.0% NativeChildren under 6 years - Living with one parent Native parent 239 100.0% NativeForeign-born parent 29 100.0% NativeChildren 6 to 17 years - Living with two parents Both parents native 4,156 99.4% Native26 0.6% Foreign-bornBoth parents foreign-born 1,076 79.2% Native282 20.8% Foreign-bornOne native, one foreign-born parent 801 100.0% NativeChildren 6 to 17 years - Living with one parent Native parent 1,363 100.0% NativeForeign-born parent 337 50.1% Native335 49.9% Foreign-born
Grandparents responsible for own grandchildren in Orland Park
Grandparents (30 to 59 years) White / Caucasian 36 53.2% Responsible for grandchildren32 46.8% Not responsible for grandchildrenAsian 11 100.0% Responsible for grandchildrenTwo or more races 141 100.0% Not responsible for grandchildrenWhite alone, not Hispanic / Latino 48 63.8% Responsible for grandchildren27 36.2% Not responsible for grandchildrenHispanic or Latino 101 100.0% Not responsible for grandchildren
Grandparents (60 years and over) White / Caucasian 5 1.5% Responsible for grandchildren336 98.5% Not responsible for grandchildrenAsian 35 100.0% Not responsible for grandchildrenTwo or more races 76 100.0% Not responsible for grandchildrenWhite alone, not Hispanic / Latino 6 1.6% Responsible for grandchildren389 98.4% Not responsible for grandchildrenHispanic or Latino 80 100.0% Not responsible for grandchildren