Estimated zip code population in 2022: 9,644 Zip code population in 2010: 9,620 Zip code population in 2000: 9,520
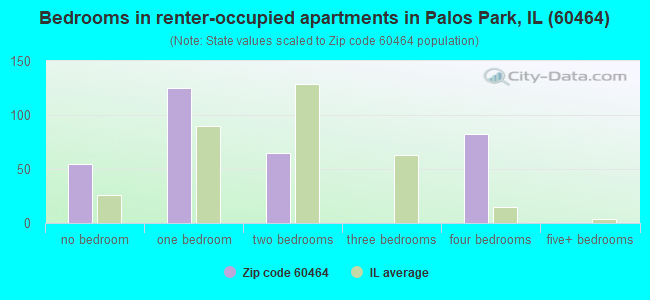
Houses and condos: 4,373 Renter-occupied apartments: 325
% of renters here:
8%
State:
33%
March 2022 cost of living index in zip code 60464: 102.4 (near average, U.S. average is 100)
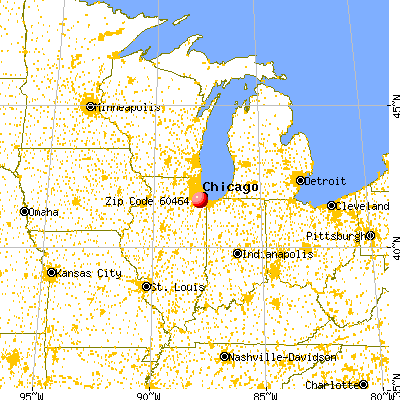
Land area: 7.7 sq. mi. Water area: 0.4 sq. mi.
Population density: 1,247 people per square mile
(low).
OSM Map
General Map
Google Map
MSN Map
OSM Map
General Map
Google Map
MSN Map
OSM Map
General Map
Google Map
MSN Map
OSM Map
General Map
Google Map
MSN Map
Please wait while loading the map...
Real estate property taxes paid for housing units in 2022:
This zip code:
1.7% ($8,248)
Illinois:
2.0% ($4,912)
Median real estate property taxes paid for housing units with mortgages in 2022: $8,809 (1.7%) Median real estate property taxes paid for housing units with no mortgage in 2022: $7,921 (1.8%)
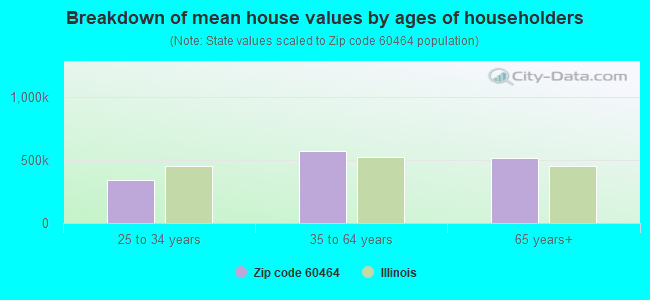
Estimated median house/condo value in 2022: $476,577
60464:
$476,577
Illinois:
$251,600
According to our research of Illinois and other state lists, there were 5 registered sex offenders living in 60464 zip code as of May 23, 2024. The ratio of all residents to sex offenders in zip code 60464 is 1,946 to 1. The ratio of registered sex offenders to all residents in this zip code is much lower than the state average.
Median resident age:
This zip code:
51.5 years
Illinois median age:
39.1 years
Average household size:
This zip code:
2.5 people
Illinois:
2.4 people
Averages for the 2020 tax year for zip code 60464, filed in 2021:
Average Adjusted Gross Income (AGI) in 2020: $147,441 (Individual Income Tax Returns)
Here:
$147,441
State:
$82,626
Salary/wage: $100,555 (reported on 69.1% of returns)
Here:
$100,555
State:
$66,640
(% of AGI for various income ranges: 1083.9% for AGIs below $25k, 3100.6% for AGIs $25k-50k, 5310.8% for AGIs $50k-75k, 7926.0% for AGIs $75k-100k, 16160.4% for AGIs $100k-200k, 83873.9% for AGIs over 200k)
Taxable interest for individuals: $3,754 (reported on 51.7% of returns)
This zip code:
$3,754
Illinois:
$2,376
(% of AGI for various income ranges: 48.3% for AGIs below $25k, 127.1% for AGIs $25k-50k, 149.5% for AGIs $50k-75k, 285.3% for AGIs $75k-100k, 406.3% for AGIs $100k-200k, 2220.0% for AGIs over 200k)
Ordinary dividends: $11,419 (reported on 45.5% of returns)
Here:
$11,419
State:
$9,061
(% of AGI for various income ranges: 107.9% for AGIs below $25k, 220.0% for AGIs $25k-50k, 327.1% for AGIs $50k-75k, 590.0% for AGIs $75k-100k, 1127.8% for AGIs $100k-200k, 6515.7% for AGIs over 200k)
Net capital gain/loss in AGI: +$29,605 (reported on 40.5% of returns)
Here:
+$29,605
State:
+$31,684
(% of AGI for various income ranges: 22.6% for AGIs below $25k, 114.9% for AGIs $25k-50k, 261.1% for AGIs $50k-75k, 452.3% for AGIs $75k-100k, 1233.3% for AGIs $100k-200k, 21770.4% for AGIs over 200k)
Profit/loss from business: +$19,457 (reported on 17.2% of returns)
Here:
+$19,457
State:
+$12,175
(% of AGI for various income ranges: 163.6% for AGIs below $25k, 389.0% for AGIs $25k-50k, 231.1% for AGIs $50k-75k, 413.0% for AGIs $75k-100k, 639.1% for AGIs $100k-200k, 3527.8% for AGIs over 200k)
Taxable individual retirement arrangement distribution: $27,554 (reported on 20.2% of returns)
60464:
$27,554
Illinois:
$21,613
(% of AGI for various income ranges: 146.1% for AGIs below $25k, 327.8% for AGIs $25k-50k, 600.5% for AGIs $50k-75k, 828.3% for AGIs $75k-100k, 1603.9% for AGIs $100k-200k, 5118.7% for AGIs over 200k)
Self-employed (Keogh) retirement plans: $30,000 (reported on 1.0% of returns)
60464:
$30,000
Illinois:
$30,962
(% of AGI for various income ranges: 652.2% for AGIs over 200k)
Total itemized deductions: $43,167 (reported on 17.4% of returns)
Here:
$43,167
State:
$34,948
(% of AGI for various income ranges: 219.7% for AGIs below $25k, 401.0% for AGIs $25k-50k, 753.7% for AGIs $50k-75k, 1081.7% for AGIs $75k-100k, 1306.5% for AGIs $100k-200k, 9081.7% for AGIs over 200k)
Charity contributions: $17,755 (reported on 14.8% of returns)
Here:
$17,755
State:
$13,122
(% of AGI for various income ranges: 9.1% for AGIs below $25k, 41.2% for AGIs $25k-50k, 85.0% for AGIs $50k-75k, 125.3% for AGIs $75k-100k, 263.9% for AGIs $100k-200k, 4673.5% for AGIs over 200k)
Taxes paid: $8,630 (reported on 17.4% of returns)
60464:
$8,630
State:
$8,563
(% of AGI for various income ranges: 38.9% for AGIs below $25k, 84.9% for AGIs $25k-50k, 199.5% for AGIs $50k-75k, 291.3% for AGIs $75k-100k, 400.0% for AGIs $100k-200k, 1316.5% for AGIs over 200k)
Earned income credit: $1,807 (reported on 5.6% of returns)
Here:
$1,807
State:
$2,311
(% of AGI for various income ranges: 41.7% for AGIs below $25k, 43.7% for AGIs $25k-50k)
Percentage of individuals using paid preparers for their 2020 taxes: 92.0%
Here:
92%
State:
93%
(% for various income ranges: 90.8% for AGIs below $25k, 93.2% for AGIs $25k-50k, 90.2% for AGIs $50k-75k, 92.3% for AGIs $75k-100k, 92.8% for AGIs $100k-200k, 92.7% for AGIs over 200k)
Averages for the 2012 tax year for zip code 60464, filed in 2013:
Average Adjusted Gross Income (AGI) in 2012: $120,296 (Individual Income Tax Returns)
Here:
$120,296
State:
$68,058
Salary/wage: $83,575 (reported on 72.5% of returns)
Here:
$83,575
State:
$55,396
(% of AGI for various income ranges: 61.9% for AGIs below $25k, 58.2% for AGIs $25k-50k, 54.2% for AGIs $50k-75k, 53.8% for AGIs $75k-100k, 63.3% for AGIs $100k-200k, 42.7% for AGIs over 200k)
Taxable interest for individuals: $4,588 (reported on 58.9% of returns)
This zip code:
$4,588
Illinois:
$1,969
(% of AGI for various income ranges: 3.8% for AGIs below $25k, 2.5% for AGIs $25k-50k, 2.6% for AGIs $50k-75k, 1.9% for AGIs $75k-100k, 1.6% for AGIs $100k-200k, 2.4% for AGIs over 200k)
Ordinary dividends: $9,794 (reported on 48.5% of returns)
Here:
$9,794
State:
$7,786
(% of AGI for various income ranges: 6.5% for AGIs below $25k, 4.5% for AGIs $25k-50k, 4.7% for AGIs $50k-75k, 3.8% for AGIs $75k-100k, 3.3% for AGIs $100k-200k, 4.0% for AGIs over 200k)
Net capital gain/loss in AGI: +$21,806 (reported on 39.1% of returns)
Here:
+$21,806
State:
+$22,183
(% of AGI for various income ranges: 0.2% for AGIs $50k-75k, 0.9% for AGIs $75k-100k, 1.5% for AGIs $100k-200k, 12.1% for AGIs over 200k)
Profit/loss from business: +$23,868 (reported on 16.7% of returns)
Here:
+$23,868
State:
+$12,903
(% of AGI for various income ranges: 9.5% for AGIs below $25k, 5.9% for AGIs $25k-50k, 3.0% for AGIs $50k-75k, 3.6% for AGIs $75k-100k, 3.8% for AGIs $100k-200k, 2.6% for AGIs over 200k)
Taxable individual retirement arrangement distribution: $23,329 (reported on 21.0% of returns)
60464:
$23,329
Illinois:
$17,929
(% of AGI for various income ranges: 7.9% for AGIs below $25k, 5.8% for AGIs $25k-50k, 7.2% for AGIs $50k-75k, 5.6% for AGIs $75k-100k, 5.1% for AGIs $100k-200k, 2.8% for AGIs over 200k)
Self-employment retirement plans: $23,433 (reported on 1.8% of returns)
60464:
$23,433
Illinois:
$24,666
Total itemized deductions: $33,269 (17% of AGI, reported on 55.2% of returns)
Here:
$33,269
State:
$26,433
Here:
17.4% of AGI
State:
19.2% of AGI
(% of AGI for various income ranges: 24.3% for AGIs below $25k, 23.1% for AGIs $25k-50k, 19.7% for AGIs $50k-75k, 19.8% for AGIs $75k-100k, 18.1% for AGIs $100k-200k, 11.8% for AGIs over 200k)
Charity contributions: $4,914 (reported on 49.9% of returns)
Here:
$4,914
State:
$4,525
(% of AGI for various income ranges: 1.4% for AGIs below $25k, 2.0% for AGIs $25k-50k, 1.9% for AGIs $50k-75k, 2.1% for AGIs $75k-100k, 1.9% for AGIs $100k-200k, 2.1% for AGIs over 200k)
Taxes paid: $16,347 (reported on 55.0% of returns)
60464:
$16,347
State:
$11,968
(% of AGI for various income ranges: 8.1% for AGIs below $25k, 8.6% for AGIs $25k-50k, 8.5% for AGIs $50k-75k, 8.8% for AGIs $75k-100k, 9.0% for AGIs $100k-200k, 6.4% for AGIs over 200k)
Earned income credit: $1,562 (reported on 5.1% of returns)
Here:
$1,562
State:
$2,349
(% of AGI for various income ranges: 1.8% for AGIs below $25k, 0.4% for AGIs $25k-50k)
Percentage of individuals using paid preparers for their 2012 taxes: 68.4%
Here:
68%
State:
57%
(% for various income ranges: 61.8% for AGIs below $25k, 64.6% for AGIs $25k-50k, 71.9% for AGIs $50k-75k, 70.8% for AGIs $75k-100k, 71.8% for AGIs $100k-200k, 78.3% for AGIs over 200k)
Averages for the 2004 tax year for zip code 60464, filed in 2005:
Average Adjusted Gross Income (AGI) in 2004: $97,375 (Individual Income Tax Returns)
Here:
$97,375
State:
$54,625
Salary/wage: $74,008 (reported on 72.7% of returns)
Here:
$74,008
State:
$46,811
(% of AGI for various income ranges: 270.5% for AGIs below $10k, 48.6% for AGIs $10k-25k, 56.9% for AGIs $25k-50k, 56.2% for AGIs $50k-75k, 64.5% for AGIs $75k-100k, 53.3% for AGIs over 100k)
Taxable interest for individuals: $4,665 (reported on 75.7% of returns)
This zip code:
$4,665
Illinois:
$2,101
(% of AGI for various income ranges: 42.2% for AGIs below $10k, 9.7% for AGIs $10k-25k, 5.2% for AGIs $25k-50k, 4.3% for AGIs $50k-75k, 3.6% for AGIs $75k-100k, 3.1% for AGIs over 100k)
Taxable dividends: $5,901 (reported on 56.0% of returns)
Here:
$5,901
State:
$4,306
(% of AGI for various income ranges: 34.9% for AGIs below $10k, 7.6% for AGIs $10k-25k, 4.7% for AGIs $25k-50k, 4.1% for AGIs $50k-75k, 3.4% for AGIs $75k-100k, 3.0% for AGIs over 100k)
Net capital gain/loss: +$20,455 (reported on 45.7% of returns)
Here:
+$20,455
State:
+$17,321
(% of AGI for various income ranges: -10.5% for AGIs below $10k, 0.9% for AGIs $10k-25k, 2.1% for AGIs $25k-50k, 1.5% for AGIs $50k-75k, 2.5% for AGIs $75k-100k, 12.2% for AGIs over 100k)
Profit/loss from business: +$23,991 (reported on 15.4% of returns)
Here:
+$23,991
State:
+$11,771
(% of AGI for various income ranges: -12.1% for AGIs below $10k, 4.6% for AGIs $10k-25k, 4.1% for AGIs $25k-50k, 4.6% for AGIs $50k-75k, 5.6% for AGIs $75k-100k, 3.5% for AGIs over 100k)
IRA payment deduction: $3,858 (reported on 4.4% of returns)
60464:
$3,858
Illinois:
$3,087
(% of AGI for various income ranges: 2.0% for AGIs below $10k, 0.3% for AGIs $10k-25k, 0.5% for AGIs $25k-50k, 0.3% for AGIs $50k-75k, 0.3% for AGIs $75k-100k, 0.1% for AGIs over 100k)
Self-employed pension: $18,763 (reported on 2.2% of returns)
Here:
$18,763
Illinois:
$16,965
(% of AGI for various income ranges: 0.3% for AGIs $50k-75k, 0.4% for AGIs $75k-100k, 0.5% for AGIs over 100k)
Total itemized deductions: $25,934 (16% of AGI, reported on 52.7% of returns)
Here:
$25,934
State:
$20,239
Here:
16.1% of AGI
State:
19.5% of AGI
(% of AGI for various income ranges: 62.1% for AGIs below $10k, 25.6% for AGIs $10k-25k, 23.0% for AGIs $25k-50k, 20.0% for AGIs $50k-75k, 20.3% for AGIs $75k-100k, 11.5% for AGIs over 100k)
Charity contributions deductions: $4,886 (3% of AGI, reported on 49.5% of returns)
Here:
$4,886
State:
$3,719
Here:
2.9% of AGI
State:
3.4% of AGI
(% of AGI for various income ranges: 3.3% for AGIs below $10k, 2.1% for AGIs $10k-25k, 2.2% for AGIs $25k-50k, 2.6% for AGIs $50k-75k, 2.8% for AGIs $75k-100k, 2.5% for AGIs over 100k)
Total tax: $21,812 (reported on 80.7% of returns)
60464:
$21,812
State:
$9,882
(% of AGI for various income ranges: 8.5% for AGIs below $10k, 4.2% for AGIs $10k-25k, 7.7% for AGIs $25k-50k, 9.7% for AGIs $50k-75k, 10.3% for AGIs $75k-100k, 21.1% for AGIs over 100k)
Earned income credit: $1,123 (reported on 2.6% of returns)
Here:
$1,123
State:
$1,788
Percentage of individuals using paid preparers for their 2004 taxes: 68.2%
Here:
68%
State:
61%
(% for various income ranges: 60.9% for AGIs below $10k, 66.2% for AGIs $10k-25k, 66.9% for AGIs $25k-50k, 71.0% for AGIs $50k-75k, 70.1% for AGIs $75k-100k, 73.9% for AGIs over 100k)
Household received Food Stamps/SNAP in the past 12 months: 78 Household did not receive Food Stamps/SNAP in the past 12 months: 3,721
Women who had a birth in the past 12 months: 52 (51 now married, 0 unmarried) Women who did not have a birth in the past 12 months: 1,345 (823 now married, 511 unmarried)
Housing units in zip code 60464 with a mortgage: 1,771 (137 second mortgage, 129 both second mortgage and home equity loan) Houses without a mortgage: 244
Median monthly owner costs for units with a mortgage: $2,951 Median monthly owner costs for units without a mortgage: $1,144
Residents with income below the poverty level in 2022:
This zip code:
5.0%
Whole state:
11.9%
Residents with income below 50% of the poverty level in 2022:
This zip code:
2.9%
Whole state:
5.7%
Median number of rooms in houses and condos:
Here:
7.4
State:
6.4
Median number of rooms in apartments:
Here:
3.3
State:
4.1
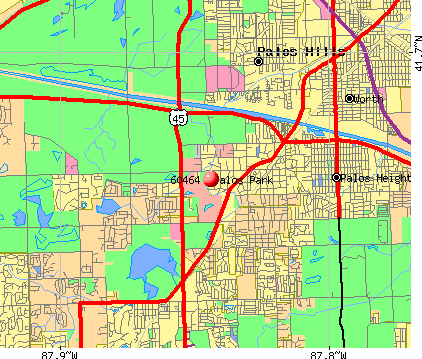
Notable locations in this zip code not listed on our city pages
Notable locations in zip code 60464: Palos Park Village Hall (A), Palos Fire Protection District Station 2 (B), Palos Fire Protection District Station 1 (C), Holy Family Villa (D). Display/hide their locations on the map
Churches in zip code 60464 include: Church of the Transfiguration (A), First Church of Christ (B), Palos Park Presbyterian Church (C), Peace Memorial Church (D), Saint Peter and Paul Ukrainian Church (E). Display/hide their locations on the map
In group quarters: 109 (-1 institutionalized population)
Size of family households: 1,349 2-persons, 654 3-persons, 307 4-persons, 190 5-persons, 89 6-persons, 114 7-or-more-persons
Size of nonfamily households: 989 1-person, 107 2-persons, 48 3-persons
1,462 married couples with children.
210 single-parent households (140 men, 70 women).
80.3% of residents of 60464 zip code speak English at home.
4.0% of residents speak Spanish at home (80% very well, 2% well, 18% not well).
12.3% of residents speak other Indo-European language at home (68% very well, 27% well, 5% not well).
0.6% of residents speak Asian or Pacific Island language at home (64% very well, 36% well).
3.5% of residents speak other language at home (85% very well, 13% well, 2% not at all).
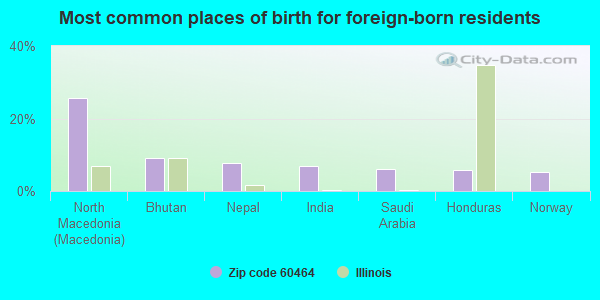
Foreign born population: 1,376 (14.3%) (80.0% of them are naturalized citizens)
This zip code:
14.3%
Whole state:
14.4%
26%North Macedonia (Macedonia)
9%Bhutan
8%Nepal
7%India
6%Saudi Arabia
6%Honduras
5%Norway
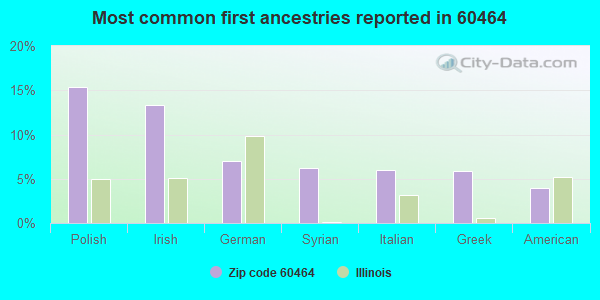
15%Polish
13%Irish
7%German
6%Syrian
6%Italian
6%Greek
4%American
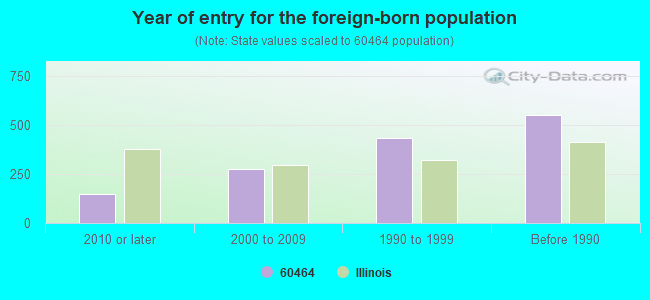
Year of entry for the foreign-born population
1492010 or later
2732000 to 2009
4321990 to 1999
551Before 1990
Facilities with environmental interests located in this zip code:
MILL CREEK CLEANERS (12916 S LAGRANGE in PALOS PARK, IL)
STATE MASTER (Illinois EPA Project) - HAZARDOUS WASTE PROGRAM (Resource Conservation and Recovery Act (tracking hazardous waste))
PALOS GATEWAY PROPERTIES LLC (11845 SOUTHWEST HWY in PALOS PARK, IL)
STATE MASTER (Illinois EPA Project) - HAZARDOUS WASTE PROGRAM Small Quantity Generators, between 100 kg and 1000 kg of hazardous waste/month (Resource Conservation and Recovery Act (tracking hazardous waste)) - notification Organizations: MCKEEVER JOSEPH (CONTACT/OWNER)
Alternative names: MCKEEVER VOLKSWAGEN INC
PALOS SOUTH MIDDLE SCHOOL (131ST STREET & 82ND AVENUE in PALOS PARK, IL)
STATE MASTER (Illinois EPA Project) - SOLID WASTE PROGRAM, AIR PROGRAM AIR MINOR (AIRS/AFS) Business SIC classification: ELEMENTARY AND SECONDARY SCHOOLS
JEWEL FOOD STORES, INC. #3160 (9652 WEST 131 STREET in PALOS PARK, IL)
AIR MINOR (AIRS/AFS) - ICIS-05-2003-0340, ENFORCEMENT/COMPLIANCE ACTIVITY Business SIC classification: GROCERY STORES
PALOS SOUTH MIDDLE SCHOOL (13100 S 82ND AVE in PALOS PARK, IL)
(Geographic Names Information System) (National Center for Education Statistics) - STATE ID-1401611801004 Organizations: PALOS COMM CONS SCHOOL DIST 118 (SCHOOL DISTRICT)
PALOS WEST ELEMENTARY SCHOOL (12700 S 104TH AVE in PALOS PARK, IL)
(Geographic Names Information System) (National Center for Education Statistics) - STATE ID-1401611802003 Organizations: PALOS COMM CONS SCHOOL DIST 118 (SCHOOL DISTRICT)
COOK COUNTY BRIDGE (104TH AVE OVR CAL SAG in PALOS PARK, IL)
Large Quantity Generators, more that 1000 kg of hazardous waste/month (Resource Conservation and Recovery Act (tracking hazardous waste)) - notification Organizations: COOK COUNTY HWY DEPT (CONTACT/OWNER)
KENNEDY JR. SCHOOL (123RD STREET AND WOLF ROAD in PALOS PARK, IL)
National Pollutant Discharge Elimination System NON-MAJOR (Tracking pollutant discharge elimination systems) - permit Business SIC classification: ELEMENTARY AND SECONDARY SCHOOLS Alternative names: KENNEDY, LT. JOSEPH JR. SCHOOL
IDOT (US RTE 45 (LAGRANGE RD) in PALOS PARK, IL)
Small Quantity Generators, between 100 kg and 1000 kg of hazardous waste/month (Resource Conservation and Recovery Act (tracking hazardous waste)) - notification Organizations: STATE OF IL-DOT (CONTACT/OWNER)
PALOS PARK CLEANERS (13014 S LAGRANGE in PALOS PARK, IL)
Small Quantity Generators, between 100 kg and 1000 kg of hazardous waste/month (Resource Conservation and Recovery Act (tracking hazardous waste)) - notification Organizations: HYUN JOE (CONTACT/OWNER)
Housing units lacking complete kitchen facilities: 4.3%
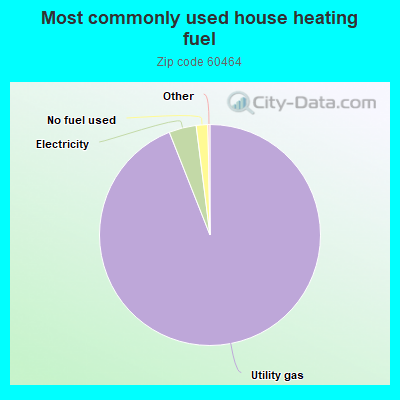
94.1%Utility gas
4.0%Electricity
1.7%No fuel used
Population in 1990: 8,967. Population change in the 1990s: +553 (+6.2%).
Place of birth for U.S.-born residents:
This state: 7,388
Northeast: 170
Midwest: 528
South: 40
West: 59
72% of the 60464 zip code residents lived in the same house 5 years ago. Out of people who lived in different houses, 90% lived in this county. Out of people who lived in different counties, 50% lived in Illinois.
89% of the 60464 zip code residents lived in the same house 1 year ago. Out of people who lived in different houses, 80% moved from this county. Out of people who lived in different houses, 2% moved from different county within same state. Out of people who lived in different houses, 11% moved from different state. Out of people who lived in different houses, 3% moved from abroad.
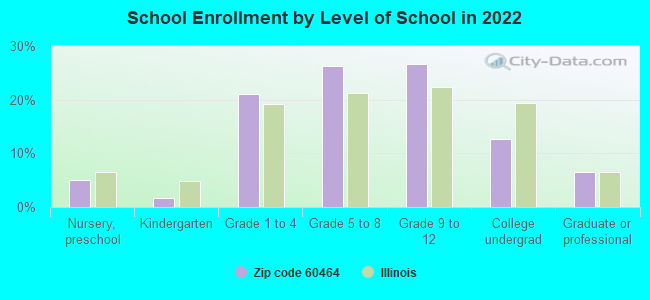
Private vs. public school enrollment:
Students in private schools in grades 1 to 8 (elementary and middle school): 78
Here:
8.9%
Illinois:
13.3%
Students in private schools in grades 9 to 12 (high school): 63
Here:
12.6%
Illinois:
9.9%
Students in private undergraduate colleges: 86
Here:
36.5%
Illinois:
27.4%
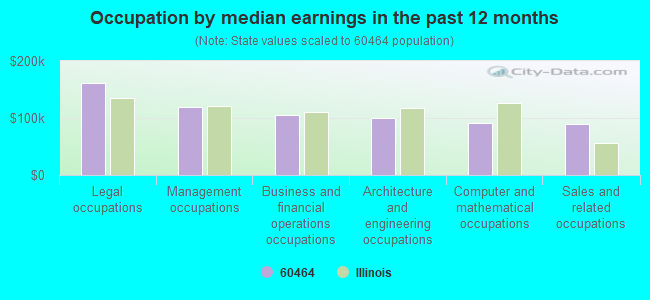
Occupation by median earnings in the past 12 months ($)
161,532Legal occupations
118,524Management occupations
106,003Business and financial operations occupations
99,535Architecture and engineering occupations
91,397Computer and mathematical occupations
90,244Sales and related occupations
Companies with federal contracts located in this zip code:
HI-LO BUILDING RESTORATION (13300 STEPHEN DRIVE in PALOS PARK, IL; small business) : $11,955 in 2 contractsfrom 2002 to 2004
$7,455 with Public Buildings Service for Maintenance, Repair or Alteration of Real Property -- Office Buildings. Signed on 2002-11-15. Completion date: 2002-11-15.
$4,500, same as above.Signed on 2004-10-19. Completion date: 2004-11-19.
Top industries in this zip code by the number of employees in 2005:
Health Care and Social Assistance: Homes for the Elderly (100-249 employees: 2 establishments)
Other Services (except Public Administration): Religious Organizations (20-49: 2, 10-19: 2, 5-9: 2)
Accommodation and Food Services: Full-Service Restaurants (50-99: 1, 20-49: 1)
Other Services (except Public Administration): Beauty Salons (20-49: 2, 10-19: 1, 5-9: 1)
Construction: Plumbing, Heating, and Air-Conditioning Contractors (50-99: 1, 1-4: 1)
Health Care and Social Assistance: Offices of Physicians (except Mental Health Specialists) (20-49: 1, 10-19: 1, 5-9: 1, 1-4: 3)
Construction: New Single-Family Housing Construction (except Operative Builders) (10-19: 1, 5-9: 3, 1-4: 12)
Accommodation and Food Services: Limited-Service Restaurants (10-19: 3, 5-9: 1)
People in group quarters in 2010:
97 people in nursing facilities/skilled-nursing facilities
11 people in residential treatment centers for adults
6 people in other noninstitutional facilities
People in group quarters in 2000:
105 people in nursing homes
33 people in other group homes
9 people in homes or halfway houses for drug/alcohol abuse
Fatal accident statistics in 2010:
Fatal accident count: 1
Vehicles involved in fatal accidents: 1
Fatal accidents caused by drunken drivers: 0
Fatalities: 1
Persons involved in fatal accidents: 1
Pedestrians involved in fatal accidents: 1
Home Mortgage Disclosure Act Aggregated Statistics For Year 2009 (Based on 6 partial tracts)
A) FHA, FSA/RHS & VA Home Purchase Loans
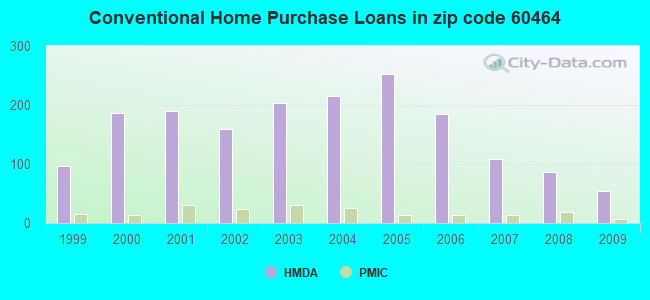
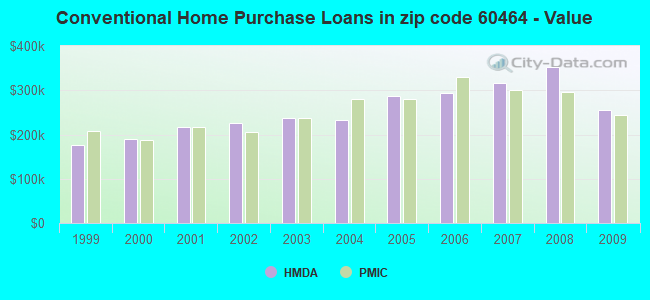
B) Conventional Home Purchase Loans
C) Refinancings
D) Home Improvement Loans
F) Non-occupant Loans on < 5 Family Dwellings (A B C & D)
Number
Average Value
Number
Average Value
Number
Average Value
Number
Average Value
Number
Average Value
LOANS ORIGINATED
9
$283,056
54
$255,639
532
$259,118
17
$120,322
7
$259,864
APPLICATIONS APPROVED, NOT ACCEPTED
0
$0
8
$268,981
55
$303,683
1
$1,760
2
$173,300
APPLICATIONS DENIED
7
$254,494
9
$198,612
128
$324,148
4
$48,678
2
$206,655
APPLICATIONS WITHDRAWN
2
$149,125
4
$265,942
59
$312,665
5
$138,910
3
$230,343
FILES CLOSED FOR INCOMPLETENESS
0
$0
3
$199,437
28
$286,026
1
$462,380
0
$0
Aggregated Statistics For Year 2008 (Based on 6 partial tracts)
A) FHA, FSA/RHS & VA Home Purchase Loans
B) Conventional Home Purchase Loans
C) Refinancings
D) Home Improvement Loans
F) Non-occupant Loans on < 5 Family Dwellings (A B C & D)
Number
Average Value
Number
Average Value
Number
Average Value
Number
Average Value
Number
Average Value
LOANS ORIGINATED
4
$231,538
86
$352,944
281
$312,079
28
$94,586
12
$281,335
APPLICATIONS APPROVED, NOT ACCEPTED
0
$0
8
$605,205
28
$357,633
0
$0
0
$0
APPLICATIONS DENIED
1
$189,300
11
$372,457
91
$356,961
9
$166,782
1
$293,210
APPLICATIONS WITHDRAWN
1
$198,560
8
$485,636
39
$331,493
3
$35,297
1
$45,270
FILES CLOSED FOR INCOMPLETENESS
1
$67,390
4
$818,020
9
$277,639
2
$403,855
0
$0
Aggregated Statistics For Year 2007 (Based on 6 partial tracts)
A) FHA, FSA/RHS & VA Home Purchase Loans
B) Conventional Home Purchase Loans
C) Refinancings
D) Home Improvement Loans
F) Non-occupant Loans on < 5 Family Dwellings (A B C & D)
Number
Average Value
Number
Average Value
Number
Average Value
Number
Average Value
Number
Average Value
LOANS ORIGINATED
2
$265,325
108
$316,367
285
$339,259
46
$114,452
14
$278,889
APPLICATIONS APPROVED, NOT ACCEPTED
0
$0
16
$339,518
46
$314,099
4
$72,398
1
$329,260
APPLICATIONS DENIED
1
$102,370
31
$450,492
80
$385,053
16
$174,436
7
$500,913
APPLICATIONS WITHDRAWN
0
$0
11
$386,240
44
$231,660
9
$262,229
0
$0
FILES CLOSED FOR INCOMPLETENESS
0
$0
3
$212,360
32
$453,020
1
$15,430
2
$461,000
Aggregated Statistics For Year 2006 (Based on 6 partial tracts)
A) FHA, FSA/RHS & VA Home Purchase Loans
B) Conventional Home Purchase Loans
C) Refinancings
D) Home Improvement Loans
E) Loans on Dwellings For 5+ Families
F) Non-occupant Loans on < 5 Family Dwellings (A B C & D)
Number
Average Value
Number
Average Value
Number
Average Value
Number
Average Value
Number
Average Value
Number
Average Value
LOANS ORIGINATED
1
$81,790
184
$293,516
304
$282,675
45
$118,283
1
$1,014,910
17
$258,837
APPLICATIONS APPROVED, NOT ACCEPTED
0
$0
32
$304,925
40
$376,787
9
$117,741
0
$0
4
$209,642
APPLICATIONS DENIED
0
$0
43
$369,767
119
$314,970
13
$88,734
0
$0
2
$167,575
APPLICATIONS WITHDRAWN
0
$0
22
$358,211
57
$323,455
8
$205,646
0
$0
3
$149,990
FILES CLOSED FOR INCOMPLETENESS
0
$0
11
$357,349
11
$299,029
2
$46,315
0
$0
0
$0
Aggregated Statistics For Year 2005 (Based on 6 partial tracts)
B) Conventional Home Purchase Loans
C) Refinancings
D) Home Improvement Loans
E) Loans on Dwellings For 5+ Families
F) Non-occupant Loans on < 5 Family Dwellings (A B C & D)
G) Loans On Manufactured Home Dwelling (A B C & D)
Number
Average Value
Number
Average Value
Number
Average Value
Number
Average Value
Number
Average Value
Number
Average Value
LOANS ORIGINATED
252
$286,127
300
$259,103
43
$140,308
0
$0
19
$259,555
1
$20,580
APPLICATIONS APPROVED, NOT ACCEPTED
24
$264,636
46
$279,132
3
$155,487
0
$0
0
$0
0
$0
APPLICATIONS DENIED
37
$307,908
98
$304,257
10
$271,802
0
$0
4
$166,458
0
$0
APPLICATIONS WITHDRAWN
22
$293,472
61
$280,814
4
$154,915
2
$170,740
6
$273,823
0
$0
FILES CLOSED FOR INCOMPLETENESS
3
$281,497
26
$282,877
0
$0
0
$0
0
$0
0
$0
Aggregated Statistics For Year 2004 (Based on 6 partial tracts)
A) FHA, FSA/RHS & VA Home Purchase Loans
B) Conventional Home Purchase Loans
C) Refinancings
D) Home Improvement Loans
F) Non-occupant Loans on < 5 Family Dwellings (A B C & D)
G) Loans On Manufactured Home Dwelling (A B C & D)
Number
Average Value
Number
Average Value
Number
Average Value
Number
Average Value
Number
Average Value
Number
Average Value
LOANS ORIGINATED
1
$126,540
215
$231,675
371
$236,958
37
$82,034
14
$238,789
1
$16,770
APPLICATIONS APPROVED, NOT ACCEPTED
0
$0
30
$248,248
35
$302,656
18
$82,493
4
$182,800
0
$0
APPLICATIONS DENIED
0
$0
19
$232,129
118
$251,967
15
$142,605
6
$175,115
0
$0
APPLICATIONS WITHDRAWN
1
$76,130
8
$177,570
60
$241,558
3
$420,500
2
$288,350
0
$0
FILES CLOSED FOR INCOMPLETENESS
0
$0
1
$308,640
27
$261,157
0
$0
1
$217,950
0
$0
Aggregated Statistics For Year 2003 (Based on 6 partial tracts)
B) Conventional Home Purchase Loans
C) Refinancings
D) Home Improvement Loans
F) Non-occupant Loans on < 5 Family Dwellings (A B C & D)
Number
Average Value
Number
Average Value
Number
Average Value
Number
Average Value
LOANS ORIGINATED
204
$238,109
1,087
$206,928
35
$72,933
28
$183,859
APPLICATIONS APPROVED, NOT ACCEPTED
18
$173,568
117
$218,297
7
$49,584
1
$134,120
APPLICATIONS DENIED
11
$294,683
135
$268,356
19
$66,239
3
$125,793
APPLICATIONS WITHDRAWN
17
$270,631
95
$226,762
0
$0
2
$110,450
FILES CLOSED FOR INCOMPLETENESS
1
$186,730
27
$253,124
2
$213,425
0
$0
Aggregated Statistics For Year 2002 (Based on 6 partial tracts)
A) FHA, FSA/RHS & VA Home Purchase Loans
B) Conventional Home Purchase Loans
C) Refinancings
D) Home Improvement Loans
F) Non-occupant Loans on < 5 Family Dwellings (A B C & D)
Number
Average Value
Number
Average Value
Number
Average Value
Number
Average Value
Number
Average Value
LOANS ORIGINATED
2
$189,185
159
$225,088
741
$213,265
33
$43,100
14
$257,711
APPLICATIONS APPROVED, NOT ACCEPTED
1
$122,430
14
$223,228
56
$200,125
9
$58,029
0
$0
APPLICATIONS DENIED
1
$107,510
11
$453,140
70
$214,823
10
$33,606
0
$0
APPLICATIONS WITHDRAWN
0
$0
16
$211,869
71
$212,188
3
$71,800
2
$185,745
FILES CLOSED FOR INCOMPLETENESS
0
$0
9
$191,318
26
$233,303
2
$8,535
3
$38,613
Aggregated Statistics For Year 2001 (Based on 6 partial tracts)
A) FHA, FSA/RHS & VA Home Purchase Loans
B) Conventional Home Purchase Loans
C) Refinancings
D) Home Improvement Loans
E) Loans on Dwellings For 5+ Families
F) Non-occupant Loans on < 5 Family Dwellings (A B C & D)
Number
Average Value
Number
Average Value
Number
Average Value
Number
Average Value
Number
Average Value
Number
Average Value
LOANS ORIGINATED
2
$226,780
190
$216,762
490
$194,813
45
$41,664
2
$461,055
8
$133,110
APPLICATIONS APPROVED, NOT ACCEPTED
0
$0
12
$230,428
31
$179,417
12
$35,402
0
$0
0
$0
APPLICATIONS DENIED
1
$116,770
9
$116,263
62
$280,435
16
$42,271
0
$0
2
$42,685
APPLICATIONS WITHDRAWN
1
$202,160
11
$199,625
48
$191,232
7
$33,206
0
$0
0
$0
FILES CLOSED FOR INCOMPLETENESS
0
$0
4
$205,918
29
$265,408
0
$0
0
$0
0
$0
Aggregated Statistics For Year 2000 (Based on 6 partial tracts)
A) FHA, FSA/RHS & VA Home Purchase Loans
B) Conventional Home Purchase Loans
C) Refinancings
D) Home Improvement Loans
E) Loans on Dwellings For 5+ Families
F) Non-occupant Loans on < 5 Family Dwellings (A B C & D)
Number
Average Value
Number
Average Value
Number
Average Value
Number
Average Value
Number
Average Value
Number
Average Value
LOANS ORIGINATED
3
$148,417
186
$190,397
143
$168,593
33
$75,654
1
$193,410
8
$159,126
APPLICATIONS APPROVED, NOT ACCEPTED
1
$178,240
25
$178,910
28
$190,370
11
$52,173
0
$0
0
$0
APPLICATIONS DENIED
2
$115,250
12
$239,027
57
$209,809
10
$31,798
0
$0
2
$103,090
APPLICATIONS WITHDRAWN
0
$0
18
$150,911
27
$234,414
5
$31,776
0
$0
0
$0
FILES CLOSED FOR INCOMPLETENESS
0
$0
2
$153,540
12
$273,558
0
$0
0
$0
0
$0
Aggregated Statistics For Year 1999 (Based on 3 partial tracts)
A) FHA, FSA/RHS & VA Home Purchase Loans
B) Conventional Home Purchase Loans
C) Refinancings
D) Home Improvement Loans
E) Loans on Dwellings For 5+ Families
F) Non-occupant Loans on < 5 Family Dwellings (A B C & D)
2003 - 2018 National Fire Incident Reporting System (NFIRS) incidents
According to the data from the years 2003 - 2018 the average number of fires per year is 67. The highest number of fires - 104 took place in 2010, and the least - 1 in 2004. The data has a growing trend.
When looking into fire subcategories, the most reports belonged to: Structure Fires (51.4%), and Outside Fires (27.3%).
Fire incident types reported to NFIRS in Zip Code 60464


 Nearest zip codes: 60462, 60465, 60467, 60480, 60457, 60463.


 According to the data from the years 2003 - 2018 the average number of fires per year is 67. The highest number of fires - 104 took place in 2010, and the least - 1 in 2004. The data has a growing trend.
 When looking into fire subcategories, the most reports belonged to: Structure Fires (51.4%), and Outside Fires (27.3%).