Races in Jackson, Mississippi (MS) Detailed Stats
Data:
Races - White alone (%)
Races - White alone (% change since 2000)
Races - Black alone (%)
Races - Black alone (% change since 2000)
Races - American Indian alone (%)
Races - American Indian alone (% change since 2000)
Races - Asian alone (%)
Races - Asian alone (% change since 2000)
Races - Hispanic (%)
Races - Hispanic (% change since 2000)
Races - Native Hawaiian and Other Pacific Islander alone (%)
Races - Native Hawaiian and Other Pacific Islander alone (% change since 2000)
Races - Two or more races(%)
Races - Two or more races(% change since 2000)
Races - Other race alone (%)
Races - Other race alone (% change since 2000)
Racial diversity
Place of birth - Born in state of residence (%)
Place of birth - Born in state of residence (%) - White
Place of birth - Born in state of residence (%) - Black or African American
Place of birth - Born in state of residence (%) - Asian
Place of birth - Born in state of residence (%) - Hispanic or Latino
Place of birth - Born in state of residence (%) - American Indian and Alaska Native
Place of birth - Born in state of residence (%) - Multirace
Place of birth - Born in state of residence (%) - Other Race
Place of birth - Born in other state (%)
Place of birth - Born in other state (%) - White
Place of birth - Born in other state (%) - Black or African American
Place of birth - Born in other state (%) - Asian
Place of birth - Born in other state (%) - Hispanic or Latino
Place of birth - Born in other state (%) - American Indian and Alaska Native
Place of birth - Born in other state (%) - Multirace
Place of birth - Born in other state (%) - Other Race
Place of birth - Native, outside of US (%)
Place of birth - Native, outside of US (%) - White
Place of birth - Native, outside of US (%) - Black or African American
Place of birth - Native, outside of US (%) - Asian
Place of birth - Native, outside of US (%) - Hispanic or Latino
Place of birth - Native, outside of US (%) - American Indian and Alaska Native
Place of birth - Native, outside of US (%) - Multirace
Place of birth - Native, outside of US (%) - Other Race
Place of birth - Foreign born (%)
Place of birth - Foreign born (%) - White
Place of birth - Foreign born (%) - Black or African American
Place of birth - Foreign born (%) - Asian
Place of birth - Foreign born (%) - Hispanic or Latino
Place of birth - Foreign born (%) - American Indian and Alaska Native
Place of birth - Foreign born (%) - Multirace
Place of birth - Foreign born (%) - Other Race
Residents speaking English at home (%)
Residents speaking English at home - Born in the United States (%)
Residents speaking English at home - Native, born elsewhere (%)
Residents speaking English at home - Foreign born (%)
Residents speaking Spanish at home (%)
Residents speaking Spanish at home - Born in the United States (%)
Residents speaking Spanish at home - Native, born elsewhere (%)
Residents speaking Spanish at home - Foreign born (%)
Residents speaking other language at home (%)
Residents speaking other language at home - Born in the United States (%)
Residents speaking other language at home - Native, born elsewhere (%)
Residents speaking other language at home - Foreign born (%)
Marital status - Never married (%)
Marital status - Now married (%)
Marital status - Separated (%)
Marital status - Widowed (%)
Marital status - Divorced (%)
Ancestries Reported - Arab (%)
Ancestries Reported - Czech (%)
Ancestries Reported - Danish (%)
Ancestries Reported - Dutch (%)
Ancestries Reported - English (%)
Ancestries Reported - French (%)
Ancestries Reported - French Canadian (%)
Ancestries Reported - German (%)
Ancestries Reported - Greek (%)
Ancestries Reported - Hungarian (%)
Ancestries Reported - Irish (%)
Ancestries Reported - Italian (%)
Ancestries Reported - Lithuanian (%)
Ancestries Reported - Norwegian (%)
Ancestries Reported - Polish (%)
Ancestries Reported - Portuguese (%)
Ancestries Reported - Russian (%)
Ancestries Reported - Scotch-Irish (%)
Ancestries Reported - Scottish (%)
Ancestries Reported - Slovak (%)
Ancestries Reported - Subsaharan African (%)
Ancestries Reported - Swedish (%)
Ancestries Reported - Swiss (%)
Ancestries Reported - Ukrainian (%)
Ancestries Reported - United States (%)
Ancestries Reported - Welsh (%)
Ancestries Reported - West Indian (%)
Ancestries Reported - Other (%)
Geographical mobility - Same house 1 year ago (%)
Geographical mobility - Same house 1 year ago (%) - White
Geographical mobility - Same house 1 year ago (%) - Black or African American
Geographical mobility - Same house 1 year ago (%) - Asian
Geographical mobility - Same house 1 year ago (%) - Hispanic or Latino
Geographical mobility - Same house 1 year ago (%) - American Indian and Alaska Native
Geographical mobility - Same house 1 year ago (%) - Multirace
Geographical mobility - Same house 1 year ago (%) - Other Race
Geographical mobility - Moved within same county (%)
Geographical mobility - Moved within same county (%) - White
Geographical mobility - Moved within same county (%) - Black or African American
Geographical mobility - Moved within same county (%) - Asian
Geographical mobility - Moved within same county (%) - Hispanic or Latino
Geographical mobility - Moved within same county (%) - American Indian and Alaska Native
Geographical mobility - Moved within same county (%) - Multirace
Geographical mobility - Moved within same county (%) - Other Race
Geographical mobility - Moved from different county within same state (%)
Geographical mobility - Moved from different county within same state (%) - White
Geographical mobility - Moved from different county within same state (%) - Black or African American
Geographical mobility - Moved from different county within same state (%) - Asian
Geographical mobility - Moved from different county within same state (%) - Hispanic or Latino
Geographical mobility - Moved from different county within same state (%) - American Indian and Alaska Native
Geographical mobility - Moved from different county within same state (%) - Multirace
Geographical mobility - Moved from different county within same state (%) - Other Race
Geographical mobility - Moved from different state (%)
Geographical mobility - Moved from different state (%) - White
Geographical mobility - Moved from different state (%) - Black or African American
Geographical mobility - Moved from different state (%) - Asian
Geographical mobility - Moved from different state (%) - Hispanic or Latino
Geographical mobility - Moved from different state (%) - American Indian and Alaska Native
Geographical mobility - Moved from different state (%) - Multirace
Geographical mobility - Moved from different state (%) - Other Race
Geographical mobility - Moved from abroad (%)
Geographical mobility - Moved from abroad (%) - White
Geographical mobility - Moved from abroad (%) - Black or African American
Geographical mobility - Moved from abroad (%) - Asian
Geographical mobility - Moved from abroad (%) - Hispanic or Latino
Geographical mobility - Moved from abroad (%) - American Indian and Alaska Native
Geographical mobility - Moved from abroad (%) - Multirace
Geographical mobility - Moved from abroad (%) - Other Race
Place of birth for the foreign-born population - Ireland (%)
Place of birth for the foreign-born population - Denmark (%)
Place of birth for the foreign-born population - Norway (%)
Place of birth for the foreign-born population - Sweden (%)
Place of birth for the foreign-born population - United Kingdom (%)
Place of birth for the foreign-born population - England (%)
Place of birth for the foreign-born population - Scotland (%)
Place of birth for the foreign-born population - Other Northern Europe (%)
Place of birth for the foreign-born population - Austria (%)
Place of birth for the foreign-born population - Belgium (%)
Place of birth for the foreign-born population - France (%)
Place of birth for the foreign-born population - Germany (%)
Place of birth for the foreign-born population - Netherlands (%)
Place of birth for the foreign-born population - Switzerland (%)
Place of birth for the foreign-born population - Other Western Europe (%)
Place of birth for the foreign-born population - Greece (%)
Place of birth for the foreign-born population - Italy (%)
Place of birth for the foreign-born population - Portugal (%)
Place of birth for the foreign-born population - Spain (%)
Place of birth for the foreign-born population - Other Southern Europe (%)
Place of birth for the foreign-born population - Albania (%)
Place of birth for the foreign-born population - Belarus (%)
Place of birth for the foreign-born population - Bosnia and Herzegovina (%)
Place of birth for the foreign-born population - Bulgaria (%)
Place of birth for the foreign-born population - Croatia (%)
Place of birth for the foreign-born population - Czechoslovakia (%)
Place of birth for the foreign-born population - Hungary (%)
Place of birth for the foreign-born population - Latvia (%)
Place of birth for the foreign-born population - Lithuania (%)
Place of birth for the foreign-born population - North Macedonia (Macedonia) (%)
Place of birth for the foreign-born population - Moldova (%)
Place of birth for the foreign-born population - Poland (%)
Place of birth for the foreign-born population - Romania (%)
Place of birth for the foreign-born population - Russia (%)
Place of birth for the foreign-born population - Serbia (%)
Place of birth for the foreign-born population - Ukraine (%)
Place of birth for the foreign-born population - Other Eastern Europe (%)
Place of birth for the foreign-born population - China (%)
Place of birth for the foreign-born population - Hong Kong (%)
Place of birth for the foreign-born population - Taiwan (%)
Place of birth for the foreign-born population - Japan (%)
Place of birth for the foreign-born population - Korea (%)
Place of birth for the foreign-born population - Other Eastern Asia (%)
Place of birth for the foreign-born population - Afghanistan (%)
Place of birth for the foreign-born population - Bangladesh (%)
Place of birth for the foreign-born population - India (%)
Place of birth for the foreign-born population - Iran (%)
Place of birth for the foreign-born population - Kazakhstan (%)
Place of birth for the foreign-born population - Nepal (%)
Place of birth for the foreign-born population - Pakistan (%)
Place of birth for the foreign-born population - Sri Lanka (%)
Place of birth for the foreign-born population - Uzbekistan (%)
Place of birth for the foreign-born population - Other South Central Asia (%)
Place of birth for the foreign-born population - Burma (%)
Place of birth for the foreign-born population - Cambodia (%)
Place of birth for the foreign-born population - Indonesia (%)
Place of birth for the foreign-born population - Laos (%)
Place of birth for the foreign-born population - Malaysia (%)
Place of birth for the foreign-born population - Philippines (%)
Place of birth for the foreign-born population - Singapore (%)
Place of birth for the foreign-born population - Thailand (%)
Place of birth for the foreign-born population - Vietnam (%)
Place of birth for the foreign-born population - Other South Eastern Asia (%)
Place of birth for the foreign-born population - Armenia (%)
Place of birth for the foreign-born population - Iraq (%)
Place of birth for the foreign-born population - Israel (%)
Place of birth for the foreign-born population - Jordan (%)
Place of birth for the foreign-born population - Kuwait (%)
Place of birth for the foreign-born population - Lebanon (%)
Place of birth for the foreign-born population - Saudi Arabia (%)
Place of birth for the foreign-born population - Syria (%)
Place of birth for the foreign-born population - Turkey (%)
Place of birth for the foreign-born population - Yemen (%)
Place of birth for the foreign-born population - Other Western Asia (%)
Place of birth for the foreign-born population - Eritrea (%)
Place of birth for the foreign-born population - Ethiopia (%)
Place of birth for the foreign-born population - Kenya (%)
Place of birth for the foreign-born population - Somalia (%)
Place of birth for the foreign-born population - Uganda (%)
Place of birth for the foreign-born population - Zimbabwe (%)
Place of birth for the foreign-born population - Other Eastern Africa (%)
Place of birth for the foreign-born population - Cameroon (%)
Place of birth for the foreign-born population - Congo (%)
Place of birth for the foreign-born population - Democratic Republic of Congo (Zaire) (%)
Place of birth for the foreign-born population - Other Middle Africa (%)
Place of birth for the foreign-born population - Egypt (%)
Place of birth for the foreign-born population - Morocco (%)
Place of birth for the foreign-born population - Sudan (%)
Place of birth for the foreign-born population - Other Northern Africa (%)
Place of birth for the foreign-born population - South Africa (%)
Place of birth for the foreign-born population - Other Southern Africa (%)
Place of birth for the foreign-born population - Cabo Verde (%)
Place of birth for the foreign-born population - Ghana (%)
Place of birth for the foreign-born population - Liberia (%)
Place of birth for the foreign-born population - Nigeria (%)
Place of birth for the foreign-born population - Senegal (%)
Place of birth for the foreign-born population - Sierra Leone (%)
Place of birth for the foreign-born population - Other Western Africa (%)
Place of birth for the foreign-born population - Australia (%)
Place of birth for the foreign-born population - New Zealand (%)
Place of birth for the foreign-born population - Fiji (%)
Place of birth for the foreign-born population - Micronesia (%)
Place of birth for the foreign-born population - Bahamas (%)
Place of birth for the foreign-born population - Barbados (%)
Place of birth for the foreign-born population - Cuba (%)
Place of birth for the foreign-born population - Dominica (%)
Place of birth for the foreign-born population - Dominican Republic (%)
Place of birth for the foreign-born population - Grenada (%)
Place of birth for the foreign-born population - Haiti (%)
Place of birth for the foreign-born population - Jamaica (%)
Place of birth for the foreign-born population - St. Vincent and the Grenadines (%)
Place of birth for the foreign-born population - Trinidad and Tobago (%)
Place of birth for the foreign-born population - West Indies (%)
Place of birth for the foreign-born population - Other Caribbean (%)
Place of birth for the foreign-born population - Belize (%)
Place of birth for the foreign-born population - Costa Rica (%)
Place of birth for the foreign-born population - El Salvador (%)
Place of birth for the foreign-born population - Guatemala (%)
Place of birth for the foreign-born population - Honduras (%)
Place of birth for the foreign-born population - Mexico (%)
Place of birth for the foreign-born population - Nicaragua (%)
Place of birth for the foreign-born population - Panama (%)
Place of birth for the foreign-born population - Other Central America (%)
Place of birth for the foreign-born population - Argentina (%)
Place of birth for the foreign-born population - Bolivia (%)
Place of birth for the foreign-born population - Brazil (%)
Place of birth for the foreign-born population - Chile (%)
Place of birth for the foreign-born population - Colombia (%)
Place of birth for the foreign-born population - Ecuador (%)
Place of birth for the foreign-born population - Guyana (%)
Place of birth for the foreign-born population - Peru (%)
Place of birth for the foreign-born population - Uruguay (%)
Place of birth for the foreign-born population - Venezuela (%)
Place of birth for the foreign-born population - Other South America (%)
Place of birth for the foreign-born population - Canada (%)
Place of birth for the foreign-born population - Other Northern America (%)
Place of birth for the foreign-born population - Other (%)
Latest news about races in Jackson, MS collected exclusively by city-data.com from local newspapers, TV, and radio stations
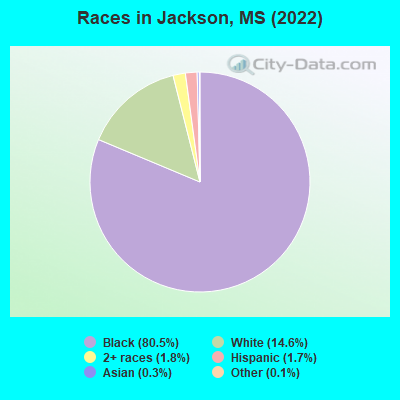
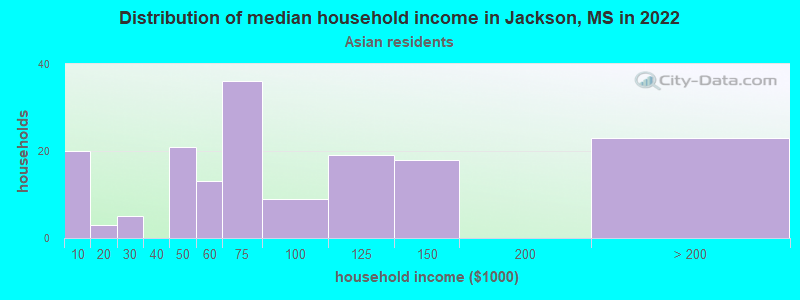
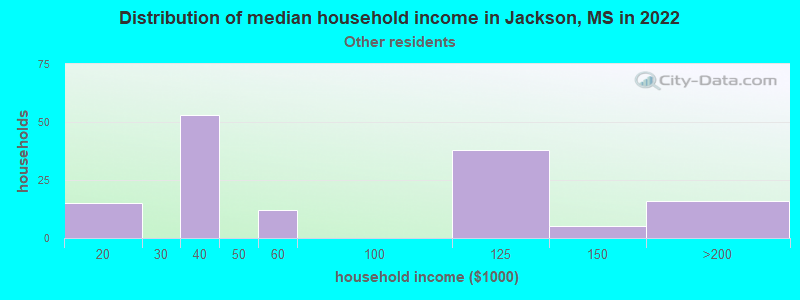
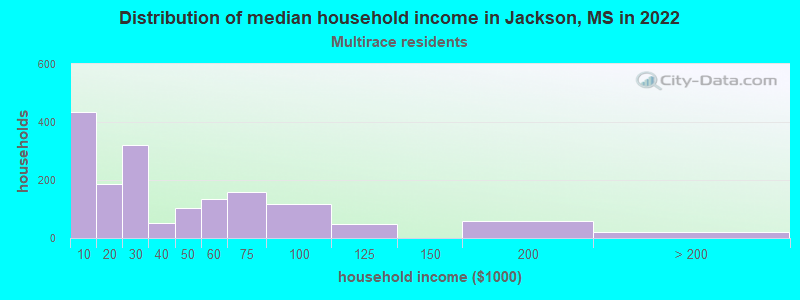
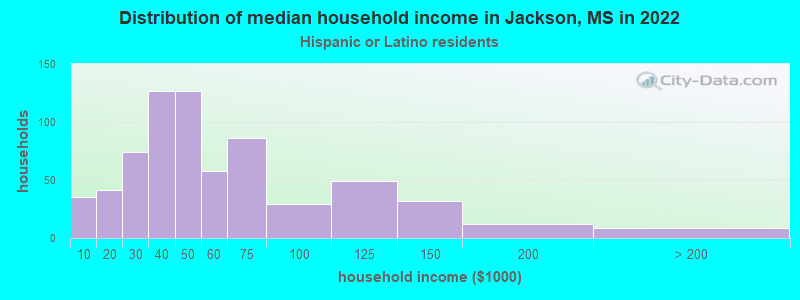
According to 2022 data, the most numerous races in Jackson, MS are White alone (22,176 residents), Black alone (122,669 residents), and Hispanic (2,573 residents). 96.7% of Jackson residents speak English at home. 1.4% of Jackson, MS residents are foreign-born , which is 39.0% less than the foreign-born rate of 2.0% across the entire state of Mississippi.
Race distribution in Jackson
2000 2022
1,727,908 60.7% White alone 1,028,473 36.2% Black alone 39,569 1.4% Hispanic 17,272 0.6% Two or more races 18,349 0.6% Asian alone 11,224 0.4% American Indian alone 1,294 0.05% Other race alone 569 0.02% Native Hawaiian and Other
1,625,979 55.3% White alone 1,072,962 36.5% Black alone 97,177 3.3% Hispanic 96,367 3.3% Two or more races 25,217 0.9% Asian alone 12,457 0.4% American Indian alone 9,501 0.3% Other race alone 397 0.01% Native Hawaiian and Other
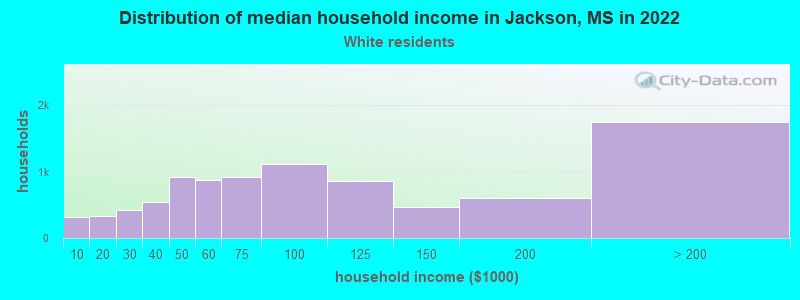
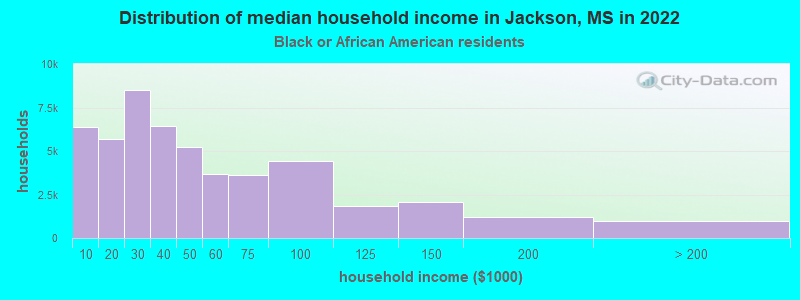
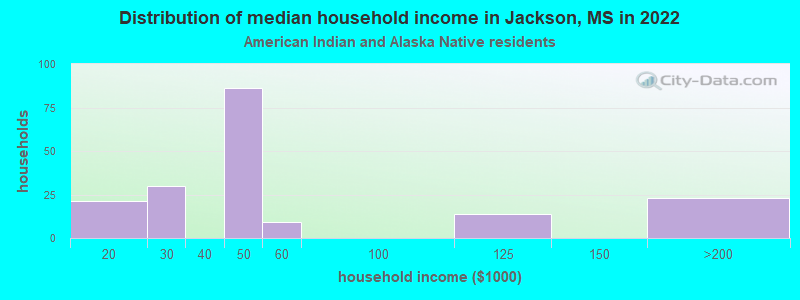
Income and house value in Jackson Median household income in 2022 $81,929 White non-Hispanic householders$37,092 Black householders$2,499 Asian householders$32,000 Some other race householders$27,068 Two or more races householders$28,370 Hispanic or Latino race householdersMedian 2022 house value $154,898 White Non-Hispanic householders$97,727 Black or African American householders$113,092 American Indian or Alaska Native householders $372,149 Asian householders$131,851 Some other race householders$118,094 Two or more races householders$114,164 Hispanic or Latino householders
Median age by race in Jackson
43.0 Median age for White residents44.9 40.0 35.9 Median age for Black or African American residents33.9 39.2 32.2 Median age for American Indian / Alaska Native residents40.6 32.5 26.0 Median age for Asian residents23.6 44.6 -666,666,666.0 Median age for Native Hawaiian / Pacific Islander residents-666,666,666.0 -666,666,666.0 39.4 Median age for Other race residents19.4 43.4 17.1 Median age for Two or more races residents9.8 25.4 43.3 Median age for White alone residents45.7 40.2 28.6 Median age for Hispanic or Latino residents19.8 43.1
Owner/renter occupied households by race in Jackson
House owners and renters - White residents 6,522 71.5% Owner occupied2,604 28.5% Renter occupiedHouse owners and renters - Black or African American residents 23,510 47.0% Owner occupied26,549 53.0% Renter occupiedHouse owners and renters - American Indian / Alaska Native residents 165 78.4% Owner occupied45 21.6% Renter occupiedHouse owners and renters - Asian residents 71 32.7% Owner occupied147 67.3% Renter occupiedHouse owners and renters - Other race residents 82 54.8% Owner occupied67 45.2% Renter occupiedHouse owners and renters - Two or more races residents 1,164 57.5% Owner occupied861 42.5% Renter occupiedHouse owners and renters - White alone residents 6,522 71.7% Owner occupied2,572 28.3% Renter occupiedHouse owners and renters - Hispanic or Latino residents 405 55.9% Owner occupied319 44.1% Renter occupied
Language usage in Jackson
English speakers - Total 96.7% of residents of Jackson speak English at home.
2.3% of residents speak Spanish at home 2,076 65.4% Speak English very well1,098 34.6% Speak English less than very well1.0% of residents speak other language at home 1,063 78.5% Speak English very well292 21.5% Speak English less than very well
English speakers - Born in the United States 96.7% of residents of Jackson speak English at home.
2.5% of residents speak Spanish at home 463 79.4% Speak English very well120 20.6% Speak English less than very well0.7% of residents speak other language at home 167 100.0% Speak English very well
English speakers - Native, born elsewhere 77.8% of residents of Jackson speak English at home.
3.0% of residents speak Spanish at home 13 100.0% Speak English very well0.7% of residents speak other language at home 3 100.0% Speak English very well
English speakers - Foreign-born 7.8% of residents of Jackson speak English at home.
55.4% of residents speak Spanish at home 123 11.5% Speak English very well944 88.5% Speak English less than very well35.4% of residents speak other language at home 431 63.2% Speak English very well251 36.8% Speak English less than very well
White (Caucasian) - Speak only English Native:
98.6% (20,747)Foreign-born:
15.4% (46)
White (Caucasian) - Speak another language Native:
1.3% (275)Foreign-born:
74.5% (223)
Black or African American - Speak only English Native:
98.5% (107,357)Foreign-born:
41.4% (377)
Black or African American - Speak another language Native:
1.5% (1,628)Foreign-born:
58.6% (534)
American Indian / Alaska Native - Speak another language Native:
5.8% (8)Foreign-born:
100.0% (96)
Asian - Speak only English Native:
43.4% (162)Foreign-born:
29.8% (60)
Asian - Speak another language Native:
59.2% (221)Foreign-born:
91.8% (185)
Other race - Speak another language Native:
71.5% (315)Foreign-born:
100.0% (405)
Two or more races - Speak another language Native:
14.4% (427)Foreign-born:
100.0% (638)
White alone - Speak only English Native:
98.4% (20,591)Foreign-born:
17.7% (41)
White alone - Speak another language Native:
1.6% (333)Foreign-born:
86.4% (201)
Hispanic or Latino - Speak another language Native:
36.6% (564)Foreign-born:
100.0% (1,102)
Foreign-born residents in Jackson 2,120 residents are foreign born
This city:
1.4%Mississippi:
2.3%
Marital status for residents in Jackson Marital status - White (Caucasian) population 15 years and over
Males 27.8% Never married56.5% Now married0.0% Separated3.0% Widowed12.7% DivorcedFemales 27.4% Never married49.9% Now married2.6% Separated9.0% Widowed11.1% DivorcedWomen who gave birth in the past 12 months Now married:
90.4% (338)Unmarried:
9.6% (36)
Women who did not give birth in the past 12 months Now married:
41.2% (1,904)Unmarried:
58.8% (2,718)
Marital status - Black or African American population 15 years and over
Males 57.4% Never married27.3% Now married2.4% Separated3.3% Widowed9.6% DivorcedFemales 54.0% Never married22.8% Now married3.5% Separated6.6% Widowed13.1% DivorcedWomen who gave birth in the past 12 months Now married:
25.7% (366)Unmarried:
74.3% (1,056)
Women who did not give birth in the past 12 months Now married:
20.2% (6,153)Unmarried:
79.8% (24,312)
Marital status - American Indian / Alaska Native population 15 years and over
Males 3.4% Never married21.8% Now married62.2% Separated0.0% Widowed12.6% DivorcedFemales 0.0% Never married9.1% Now married59.1% Separated8.0% Widowed23.9% DivorcedWomen who gave birth in the past 12 months Now married:
100.0% (2)Unmarried:
0.0% (0)
Women who did not give birth in the past 12 months Now married:
100.0% (53)Unmarried:
0.0% (0)
Marital status - Asian population 15 years and over
Males 53.3% Never married37.7% Now married0.0% Separated0.0% Widowed9.0% DivorcedFemales 37.5% Never married35.6% Now married0.0% Separated24.1% Widowed2.9% DivorcedWomen who did not give birth in the past 12 months Now married:
37.2% (59)Unmarried:
62.8% (100)
Marital status - Other race population 15 years and over
Males 53.4% Never married40.8% Now married0.0% Separated0.0% Widowed5.8% DivorcedFemales 60.5% Never married39.5% Now married0.0% Separated0.0% Widowed0.0% DivorcedWomen who gave birth in the past 12 months Now married:
22.8% (30)Unmarried:
77.2% (102)
Women who did not give birth in the past 12 months Now married:
49.6% (82)Unmarried:
50.4% (83)
Marital status - Two or more races population 15 years and over
Males 58.6% Never married31.2% Now married7.4% Separated0.0% Widowed2.8% DivorcedFemales 50.1% Never married16.5% Now married8.1% Separated7.3% Widowed18.0% DivorcedWomen who gave birth in the past 12 months Now married:
100.0% (54)Unmarried:
0.0% (0)
Women who did not give birth in the past 12 months Now married:
25.1% (244)Unmarried:
74.9% (727)
Marital status - White alone, not Hispanic / Latino population 15 years and over
Males 27.8% Never married56.5% Now married0.0% Separated3.0% Widowed12.7% DivorcedFemales 27.9% Never married49.0% Now married2.7% Separated9.2% Widowed11.3% DivorcedWomen who gave birth in the past 12 months Now married:
89.5% (306)Unmarried:
10.5% (36)
Women who did not give birth in the past 12 months Now married:
39.9% (1,805)Unmarried:
60.1% (2,718)
Marital status - Hispanic or Latino population 15 years and over
Males 47.9% Never married33.5% Now married11.1% Separated0.0% Widowed7.4% DivorcedFemales 29.8% Never married41.3% Now married12.8% Separated7.7% Widowed8.4% DivorcedWomen who gave birth in the past 12 months Now married:
24.5% (37)Unmarried:
75.5% (115)
Women who did not give birth in the past 12 months Now married:
64.6% (356)Unmarried:
35.4% (196)
Ancestries in Jackson
2,594 2.2% English2,366 2.0% American1,794 1.5% African1,401 1.2% Irish1,275 1.1% European807 0.7% German632 0.5% Scotch-Irish369 0.3% Scottish286 0.2% Nigerian256 0.2% Italian223 0.2% Israeli221 0.2% British166 0.1% Polish127 0.1% French112 0.09% Dutch74 0.06% Jamaican63 0.05% Lebanese63 0.05% Ethiopian58 0.05% Greek53 0.04% French Canadian52 0.04% Iranian45 0.04% Egyptian45 0.04% Scandinavian43 0.04% Northern European42 0.04% Haitian41 0.03% Norwegian37 0.03% Moroccan27 0.02% Welsh26 0.02% Swiss23 0.02% Portuguese18 0.02% Danish17 0.01% Slovak15 0.01% Cajun12 0.01% Ukrainian9 0.01% Serbian8 0.01% Czech8 0.01% Canadian7 0.01% Belgian7 0.01% Albanian6 0.01% Bulgarian
Geographical mobility in Jackson Same house 1 year ago 17,823 85.0% White (Caucasian)91,211 79.6% Black or African American332 91.7% American Indian / Alaska Native405 83.9% Asian6 100.0% Native Hawaiian / Pacific Islander621 68.4% Other race3,164 80.6% Two or more races17,704 85.4% White alone, not Hispanic / Latino1,829 72.9% Hispanic or LatinoMoved within same county 2,229 10.6% White / Caucasian15,718 13.7% Black or African American41 11.4% American Indian / Alaska Native7 1.5% Asian176 19.4% Other race324 8.3% Two or more races2,130 10.3% White alone, not Hispanic / Latino222 8.8% Hispanic or LatinoMoved within same state 703 3.4% White / Caucasian3,594 3.1% Black or African American4 1.2% American Indian / Alaska Native15 3.1% Asian70 7.7% Other race246 6.3% Two or more races671 3.2% White alone, not Hispanic / Latino331 13.2% Hispanic or LatinoMoved from different state 222 1.1% White / Caucasian4,118 3.6% Black or African American18 3.8% Asian108 2.7% Two or more races222 1.1% White alone, not Hispanic / Latino25 1.0% Hispanic or LatinoMoved from abroad 57 11.8% Asian15 0.6% Hispanic or Latino
Children Nativity (place of birth) in Jackson
Children under 6 years - Living with two parents Both parents native 3,472 99.9% Native3 0.1% Foreign-bornBoth parents foreign-born 119 75.3% Native39 24.7% Foreign-bornOne native, one foreign-born parent 38 100.0% NativeChildren under 6 years - Living with one parent Native parent 7,058 100.0% NativeForeign-born parent 209 81.2% Native48 18.8% Foreign-bornChildren 6 to 17 years - Living with two parents Both parents native 7,536 100.0% NativeBoth parents foreign-born 141 77.1% Native42 22.9% Foreign-bornOne native, one foreign-born parent 103 100.0% NativeChildren 6 to 17 years - Living with one parent Native parent 14,559 100.0% NativeForeign-born parent 79 60.7% Native51 39.3% Foreign-born
Grandparents responsible for own grandchildren in Jackson
Grandparents (30 to 59 years) White / Caucasian 12 16.5% Responsible for grandchildren61 83.5% Not responsible for grandchildrenBlack or African American 895 76.6% Responsible for grandchildren273 23.4% Not responsible for grandchildrenAmerican Indian / Alaska Native 4 100.0% Responsible for grandchildrenAsian 22 100.0% Not responsible for grandchildrenTwo or more races 40 100.0% Not responsible for grandchildrenWhite alone, not Hispanic / Latino 12 16.6% Responsible for grandchildren61 83.4% Not responsible for grandchildrenGrandparents (60 years and over) White / Caucasian 72 100.0% Responsible for grandchildrenBlack or African American 191 20.0% Responsible for grandchildren762 80.0% Not responsible for grandchildrenAsian 23 100.0% Not responsible for grandchildrenTwo or more races 10 44.4% Responsible for grandchildren13 55.6% Not responsible for grandchildrenWhite alone, not Hispanic / Latino 72 100.0% Responsible for grandchildren
Zip codes: 39157 , 39174 , 39201 , 39202 , 39203 , 39204 , 39206 , 39211 , 39216 , 39217 , 39269.