Averages for the 2020 tax year for zip code 39203, filed in 2021:
Average Adjusted Gross Income (AGI) in 2020: $22,560 (Individual Income Tax Returns)
Here:
$22,560
State:
$54,084
Salary/wage: $21,171 (reported on 84.8% of returns)
Here:
$21,171
State:
$45,187
(% of AGI for various income ranges: 1146.5% for AGIs below $25k, 3493.4% for AGIs $25k-50k, 6510.0% for AGIs $50k-75k, 14305.0% for AGIs $75k-100k)
Taxable interest for individuals: $88 (reported on 4.9% of returns)
This zip code:
$88
Mississippi:
$1,434
(% of AGI for various income ranges: 0.2% for AGIs below $25k, 1.4% for AGIs $25k-50k)
Profit/loss from business: +$2,929 (reported on 18.9% of returns)
Here:
+$2,929
State:
+$7,724
(% of AGI for various income ranges: 97.7% for AGIs below $25k, 5.4% for AGIs $25k-50k)
Total itemized deductions: $17,633 (reported on 1.8% of returns)
Here:
$17,633
State:
$34,027
(% of AGI for various income ranges: 151.1% for AGIs $25k-50k)
Charity contributions: $7,400 (reported on 1.2% of returns)
Here:
$7,400
State:
$14,997
(% of AGI for various income ranges: 42.3% for AGIs $25k-50k)
Taxes paid: $3,400 (reported on 1.2% of returns)
39203:
$3,400
State:
$6,353
(% of AGI for various income ranges: 19.4% for AGIs $25k-50k)
Earned income credit: $2,937 (reported on 49.4% of returns)
Here:
$2,937
State:
$2,689
(% of AGI for various income ranges: 207.9% for AGIs below $25k, 139.1% for AGIs $25k-50k)
Percentage of individuals using paid preparers for their 2020 taxes: 92.1%
Here:
92%
State:
94%
(% for various income ranges: 92.6% for AGIs below $25k, 93.2% for AGIs $25k-50k, 87.5% for AGIs $50k-75k, 75.0% for AGIs $75k-100k)
Averages for the 2012 tax year for zip code 39203, filed in 2013:
Average Adjusted Gross Income (AGI) in 2012: $18,653 (Individual Income Tax Returns)
Here:
$18,653
State:
$46,197
Salary/wage: $17,599 (reported on 89.2% of returns)
Here:
$17,599
State:
$38,549
(% of AGI for various income ranges: 86.0% for AGIs below $25k, 86.4% for AGIs $25k-50k, 75.9% for AGIs $50k-75k, 73.9% for AGIs $75k-100k)
Taxable interest for individuals: $522 (reported on 3.9% of returns)
This zip code:
$522
Mississippi:
$1,482
(% of AGI for various income ranges: 0.7% for AGIs $50k-75k)
Ordinary dividends: $7,460 (reported on 2.2% of returns)
Here:
$7,460
State:
$5,401
Net capital gain/loss in AGI: +$33 (reported on 1.3% of returns)
Here:
+$33
State:
+$12,121
Profit/loss from business: +$6,505 (reported on 16.4% of returns)
Here:
+$6,505
State:
+$10,220
(% of AGI for various income ranges: 10.2% for AGIs below $25k, 0.4% for AGIs $25k-50k)
Total itemized deductions: $15,820 (34% of AGI, reported on 6.5% of returns)
Here:
$15,820
State:
$22,078
Here:
34.2% of AGI
State:
21.8% of AGI
(% of AGI for various income ranges: 1.4% for AGIs below $25k, 9.1% for AGIs $25k-50k, 18.8% for AGIs $50k-75k)
Charity contributions: $4,315 (reported on 5.6% of returns)
Here:
$4,315
State:
$6,081
(% of AGI for various income ranges: 0.4% for AGIs below $25k, 2.0% for AGIs $25k-50k, 4.5% for AGIs $50k-75k)
Taxes paid: $2,756 (reported on 6.9% of returns)
39203:
$2,756
State:
$5,794
(% of AGI for various income ranges: 0.2% for AGIs below $25k, 1.7% for AGIs $25k-50k, 3.7% for AGIs $50k-75k)
Earned income credit: $2,916 (reported on 58.6% of returns)
Here:
$2,916
State:
$2,710
(% of AGI for various income ranges: 15.5% for AGIs below $25k, 2.5% for AGIs $25k-50k)
Percentage of individuals using paid preparers for their 2012 taxes: 53.0%
Here:
53%
State:
60%
(% for various income ranges: 53.0% for AGIs below $25k, 54.3% for AGIs $25k-50k, 66.7% for AGIs $50k-75k)
Averages for the 2004 tax year for zip code 39203, filed in 2005:
Average Adjusted Gross Income (AGI) in 2004: $16,614 (Individual Income Tax Returns)
Here:
$16,614
State:
$36,110
Salary/wage: $15,734 (reported on 92.0% of returns)
Here:
$15,734
State:
$31,757
(% of AGI for various income ranges: 87.6% for AGIs below $10k, 90.9% for AGIs $10k-25k, 88.2% for AGIs $25k-50k, 81.2% for AGIs $50k-75k, 56.0% for AGIs $75k-100k)
Taxable interest for individuals: $779 (reported on 5.6% of returns)
This zip code:
$779
Mississippi:
$1,649
(% of AGI for various income ranges: 0.2% for AGIs below $10k, 0.2% for AGIs $10k-25k, 0.4% for AGIs $25k-50k, 0.1% for AGIs $50k-75k, 0.3% for AGIs $75k-100k)
Taxable dividends: $1,086 (reported on 1.6% of returns)
Here:
$1,086
State:
$3,089
Profit/loss from business: +$4,530 (reported on 8.3% of returns)
Here:
+$4,530
State:
+$8,818
Total itemized deductions: $13,227 (32% of AGI, reported on 6.4% of returns)
Here:
$13,227
State:
$17,896
Here:
32.4% of AGI
State:
22.5% of AGI
Charity contributions deductions: $3,812 (9% of AGI, reported on 5.9% of returns)
Here:
$3,812
State:
$4,735
Here:
9.3% of AGI
State:
5.7% of AGI
Total tax: $1,699 (reported on 39.8% of returns)
39203:
$1,699
State:
$5,562
(% of AGI for various income ranges: 1.7% for AGIs below $10k, 2.1% for AGIs $10k-25k, 5.2% for AGIs $25k-50k, 8.8% for AGIs $50k-75k, 13.0% for AGIs $75k-100k)
Earned income credit: $2,265 (reported on 64.2% of returns)
Here:
$2,265
State:
$2,107
Percentage of individuals using paid preparers for their 2004 taxes: 49.7%
Here:
50%
State:
65%
(% for various income ranges: 46.7% for AGIs below $10k, 50.8% for AGIs $10k-25k, 52.2% for AGIs $25k-50k, 53.1% for AGIs $50k-75k, 66.7% for AGIs $75k-100k)
Likely homosexual households (counted as self-reported same-sex unmarried-partner households)
Lesbian couples: 0.4% of all households
Gay men: 0.0% of all households
Household received Food Stamps/SNAP in the past 12 months: 652 Household did not receive Food Stamps/SNAP in the past 12 months: 1,304
Women who had a birth in the past 12 months: 113 (7 now married, 102 unmarried) Women who did not have a birth in the past 12 months: 1,295 (189 now married, 1,109 unmarried)
Housing units in zip code 39203 with a mortgage: 211 Median monthly owner costs for units with a mortgage: $769 Median monthly owner costs for units without a mortgage: $312
Residents with income below the poverty level in 2022:
This zip code:
31.1%
Whole state:
19.1%
Residents with income below 50% of the poverty level in 2022:
This zip code:
21.3%
Whole state:
10.3%
Median number of rooms in houses and condos:
Here:
5.8
State:
6.3
Median number of rooms in apartments:
Here:
4.0
State:
4.8
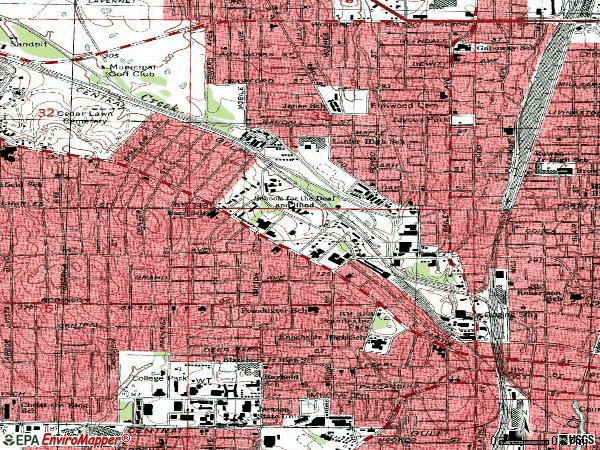
Notable locations in this zip code not listed on our city pages
Churches in zip code 39203 include: Saint Philip Lutheran Church (A), Saint Luther Baptist Church (B), Pratt Memorial United Methodist Church (C), Pilgrim Missionary Baptist Church (D), Pearlie Grove Missionary Baptist Church (E), Old Paths Church of God in Christ (F), New Mount Zion Baptist Church (G), Nazareth Lee Missionary Baptist Church (H), Mount Wade Baptist Church (I). Display/hide their locations on the map
In group quarters: 766 (-1 institutionalized population)
Size of family households: 311 2-persons, 341 3-persons, 219 4-persons, 60 5-persons, 35 6-persons, 6 7-or-more-persons
Size of nonfamily households: 910 1-person, 43 2-persons, 26 3-persons
335 married couples with children.
427 single-parent households (427 women).
97.1% of residents of 39203 zip code speak English at home.
1.8% of residents speak Spanish at home (88% very well, 12% well).
0.4% of residents speak other Indo-European language at home (100% very well).
0.5% of residents speak Asian or Pacific Island language at home (68% very well, 32% not well).
Foreign born population: 37 (0.8%) (43.4% of them are naturalized citizens)
Major facilities with environmental interests located in this zip code:
DICKERSON AND BOWEN INC (815 WEST FORTIFICATION STREET in JACKSON, MS)
AIR MINOR (AIRS/AFS) AIR SYNTHETIC MINOR (AIRS/AFS) STATE MASTER (Mississippi compliance, permits, activity tracking ) - ENSITE-04900146, AIR PROGRAM, ENSITE-MSU080013, WASTEWATER FACILITY, ENSITE-MSG110120, NPDES STORMWATER PERMIT STATE MASTER (Mississippi compliance, permits, activity tracking ) - ENSITE-04900181, AIR PROGRAM COMPLIANCE ACTIVITY (Tracking inspections of insecticide, fungicide, and rodenticide, and toxic substances) CRITERIA AND HAZARDOUS AIR POLLUTANT INVENTORY (Inventory of air pollution sources) National Pollutant Discharge Elimination System NON-MAJOR (Tracking pollutant discharge elimination systems) - permit Business SIC classification: ASPHALT PAVING MIXTURES AND BLOCKS; READY-MIXED CONCRETE Alternative names: HINDS COUNTY, MASTER MIX CONCRETE MATERIALS, MMC MATERIALS INC, JACKSON FORTIFICATION STREET, MISSISSIPPI MATERIALS CO.
MISSISSIPPI BATTERY (520 BROAD STREET in JACKSON, MS)
STATE MASTER (Mississippi compliance, permits, activity tracking ) - ENSITE-MSD985973338, TRANSPORTER (Resource Conservation and Recovery Act (tracking hazardous waste)) Organizations: LANDROUGH MILLER (CONTACT/OPERATOR)
, LANDOURGH MILLER (CONTACT/OWNER)
Alternative names: MISS BATTERY
APEX PRODUCTS INC (110 CAPERS AVENUE in JACKSON, MS)
AIR MAJOR (AIRS/AFS) AIR SYNTHETIC MINOR (AIRS/AFS) STATE MASTER (Mississippi compliance, permits, activity tracking ) - ENSITE-04900238, AIR PROGRAM CRITERIA AND HAZARDOUS AIR POLLUTANT INVENTORY (Inventory of air pollution sources) TRI REPORTER (Tracking of toxic chemicals releasing facilities) Business SIC classification: PLASTICS PLUMBING FIXTURES Business NAICS classification: PLASTICS PLUMBING FIXTURE MANUFACTURING. Alternative names: APEX PRODS. INC. FORMERLY ALEXANDER TILE & MARBLE INC., APEX PRODUCTS INC,MANUFACTURING PLANT, APEX PRODS. INC., APEX PRODUCTS INC,MANUFACTURING PLANT
MMC MATERIALS INC, PLANT NUMBER 30113 (FOREST AVENUE in JACKSON, MS)
STATE MASTER (Mississippi compliance, permits, activity tracking ) - ENSITE-MSG110240, NPDES STORMWATER PERMIT National Pollutant Discharge Elimination System NON-MAJOR (Tracking pollutant discharge elimination systems) - permit Business SIC classification: READY-MIXED CONCRETE Alternative names: HINDS
FERRARI SOUTH INC (419 SOUTH GALLATIN STREET in JACKSON, MS)
STATE MASTER (Mississippi compliance, permits, activity tracking ) - ENSITE-MSD985967991, CESQG Conditionally Exempt Small Quantity Generators, less than 100 kg/month of hazardous waste (Resource Conservation and Recovery Act (tracking hazardous waste)) - notification Organizations: EDWARD WETTACH III (CONTACT/OWNER)
FRAZIER FURNITURE REPAIR (942 WEST CAPITOL STREET in JACKSON, MS)
STATE MASTER (Mississippi compliance, permits, activity tracking ) - ENSITE-MSD985973288, CESQG Conditionally Exempt Small Quantity Generators, less than 100 kg/month of hazardous waste (Resource Conservation and Recovery Act (tracking hazardous waste)) - notification Organizations: DENNIS FRAZIER (CONTACT/OWNER)
GALLOWAY ELEMENTARY SCHOOL (186 IDLEWILD STREET in JACKSON, MS)
(Geographic Names Information System) (National Center for Education Statistics) - STATE ID-2520033 Organizations: JACKSON PUBLIC SCHOOL DIST (SCHOOL DISTRICT)
GREGORY MANUFACTURING COMPANY INC (110 CAPERS AVENUE in JACKSON, MS)
STATE MASTER (Mississippi compliance, permits, activity tracking ) - ENSITE-04900039, AIR PROGRAM, ENSITE-MSD008151714, CESQG Conditionally Exempt Small Quantity Generators, less than 100 kg/month of hazardous waste (Resource Conservation and Recovery Act (tracking hazardous waste)) - notification Business SIC classification: WOOD PRODUCTS; MARKING DEVICES Organizations: MR. & MRS. GENE GRIFFITHS (CONTACT/OWNER)
MMC MATERIALS INC, JACKSON GREEN STREET SITE (201 GREEN STREET in JACKSON, MS)
STATE MASTER (Mississippi compliance, permits, activity tracking ) - ENSITE-MSD982771677, CESQG Conditionally Exempt Small Quantity Generators, less than 100 kg/month of hazardous waste (Resource Conservation and Recovery Act (tracking hazardous waste)) - notification Organizations: MISSISSIPPI MATERIALS COMPANY, INC. (CONTACT/OWNER)
Alternative names: MISS MATERIALS COMPANY, INC.
BARR ELEMENTARY (1593 W CAPITOL STREET in JACKSON, MS)
(National Center for Education Statistics) - STATE ID-2520008 Organizations: JACKSON PUBLIC SCHOOL DIST (SCHOOL DISTRICT)
BLACKBURN MIDDLE SCHOOL (1311 W PEARL STREET in JACKSON, MS)
(National Center for Education Statistics) - STATE ID-2520010 Organizations: JACKSON PUBLIC SCHOOL DIST (SCHOOL DISTRICT)
CAPITAL AUTOMOTIVE SERVICE (880 WEST AMITE STREET in JACKSON, MS)
AIR MINOR (AIRS/AFS) Business SIC classification: GENERAL AUTOMOTIVE REPAIR SHOPS
G & S AUTO SALES (460 SOUTH GALLATIN STREET in JACKSON, MS)
AIR MINOR (AIRS/AFS) Business SIC classification: MOTOR VEHICLE DEALERS (USED ONLY) Alternative names: G & S AUTO INCORPORATED
Housing units lacking complete plumbing facilities: 15.9% Housing units lacking complete kitchen facilities: 12.7%
54.5%Electricity
43.0%Utility gas
1.0%No fuel used
0.7%Fuel oil, kerosene, etc.
0.6%Other fuel
Population in 1990: 15,641.
Place of birth for U.S.-born residents:
This state: 4,021
Midwest: 425
South: 276
West: 130
47% of the 39203 zip code residents lived in the same house 5 years ago. Out of people who lived in different houses, 66% lived in this county. Out of people who lived in different counties, 50% lived in Mississippi.
80% of the 39203 zip code residents lived in the same house 1 year ago. Out of people who lived in different houses, 54% moved from this county. Out of people who lived in different houses, 22% moved from different county within same state. Out of people who lived in different houses, 20% moved from different state.
Private vs. public school enrollment:
Students in private schools in grades 1 to 8 (elementary and middle school): 146
Here:
29.6%
Mississippi:
16.1%
Students in private schools in grades 9 to 12 (high school): 47
Here:
21.6%
Mississippi:
14.6%
Students in private undergraduate colleges: 96
Here:
16.7%
Mississippi:
12.8%
Occupation by median earnings in the past 12 months ($)
57,485Health diagnosing and treating practitioners and other technical occupations
29,697Office and administrative support occupations
29,474Construction and extraction occupations
28,977Production occupations
28,061Healthcare support occupations
27,779Management occupations
Companies with federal contracts located in this zip code:
TRU-AMP CORPORATION (406 W FORTIFICATION ST in JACKSON, MS) : $210,563 in 9 contractsfrom 2001 to 2004
Contracts for Guard Services, Maintenance, Repair or Alteration of Real Property -- Office Buildings by U.S. Army Corps of Engineers - civil program financing only, Army, Public Buildings Service Signed by year:2000: $0; 2001: $43,008; 2002: $2,000; 2003: $69,433; 2004: $96,122; 2005: $0; 2006: $0.
Biggest contracts:
$46,736 with U.S. Army Corps of Engineers - civil program financing only for Guard Services. Taking place in GA. Signed on 2004-02-20. Completion date: 2004-03-19.
$46,736 with Army for Guard Services. Taking place in GA. Signed on 2004-02-20. Completion date: 2004-03-19.
$43,056 with U.S. Army Corps of Engineers - civil program financing only for Guard Services. Signed on 2003-04-02. Completion date: 2002-09-30.
$43,008 with U.S. Army Corps of Engineers - civil program financing only for Guard Services. Taking place in GA. Signed on 2001-12-06. Completion date: 2002-09-30.
MISSISSIPPI FILING SYSTEMS INC (600 W CAPITOL ST in JACKSON, MS; small business) : $172,907 in 28 contractsfrom 2001 to 2006
Contracts for Material Handling Equipment, Nonself-Propelled, ADP Components, Cabinets, Lockers, Bins, and Shelving, Office Furniture, and moreby Army, U.S. Army Corps of Engineers - civil program financing only Signed by year:2000: $0; 2001: $9,035; 2002: $8,830; 2003: $59,682; 2004: $28,655; 2005: $23,866; 2006: $42,839.
Biggest contracts:
$20,079 with Army for Material Handling Equipment, Nonself-Propelled. Taking place in PA. Signed on 2006-05-11. Completion date: 2006-05-15.
$19,800 with Army for ADP Components. Signed on 2006-05-10. Completion date: 2006-05-12.
$8,340 with Army for Cabinets, Lockers, Bins, and Shelving. Signed on 2003-06-12. Completion date: 2003-08-12.
$8,000 with Army for ADP Components. Signed on 2003-06-25. Completion date: 2003-07-25.
Top industries in this zip code by the number of employees in 2005:
Wholesale Trade: Beer and Ale Merchant Wholesalers (100-249 employees: 1 establishment)
Health Care and Social Assistance: Child Day Care Services (50-99: 1, 20-49: 1, 5-9: 3, 1-4: 2)
Other Services (except Public Administration): Religious Organizations (20-49: 2, 10-19: 2, 1-4: 5)
Health Care and Social Assistance: Other Individual and Family Services (50-99: 1, 10-19: 1)
Administrative and Support and Waste Management and Remediation Services: Janitorial Services (50-99: 1, 5-9: 1, 1-4: 1)
Wholesale Trade: Printing and Writing Paper Merchant Wholesalers (50-99: 1)
Health Care and Social Assistance: Temporary Shelters (20-49: 1)
Health Care and Social Assistance: Community Food Services (20-49: 1)
People in group quarters in 2010:
968 people in college/university student housing
121 people in other noninstitutional facilities
75 people in group homes intended for adults
66 people in correctional residential facilities
65 people in emergency and transitional shelters (with sleeping facilities) for people experiencing homelessness
21 people in workers' group living quarters and job corps centers
15 people in nursing facilities/skilled-nursing facilities
10 people in residential treatment centers for adults
People in group quarters in 2000:
1,459 people in college dormitories (includes college quarters off campus)
181 people in other noninstitutional group quarters
58 people in homes for the mentally ill
48 people in halfway houses
33 people in hospitals or wards for drug/alcohol abuse
31 people in nursing homes
22 people in other group homes
11 people in other nonhousehold living situations
Fatal accident statistics in 2014:
Fatal accident count: 1
Vehicles involved in fatal accidents: 1
Fatal accidents caused by drunken drivers: 0
Fatalities: 1
Persons involved in fatal accidents: 1
Pedestrians involved in fatal accidents: 1
Fatal accident statistics in 2013:
Fatal accident count: 1
Vehicles involved in fatal accidents: 2
Fatal accidents caused by drunken drivers: 0
Fatalities: 1
Persons involved in fatal accidents: 2
Pedestrians involved in fatal accidents: 0
Home Mortgage Disclosure Act Aggregated Statistics For Year 2009 (Based on 18 partial tracts)
A) FHA, FSA/RHS & VA Home Purchase Loans
B) Conventional Home Purchase Loans
C) Refinancings
D) Home Improvement Loans
E) Loans on Dwellings For 5+ Families
F) Non-occupant Loans on < 5 Family Dwellings (A B C & D)
Number
Average Value
Number
Average Value
Number
Average Value
Number
Average Value
Number
Average Value
Number
Average Value
LOANS ORIGINATED
4
$129,637
11
$72,062
24
$41,914
10
$6,097
0
$0
23
$33,492
APPLICATIONS APPROVED, NOT ACCEPTED
1
$33,700
1
$89,970
0
$0
0
$0
0
$0
0
$0
APPLICATIONS DENIED
1
$51,610
2
$32,935
22
$57,189
18
$23,888
2
$375,550
8
$40,802
APPLICATIONS WITHDRAWN
3
$142,567
3
$25,900
9
$39,906
2
$14,690
0
$0
3
$25,900
FILES CLOSED FOR INCOMPLETENESS
0
$0
0
$0
2
$56,525
1
$4,380
0
$0
1
$36,810
Aggregated Statistics For Year 2008 (Based on 18 partial tracts)
A) FHA, FSA/RHS & VA Home Purchase Loans
B) Conventional Home Purchase Loans
C) Refinancings
D) Home Improvement Loans
F) Non-occupant Loans on < 5 Family Dwellings (A B C & D)
G) Loans On Manufactured Home Dwelling (A B C & D)
Number
Average Value
Number
Average Value
Number
Average Value
Number
Average Value
Number
Average Value
Number
Average Value
LOANS ORIGINATED
1
$60,560
14
$39,606
30
$44,574
5
$8,600
22
$34,340
0
$0
APPLICATIONS APPROVED, NOT ACCEPTED
0
$0
1
$43,240
5
$42,582
2
$37,555
3
$40,867
1
$33,300
APPLICATIONS DENIED
0
$0
11
$85,401
25
$49,410
31
$30,211
17
$66,444
0
$0
APPLICATIONS WITHDRAWN
2
$114,165
7
$67,110
7
$53,559
4
$47,805
8
$58,929
0
$0
FILES CLOSED FOR INCOMPLETENESS
0
$0
1
$14,220
4
$49,450
2
$10,405
1
$34,080
0
$0
Aggregated Statistics For Year 2007 (Based on 18 partial tracts)
A) FHA, FSA/RHS & VA Home Purchase Loans
B) Conventional Home Purchase Loans
C) Refinancings
D) Home Improvement Loans
E) Loans on Dwellings For 5+ Families
F) Non-occupant Loans on < 5 Family Dwellings (A B C & D)
G) Loans On Manufactured Home Dwelling (A B C & D)
Number
Average Value
Number
Average Value
Number
Average Value
Number
Average Value
Number
Average Value
Number
Average Value
Number
Average Value
LOANS ORIGINATED
8
$61,869
22
$57,224
46
$40,734
24
$16,095
1
$763,830
40
$37,761
1
$17,900
APPLICATIONS APPROVED, NOT ACCEPTED
0
$0
8
$51,184
10
$52,707
0
$0
0
$0
9
$54,728
0
$0
APPLICATIONS DENIED
1
$36,340
42
$63,885
55
$61,785
33
$27,689
3
$429,863
36
$48,079
0
$0
APPLICATIONS WITHDRAWN
2
$11,265
4
$47,082
9
$36,624
3
$62,890
0
$0
5
$34,658
0
$0
FILES CLOSED FOR INCOMPLETENESS
0
$0
4
$48,285
6
$92,060
0
$0
0
$0
2
$76,545
0
$0
Aggregated Statistics For Year 2006 (Based on 18 partial tracts)
A) FHA, FSA/RHS & VA Home Purchase Loans
B) Conventional Home Purchase Loans
C) Refinancings
D) Home Improvement Loans
E) Loans on Dwellings For 5+ Families
F) Non-occupant Loans on < 5 Family Dwellings (A B C & D)
G) Loans On Manufactured Home Dwelling (A B C & D)
Number
Average Value
Number
Average Value
Number
Average Value
Number
Average Value
Number
Average Value
Number
Average Value
Number
Average Value
LOANS ORIGINATED
4
$129,850
56
$51,244
65
$47,334
26
$20,568
2
$45,960
83
$47,056
1
$35,810
APPLICATIONS APPROVED, NOT ACCEPTED
0
$0
20
$50,856
14
$54,568
0
$0
0
$0
15
$53,852
2
$9,325
APPLICATIONS DENIED
0
$0
51
$57,815
74
$56,268
29
$27,630
0
$0
41
$45,646
7
$25,856
APPLICATIONS WITHDRAWN
4
$58,480
14
$57,164
13
$54,148
3
$32,823
0
$0
12
$43,981
0
$0
FILES CLOSED FOR INCOMPLETENESS
0
$0
7
$53,373
6
$65,902
0
$0
0
$0
3
$49,077
0
$0
Aggregated Statistics For Year 2005 (Based on 18 partial tracts)
A) FHA, FSA/RHS & VA Home Purchase Loans
B) Conventional Home Purchase Loans
C) Refinancings
D) Home Improvement Loans
E) Loans on Dwellings For 5+ Families
F) Non-occupant Loans on < 5 Family Dwellings (A B C & D)
G) Loans On Manufactured Home Dwelling (A B C & D)
Number
Average Value
Number
Average Value
Number
Average Value
Number
Average Value
Number
Average Value
Number
Average Value
Number
Average Value
LOANS ORIGINATED
5
$53,550
88
$44,528
69
$46,632
26
$29,041
3
$408,127
95
$46,020
0
$0
APPLICATIONS APPROVED, NOT ACCEPTED
0
$0
20
$62,993
27
$49,421
2
$36,200
0
$0
17
$51,806
3
$55,740
APPLICATIONS DENIED
2
$65,830
76
$49,245
92
$52,517
20
$21,381
0
$0
69
$49,927
2
$53,455
APPLICATIONS WITHDRAWN
0
$0
56
$82,900
21
$61,540
12
$55,740
0
$0
19
$50,993
0
$0
FILES CLOSED FOR INCOMPLETENESS
0
$0
4
$85,445
4
$63,470
0
$0
0
$0
0
$0
0
$0
Aggregated Statistics For Year 2004 (Based on 18 partial tracts)
A) FHA, FSA/RHS & VA Home Purchase Loans
B) Conventional Home Purchase Loans
C) Refinancings
D) Home Improvement Loans
F) Non-occupant Loans on < 5 Family Dwellings (A B C & D)
G) Loans On Manufactured Home Dwelling (A B C & D)
Number
Average Value
Number
Average Value
Number
Average Value
Number
Average Value
Number
Average Value
Number
Average Value
LOANS ORIGINATED
6
$62,143
52
$43,511
76
$42,767
27
$18,246
93
$39,656
2
$12,330
APPLICATIONS APPROVED, NOT ACCEPTED
0
$0
23
$64,605
32
$43,958
0
$0
20
$44,642
0
$0
APPLICATIONS DENIED
2
$84,870
36
$66,575
97
$42,691
32
$21,363
44
$39,342
1
$41,780
APPLICATIONS WITHDRAWN
0
$0
15
$55,832
14
$53,908
1
$23,170
11
$41,725
0
$0
FILES CLOSED FOR INCOMPLETENESS
1
$159,490
4
$57,100
10
$71,807
1
$26,330
0
$0
0
$0
Aggregated Statistics For Year 2003 (Based on 18 partial tracts)
A) FHA, FSA/RHS & VA Home Purchase Loans
B) Conventional Home Purchase Loans
C) Refinancings
D) Home Improvement Loans
E) Loans on Dwellings For 5+ Families
F) Non-occupant Loans on < 5 Family Dwellings (A B C & D)
Number
Average Value
Number
Average Value
Number
Average Value
Number
Average Value
Number
Average Value
Number
Average Value
LOANS ORIGINATED
5
$45,794
35
$40,020
74
$41,792
18
$12,326
1
$222,750
61
$32,067
APPLICATIONS APPROVED, NOT ACCEPTED
2
$61,330
14
$72,486
30
$44,899
4
$6,012
0
$0
4
$49,902
APPLICATIONS DENIED
5
$85,490
31
$47,453
107
$41,192
27
$16,153
0
$0
37
$33,400
APPLICATIONS WITHDRAWN
0
$0
5
$46,766
21
$54,611
0
$0
0
$0
7
$37,264
FILES CLOSED FOR INCOMPLETENESS
0
$0
1
$70,890
11
$49,143
0
$0
0
$0
1
$65,430
Aggregated Statistics For Year 2002 (Based on 18 partial tracts)
A) FHA, FSA/RHS & VA Home Purchase Loans
B) Conventional Home Purchase Loans
C) Refinancings
D) Home Improvement Loans
E) Loans on Dwellings For 5+ Families
F) Non-occupant Loans on < 5 Family Dwellings (A B C & D)
Number
Average Value
Number
Average Value
Number
Average Value
Number
Average Value
Number
Average Value
Number
Average Value
LOANS ORIGINATED
5
$60,994
37
$37,290
56
$41,090
19
$10,283
2
$334,480
51
$30,426
APPLICATIONS APPROVED, NOT ACCEPTED
0
$0
2
$23,420
19
$38,370
4
$4,230
0
$0
3
$11,490
APPLICATIONS DENIED
1
$40,310
40
$41,485
98
$36,365
32
$11,621
0
$0
26
$29,512
APPLICATIONS WITHDRAWN
2
$15,775
5
$45,406
37
$44,906
0
$0
0
$0
8
$40,240
FILES CLOSED FOR INCOMPLETENESS
0
$0
4
$34,948
18
$70,914
2
$41,795
0
$0
4
$38,042
Aggregated Statistics For Year 2001 (Based on 18 partial tracts)
A) FHA, FSA/RHS & VA Home Purchase Loans
B) Conventional Home Purchase Loans
C) Refinancings
D) Home Improvement Loans
F) Non-occupant Loans on < 5 Family Dwellings (A B C & D)
Number
Average Value
Number
Average Value
Number
Average Value
Number
Average Value
Number
Average Value
LOANS ORIGINATED
6
$43,950
35
$53,621
70
$39,005
23
$13,177
47
$35,520
APPLICATIONS APPROVED, NOT ACCEPTED
2
$17,275
8
$49,324
30
$46,636
3
$3,850
6
$40,257
APPLICATIONS DENIED
2
$33,985
28
$33,224
142
$39,751
44
$15,454
17
$33,429
APPLICATIONS WITHDRAWN
0
$0
10
$37,820
53
$41,248
3
$14,307
3
$29,250
FILES CLOSED FOR INCOMPLETENESS
0
$0
2
$28,540
9
$36,939
3
$18,833
1
$16,850
Aggregated Statistics For Year 2000 (Based on 18 partial tracts)
A) FHA, FSA/RHS & VA Home Purchase Loans
B) Conventional Home Purchase Loans
C) Refinancings
D) Home Improvement Loans
F) Non-occupant Loans on < 5 Family Dwellings (A B C & D)
Number
Average Value
Number
Average Value
Number
Average Value
Number
Average Value
Number
Average Value
LOANS ORIGINATED
6
$46,667
41
$34,013
83
$34,203
51
$15,853
49
$28,864
APPLICATIONS APPROVED, NOT ACCEPTED
0
$0
5
$37,458
24
$27,485
13
$18,910
10
$24,411
APPLICATIONS DENIED
2
$21,780
33
$38,576
128
$34,868
43
$12,820
24
$37,342
APPLICATIONS WITHDRAWN
3
$25,037
11
$46,604
99
$31,636
9
$21,493
12
$29,304
FILES CLOSED FOR INCOMPLETENESS
0
$0
6
$61,063
20
$43,987
0
$0
4
$52,998
Aggregated Statistics For Year 1999 (Based on 10 partial tracts)
A) FHA, FSA/RHS & VA Home Purchase Loans
B) Conventional Home Purchase Loans
C) Refinancings
D) Home Improvement Loans
E) Loans on Dwellings For 5+ Families
F) Non-occupant Loans on < 5 Family Dwellings (A B C & D)
2005 - 2018 National Fire Incident Reporting System (NFIRS) incidents
According to the data from the years 2005 - 2018 the average number of fire incidents per year is 44. The highest number of reported fires - 106 took place in 2007, and the least - 0 in 2014. The data has a dropping trend.
When looking into fire subcategories, the most reports belonged to: Structure Fires (55.2%), and Outside Fires (26.5%).
Fire incident types reported to NFIRS in Zip Code 39203

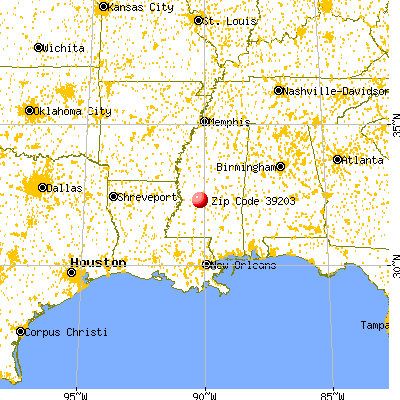


 Nearest zip codes: 39269, 39217, 39201, 39202, 39204, 39216.


 According to the data from the years 2005 - 2018 the average number of fire incidents per year is 44. The highest number of reported fires - 106 took place in 2007, and the least - 0 in 2014. The data has a dropping trend.
 When looking into fire subcategories, the most reports belonged to: Structure Fires (55.2%), and Outside Fires (26.5%).