Races in Fox Lake, Illinois (IL) Detailed Stats
Data:
Races - White alone (%)
Races - White alone (% change since 2000)
Races - Black alone (%)
Races - Black alone (% change since 2000)
Races - American Indian alone (%)
Races - American Indian alone (% change since 2000)
Races - Asian alone (%)
Races - Asian alone (% change since 2000)
Races - Hispanic (%)
Races - Hispanic (% change since 2000)
Races - Native Hawaiian and Other Pacific Islander alone (%)
Races - Native Hawaiian and Other Pacific Islander alone (% change since 2000)
Races - Two or more races(%)
Races - Two or more races(% change since 2000)
Races - Other race alone (%)
Races - Other race alone (% change since 2000)
Racial diversity
Place of birth - Born in state of residence (%)
Place of birth - Born in state of residence (%) - White
Place of birth - Born in state of residence (%) - Black or African American
Place of birth - Born in state of residence (%) - Asian
Place of birth - Born in state of residence (%) - Hispanic or Latino
Place of birth - Born in state of residence (%) - American Indian and Alaska Native
Place of birth - Born in state of residence (%) - Multirace
Place of birth - Born in state of residence (%) - Other Race
Place of birth - Born in other state (%)
Place of birth - Born in other state (%) - White
Place of birth - Born in other state (%) - Black or African American
Place of birth - Born in other state (%) - Asian
Place of birth - Born in other state (%) - Hispanic or Latino
Place of birth - Born in other state (%) - American Indian and Alaska Native
Place of birth - Born in other state (%) - Multirace
Place of birth - Born in other state (%) - Other Race
Place of birth - Native, outside of US (%)
Place of birth - Native, outside of US (%) - White
Place of birth - Native, outside of US (%) - Black or African American
Place of birth - Native, outside of US (%) - Asian
Place of birth - Native, outside of US (%) - Hispanic or Latino
Place of birth - Native, outside of US (%) - American Indian and Alaska Native
Place of birth - Native, outside of US (%) - Multirace
Place of birth - Native, outside of US (%) - Other Race
Place of birth - Foreign born (%)
Place of birth - Foreign born (%) - White
Place of birth - Foreign born (%) - Black or African American
Place of birth - Foreign born (%) - Asian
Place of birth - Foreign born (%) - Hispanic or Latino
Place of birth - Foreign born (%) - American Indian and Alaska Native
Place of birth - Foreign born (%) - Multirace
Place of birth - Foreign born (%) - Other Race
Residents speaking English at home (%)
Residents speaking English at home - Born in the United States (%)
Residents speaking English at home - Native, born elsewhere (%)
Residents speaking English at home - Foreign born (%)
Residents speaking Spanish at home (%)
Residents speaking Spanish at home - Born in the United States (%)
Residents speaking Spanish at home - Native, born elsewhere (%)
Residents speaking Spanish at home - Foreign born (%)
Residents speaking other language at home (%)
Residents speaking other language at home - Born in the United States (%)
Residents speaking other language at home - Native, born elsewhere (%)
Residents speaking other language at home - Foreign born (%)
Marital status - Never married (%)
Marital status - Now married (%)
Marital status - Separated (%)
Marital status - Widowed (%)
Marital status - Divorced (%)
Ancestries Reported - Arab (%)
Ancestries Reported - Czech (%)
Ancestries Reported - Danish (%)
Ancestries Reported - Dutch (%)
Ancestries Reported - English (%)
Ancestries Reported - French (%)
Ancestries Reported - French Canadian (%)
Ancestries Reported - German (%)
Ancestries Reported - Greek (%)
Ancestries Reported - Hungarian (%)
Ancestries Reported - Irish (%)
Ancestries Reported - Italian (%)
Ancestries Reported - Lithuanian (%)
Ancestries Reported - Norwegian (%)
Ancestries Reported - Polish (%)
Ancestries Reported - Portuguese (%)
Ancestries Reported - Russian (%)
Ancestries Reported - Scotch-Irish (%)
Ancestries Reported - Scottish (%)
Ancestries Reported - Slovak (%)
Ancestries Reported - Subsaharan African (%)
Ancestries Reported - Swedish (%)
Ancestries Reported - Swiss (%)
Ancestries Reported - Ukrainian (%)
Ancestries Reported - United States (%)
Ancestries Reported - Welsh (%)
Ancestries Reported - West Indian (%)
Ancestries Reported - Other (%)
Geographical mobility - Same house 1 year ago (%)
Geographical mobility - Same house 1 year ago (%) - White
Geographical mobility - Same house 1 year ago (%) - Black or African American
Geographical mobility - Same house 1 year ago (%) - Asian
Geographical mobility - Same house 1 year ago (%) - Hispanic or Latino
Geographical mobility - Same house 1 year ago (%) - American Indian and Alaska Native
Geographical mobility - Same house 1 year ago (%) - Multirace
Geographical mobility - Same house 1 year ago (%) - Other Race
Geographical mobility - Moved within same county (%)
Geographical mobility - Moved within same county (%) - White
Geographical mobility - Moved within same county (%) - Black or African American
Geographical mobility - Moved within same county (%) - Asian
Geographical mobility - Moved within same county (%) - Hispanic or Latino
Geographical mobility - Moved within same county (%) - American Indian and Alaska Native
Geographical mobility - Moved within same county (%) - Multirace
Geographical mobility - Moved within same county (%) - Other Race
Geographical mobility - Moved from different county within same state (%)
Geographical mobility - Moved from different county within same state (%) - White
Geographical mobility - Moved from different county within same state (%) - Black or African American
Geographical mobility - Moved from different county within same state (%) - Asian
Geographical mobility - Moved from different county within same state (%) - Hispanic or Latino
Geographical mobility - Moved from different county within same state (%) - American Indian and Alaska Native
Geographical mobility - Moved from different county within same state (%) - Multirace
Geographical mobility - Moved from different county within same state (%) - Other Race
Geographical mobility - Moved from different state (%)
Geographical mobility - Moved from different state (%) - White
Geographical mobility - Moved from different state (%) - Black or African American
Geographical mobility - Moved from different state (%) - Asian
Geographical mobility - Moved from different state (%) - Hispanic or Latino
Geographical mobility - Moved from different state (%) - American Indian and Alaska Native
Geographical mobility - Moved from different state (%) - Multirace
Geographical mobility - Moved from different state (%) - Other Race
Geographical mobility - Moved from abroad (%)
Geographical mobility - Moved from abroad (%) - White
Geographical mobility - Moved from abroad (%) - Black or African American
Geographical mobility - Moved from abroad (%) - Asian
Geographical mobility - Moved from abroad (%) - Hispanic or Latino
Geographical mobility - Moved from abroad (%) - American Indian and Alaska Native
Geographical mobility - Moved from abroad (%) - Multirace
Geographical mobility - Moved from abroad (%) - Other Race
Place of birth for the foreign-born population - Ireland (%)
Place of birth for the foreign-born population - Denmark (%)
Place of birth for the foreign-born population - Norway (%)
Place of birth for the foreign-born population - Sweden (%)
Place of birth for the foreign-born population - United Kingdom (%)
Place of birth for the foreign-born population - England (%)
Place of birth for the foreign-born population - Scotland (%)
Place of birth for the foreign-born population - Other Northern Europe (%)
Place of birth for the foreign-born population - Austria (%)
Place of birth for the foreign-born population - Belgium (%)
Place of birth for the foreign-born population - France (%)
Place of birth for the foreign-born population - Germany (%)
Place of birth for the foreign-born population - Netherlands (%)
Place of birth for the foreign-born population - Switzerland (%)
Place of birth for the foreign-born population - Other Western Europe (%)
Place of birth for the foreign-born population - Greece (%)
Place of birth for the foreign-born population - Italy (%)
Place of birth for the foreign-born population - Portugal (%)
Place of birth for the foreign-born population - Spain (%)
Place of birth for the foreign-born population - Other Southern Europe (%)
Place of birth for the foreign-born population - Albania (%)
Place of birth for the foreign-born population - Belarus (%)
Place of birth for the foreign-born population - Bosnia and Herzegovina (%)
Place of birth for the foreign-born population - Bulgaria (%)
Place of birth for the foreign-born population - Croatia (%)
Place of birth for the foreign-born population - Czechoslovakia (%)
Place of birth for the foreign-born population - Hungary (%)
Place of birth for the foreign-born population - Latvia (%)
Place of birth for the foreign-born population - Lithuania (%)
Place of birth for the foreign-born population - North Macedonia (Macedonia) (%)
Place of birth for the foreign-born population - Moldova (%)
Place of birth for the foreign-born population - Poland (%)
Place of birth for the foreign-born population - Romania (%)
Place of birth for the foreign-born population - Russia (%)
Place of birth for the foreign-born population - Serbia (%)
Place of birth for the foreign-born population - Ukraine (%)
Place of birth for the foreign-born population - Other Eastern Europe (%)
Place of birth for the foreign-born population - China (%)
Place of birth for the foreign-born population - Hong Kong (%)
Place of birth for the foreign-born population - Taiwan (%)
Place of birth for the foreign-born population - Japan (%)
Place of birth for the foreign-born population - Korea (%)
Place of birth for the foreign-born population - Other Eastern Asia (%)
Place of birth for the foreign-born population - Afghanistan (%)
Place of birth for the foreign-born population - Bangladesh (%)
Place of birth for the foreign-born population - India (%)
Place of birth for the foreign-born population - Iran (%)
Place of birth for the foreign-born population - Kazakhstan (%)
Place of birth for the foreign-born population - Nepal (%)
Place of birth for the foreign-born population - Pakistan (%)
Place of birth for the foreign-born population - Sri Lanka (%)
Place of birth for the foreign-born population - Uzbekistan (%)
Place of birth for the foreign-born population - Other South Central Asia (%)
Place of birth for the foreign-born population - Burma (%)
Place of birth for the foreign-born population - Cambodia (%)
Place of birth for the foreign-born population - Indonesia (%)
Place of birth for the foreign-born population - Laos (%)
Place of birth for the foreign-born population - Malaysia (%)
Place of birth for the foreign-born population - Philippines (%)
Place of birth for the foreign-born population - Singapore (%)
Place of birth for the foreign-born population - Thailand (%)
Place of birth for the foreign-born population - Vietnam (%)
Place of birth for the foreign-born population - Other South Eastern Asia (%)
Place of birth for the foreign-born population - Armenia (%)
Place of birth for the foreign-born population - Iraq (%)
Place of birth for the foreign-born population - Israel (%)
Place of birth for the foreign-born population - Jordan (%)
Place of birth for the foreign-born population - Kuwait (%)
Place of birth for the foreign-born population - Lebanon (%)
Place of birth for the foreign-born population - Saudi Arabia (%)
Place of birth for the foreign-born population - Syria (%)
Place of birth for the foreign-born population - Turkey (%)
Place of birth for the foreign-born population - Yemen (%)
Place of birth for the foreign-born population - Other Western Asia (%)
Place of birth for the foreign-born population - Eritrea (%)
Place of birth for the foreign-born population - Ethiopia (%)
Place of birth for the foreign-born population - Kenya (%)
Place of birth for the foreign-born population - Somalia (%)
Place of birth for the foreign-born population - Uganda (%)
Place of birth for the foreign-born population - Zimbabwe (%)
Place of birth for the foreign-born population - Other Eastern Africa (%)
Place of birth for the foreign-born population - Cameroon (%)
Place of birth for the foreign-born population - Congo (%)
Place of birth for the foreign-born population - Democratic Republic of Congo (Zaire) (%)
Place of birth for the foreign-born population - Other Middle Africa (%)
Place of birth for the foreign-born population - Egypt (%)
Place of birth for the foreign-born population - Morocco (%)
Place of birth for the foreign-born population - Sudan (%)
Place of birth for the foreign-born population - Other Northern Africa (%)
Place of birth for the foreign-born population - South Africa (%)
Place of birth for the foreign-born population - Other Southern Africa (%)
Place of birth for the foreign-born population - Cabo Verde (%)
Place of birth for the foreign-born population - Ghana (%)
Place of birth for the foreign-born population - Liberia (%)
Place of birth for the foreign-born population - Nigeria (%)
Place of birth for the foreign-born population - Senegal (%)
Place of birth for the foreign-born population - Sierra Leone (%)
Place of birth for the foreign-born population - Other Western Africa (%)
Place of birth for the foreign-born population - Australia (%)
Place of birth for the foreign-born population - New Zealand (%)
Place of birth for the foreign-born population - Fiji (%)
Place of birth for the foreign-born population - Micronesia (%)
Place of birth for the foreign-born population - Bahamas (%)
Place of birth for the foreign-born population - Barbados (%)
Place of birth for the foreign-born population - Cuba (%)
Place of birth for the foreign-born population - Dominica (%)
Place of birth for the foreign-born population - Dominican Republic (%)
Place of birth for the foreign-born population - Grenada (%)
Place of birth for the foreign-born population - Haiti (%)
Place of birth for the foreign-born population - Jamaica (%)
Place of birth for the foreign-born population - St. Vincent and the Grenadines (%)
Place of birth for the foreign-born population - Trinidad and Tobago (%)
Place of birth for the foreign-born population - West Indies (%)
Place of birth for the foreign-born population - Other Caribbean (%)
Place of birth for the foreign-born population - Belize (%)
Place of birth for the foreign-born population - Costa Rica (%)
Place of birth for the foreign-born population - El Salvador (%)
Place of birth for the foreign-born population - Guatemala (%)
Place of birth for the foreign-born population - Honduras (%)
Place of birth for the foreign-born population - Mexico (%)
Place of birth for the foreign-born population - Nicaragua (%)
Place of birth for the foreign-born population - Panama (%)
Place of birth for the foreign-born population - Other Central America (%)
Place of birth for the foreign-born population - Argentina (%)
Place of birth for the foreign-born population - Bolivia (%)
Place of birth for the foreign-born population - Brazil (%)
Place of birth for the foreign-born population - Chile (%)
Place of birth for the foreign-born population - Colombia (%)
Place of birth for the foreign-born population - Ecuador (%)
Place of birth for the foreign-born population - Guyana (%)
Place of birth for the foreign-born population - Peru (%)
Place of birth for the foreign-born population - Uruguay (%)
Place of birth for the foreign-born population - Venezuela (%)
Place of birth for the foreign-born population - Other South America (%)
Place of birth for the foreign-born population - Canada (%)
Place of birth for the foreign-born population - Other Northern America (%)
Place of birth for the foreign-born population - Other (%)
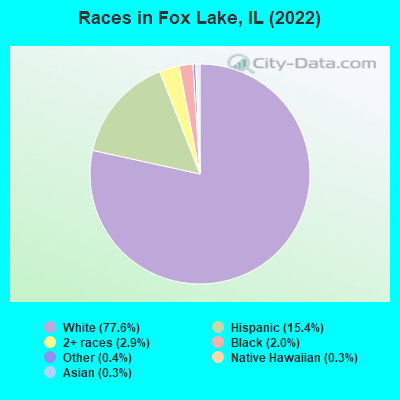
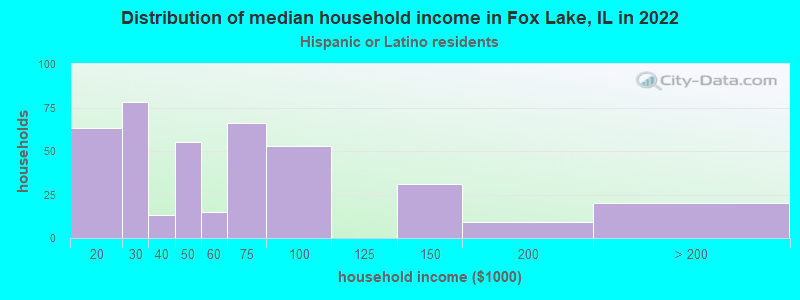
According to 2022 data, the most numerous races in Fox Lake, IL are White alone (8,336 residents), Hispanic (1,653 residents), and Black alone (216 residents). 84.7% of Fox Lake residents speak English at home. 7.3% of Fox Lake, IL residents are foreign-born (3.2% born in Latin America, 3.2% born in Europe), which is 92.5% less than the foreign-born rate of 14.0% across the entire state of Illinois.
Race distribution in Fox Lake
2000 2022
8,424,140 67.8% White alone 1,856,152 14.9% Black alone 1,530,262 12.3% Hispanic 419,916 3.4% Asian alone 153,996 1.2% Two or more races 13,479 0.1% Other race alone 18,232 0.1% American Indian alone 3,116 0.03% Native Hawaiian and Other
7,356,301 58.5% White alone 2,299,726 18.3% Hispanic 1,660,423 13.2% Black alone 747,296 5.9% Asian alone 458,599 3.6% Two or more races 45,386 0.4% Other race alone 10,405 0.08% American Indian alone 3,896 0.03% Native Hawaiian and Other
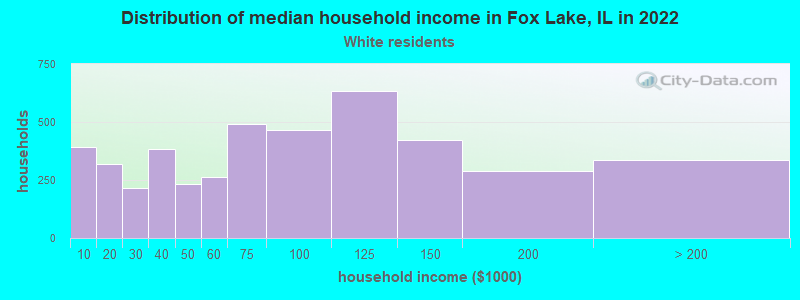
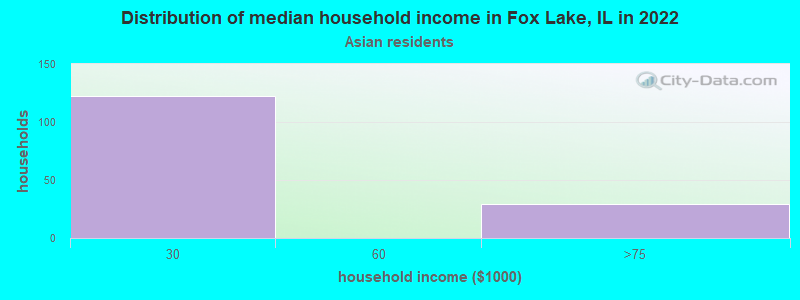
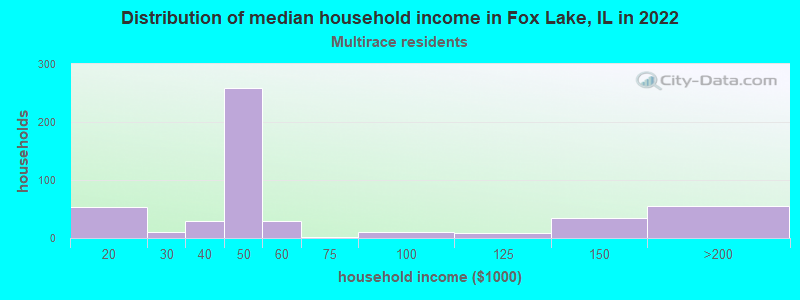
Income and house value in Fox Lake Median household income in 2022 $68,332 White non-Hispanic householders$43,306 Two or more races householders$46,763 Hispanic or Latino race householdersMedian 2022 house value $234,358 White Non-Hispanic householders$320,277 Black or African American householders $270,400 Asian householders$234,870 Native Hawaiian and other Pacific Islander householders$152,708 Some other race householders$152,708 Two or more races householders$149,463 Hispanic or Latino householders
Median age by race in Fox Lake
54.6 Median age for White residents53.7 55.8 18.7 Median age for Black or African American residents-679,528,402.3 19.4 -657,243,815.6 Median age for American Indian / Alaska Native residents-671,532,846.0 -638,251,365.5 20.0 Median age for Asian residents-680,776,013.4 -678,663,238.4 -593,236,714.4 Median age for Native Hawaiian / Pacific Islander residents-658,536,584.7 -576,015,108.0 32.0 Median age for Other race residents31.3 45.5 26.5 Median age for Two or more races residents31.8 17.8 54.3 Median age for White alone residents52.7 57.0 24.9 Median age for Hispanic or Latino residents25.4 23.4
Owner/renter occupied households by race in Fox Lake
House owners and renters - White residents 3,254 72.7% Owner occupied1,223 27.3% Renter occupiedHouse owners and renters - Black or African American residents 15 14.1% Owner occupied94 85.9% Renter occupiedHouse owners and renters - American Indian / Alaska Native residents 28 100.0% Owner occupiedHouse owners and renters - Asian residents 23 27.3% Owner occupied61 72.7% Renter occupiedHouse owners and renters - Other race residents 15 100.0% Renter occupiedHouse owners and renters - Two or more races residents 260 55.9% Owner occupied205 44.1% Renter occupiedHouse owners and renters - White alone residents 3,272 72.5% Owner occupied1,238 27.5% Renter occupiedHouse owners and renters - Hispanic or Latino residents 157 37.7% Owner occupied260 62.3% Renter occupied
Language usage in Fox Lake
English speakers - Total 84.7% of residents of Fox Lake speak English at home.
8.2% of residents speak Spanish at home 508 60.5% Speak English very well331 39.5% Speak English less than very well6.5% of residents speak other language at home 558 83.8% Speak English very well108 16.2% Speak English less than very well
English speakers - Born in the United States 93.2% of residents of Fox Lake speak English at home.
5.1% of residents speak Spanish at home 46 52.3% Speak English very well42 47.7% Speak English less than very well1.4% of residents speak other language at home 24 100.0% Speak English very well
English speakers - Native, born elsewhere 50.0% of residents of Fox Lake speak English at home.
29.7% of residents speak Spanish at home 19 100.0% Speak English very well21.9% of residents speak other language at home 14 100.0% Speak English very well
English speakers - Foreign-born 21.8% of residents of Fox Lake speak English at home.
39.0% of residents speak Spanish at home 81 25.5% Speak English very well237 74.5% Speak English less than very well39.6% of residents speak other language at home 226 70.0% Speak English very well97 30.0% Speak English less than very well
White (Caucasian) - Speak only English Native:
96.9% (7,384)Foreign-born:
38.3% (110)
White (Caucasian) - Speak another language Native:
4.2% (319)Foreign-born:
65.4% (189)
Black or African American - Speak only English Native:
99.6% (178)Foreign-born:
70.2% (44)
American Indian / Alaska Native - Speak another language Native:
97.7% (35)Foreign-born:
100.0% (31)
Asian - Speak only English Native:
75.7% (70)Foreign-born:
89.8% (10)
Other race - Speak another language Native:
23.3% (54)Foreign-born:
94.8% (37)
Two or more races - Speak another language Native:
39.8% (412)Foreign-born:
100.0% (490)
White alone - Speak only English Native:
95.1% (7,256)Foreign-born:
30.2% (113)
White alone - Speak another language Native:
4.8% (363)Foreign-born:
69.9% (262)
Hispanic or Latino - Speak another language Native:
36.6% (428)Foreign-born:
97.3% (314)
Foreign-born residents in Fox Lake 781 residents are foreign born (3.2% Latin America , 3.2% Europe ).
This city:
7.3%Illinois:
14.1%
Marital status for residents in Fox Lake Marital status - White (Caucasian) population 15 years and over
Males 25.9% Never married52.8% Now married0.7% Separated3.3% Widowed17.2% DivorcedFemales 22.8% Never married42.0% Now married1.5% Separated14.3% Widowed19.5% DivorcedWomen who gave birth in the past 12 months Now married:
59.7% (79)Unmarried:
40.3% (53)
Women who did not give birth in the past 12 months Now married:
37.3% (498)Unmarried:
62.7% (836)
Marital status - Black or African American population 15 years and over
Males 0.0% Never married0.0% Now married0.0% Separated0.0% Widowed100.0% DivorcedFemales 85.9% Never married8.6% Now married0.0% Separated5.4% Widowed0.0% DivorcedWomen who did not give birth in the past 12 months Now married:
9.6% (15)Unmarried:
90.4% (137)
Marital status - American Indian / Alaska Native population 15 years and over
Males 100.0% Never married0.0% Now married0.0% Separated0.0% Widowed0.0% DivorcedFemales 0.0% Never married0.0% Now married0.0% Separated0.0% Widowed100.0% DivorcedMarital status - Asian population 15 years and over
Males 78.0% Never married22.0% Now married0.0% Separated0.0% Widowed0.0% DivorcedFemales 0.0% Never married100.0% Now married0.0% Separated0.0% Widowed0.0% DivorcedWomen who did not give birth in the past 12 months Now married:
100.0% (11)Unmarried:
0.0% (0)
Marital status - Other race population 15 years and over
Males 49.5% Never married50.5% Now married0.0% Separated0.0% Widowed0.0% DivorcedFemales 30.6% Never married58.5% Now married0.0% Separated0.0% Widowed10.9% DivorcedWomen who did not give birth in the past 12 months Now married:
60.5% (70)Unmarried:
39.5% (45)
Marital status - Two or more races population 15 years and over
Males 33.1% Never married24.4% Now married15.4% Separated0.8% Widowed26.3% DivorcedFemales 53.2% Never married38.6% Now married0.0% Separated0.0% Widowed8.2% DivorcedWomen who gave birth in the past 12 months Now married:
100.0% (89)Unmarried:
0.0% (0)
Women who did not give birth in the past 12 months Now married:
29.2% (89)Unmarried:
70.8% (217)
Marital status - White alone, not Hispanic / Latino population 15 years and over
Males 25.8% Never married52.8% Now married0.3% Separated3.4% Widowed17.6% DivorcedFemales 22.9% Never married42.3% Now married1.5% Separated13.6% Widowed19.7% DivorcedWomen who gave birth in the past 12 months Now married:
59.7% (84)Unmarried:
40.3% (57)
Women who did not give birth in the past 12 months Now married:
37.7% (465)Unmarried:
62.3% (770)
Marital status - Hispanic or Latino population 15 years and over
Males 40.4% Never married31.9% Now married14.2% Separated0.0% Widowed13.5% DivorcedFemales 38.1% Never married37.4% Now married0.0% Separated9.5% Widowed14.9% DivorcedWomen who gave birth in the past 12 months Now married:
100.0% (39)Unmarried:
0.0% (0)
Women who did not give birth in the past 12 months Now married:
35.0% (178)Unmarried:
65.0% (330)
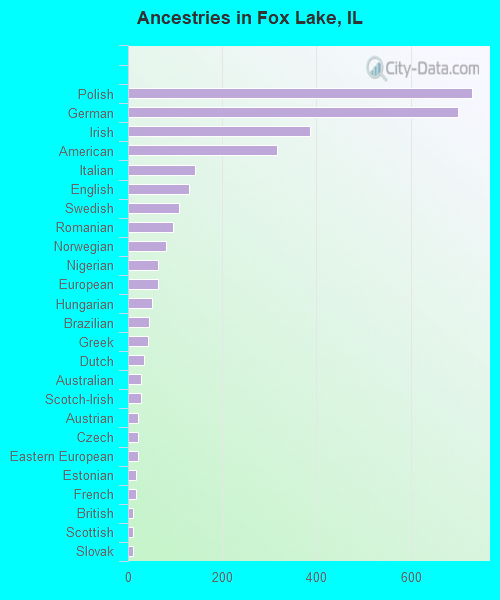
Ancestries in Fox Lake
730 16.8% Polish701 16.1% German387 8.9% Irish316 7.3% American142 3.3% Italian130 3.0% English109 2.5% Swedish96 2.2% Romanian80 1.8% Norwegian64 1.5% Nigerian63 1.4% European52 1.2% Hungarian45 1.0% Brazilian42 1.0% Greek35 0.8% Dutch28 0.6% Australian27 0.6% Scotch-Irish22 0.5% Austrian22 0.5% Czech21 0.5% Eastern European17 0.4% Estonian17 0.4% French10 0.2% British10 0.2% Scottish10 0.2% Slovak9 0.2% Finnish9 0.2% Lithuanian7 0.2% Russian
Children Nativity (place of birth) in Fox Lake
Children under 6 years - Living with two parents Both parents native 222 100.0% NativeBoth parents foreign-born 12 100.0% NativeOne native, one foreign-born parent 144 100.0% NativeChildren under 6 years - Living with one parent Native parent 128 100.0% NativeChildren 6 to 17 years - Living with two parents Both parents native 450 100.0% NativeBoth parents foreign-born 27 100.0% NativeOne native, one foreign-born parent 49 100.0% NativeChildren 6 to 17 years - Living with one parent Native parent 152 100.0% NativeForeign-born parent 193 58.3% Native138 41.7% Foreign-born
Grandparents responsible for own grandchildren in Fox Lake
Grandparents (30 to 59 years) White / Caucasian 101 90.1% Responsible for grandchildren11 9.9% Not responsible for grandchildrenWhite alone, not Hispanic / Latino 129 91.7% Responsible for grandchildren12 8.3% Not responsible for grandchildrenGrandparents (60 years and over) White / Caucasian 22 53.1% Responsible for grandchildren19 46.9% Not responsible for grandchildrenWhite alone, not Hispanic / Latino 26 49.5% Responsible for grandchildren27 50.5% Not responsible for grandchildren