Estimated zip code population in 2022: 10,898 Zip code population in 2010: 9,825 Zip code population in 2000: 6,457
Houses and condos: 5,723 Renter-occupied apartments: 1,333
% of renters here:
25%
State:
33%
March 2022 cost of living index in zip code 60020: 95.9 (near average, U.S. average is 100)
Land area: 4.6 sq. mi. Water area: 1.3 sq. mi.
Population density: 2,385 people per square mile
(low).
OSM Map
General Map
Google Map
MSN Map
OSM Map
General Map
Google Map
MSN Map
OSM Map
General Map
Google Map
MSN Map
OSM Map
General Map
Google Map
MSN Map
Please wait while loading the map...
Real estate property taxes paid for housing units in 2022:
This zip code:
2.1% ($4,600)
Illinois:
2.0% ($4,912)
Median real estate property taxes paid for housing units with mortgages in 2022: $4,460 (2.1%) Median real estate property taxes paid for housing units with no mortgage in 2022: $4,878 (2.2%)
Averages for the 2020 tax year for zip code 60020, filed in 2021:
Average Adjusted Gross Income (AGI) in 2020: $65,390 (Individual Income Tax Returns)
Here:
$65,390
State:
$82,626
Salary/wage: $59,054 (reported on 81.3% of returns)
Here:
$59,054
State:
$66,640
(% of AGI for various income ranges: 1047.5% for AGIs below $25k, 3486.7% for AGIs $25k-50k, 6195.4% for AGIs $50k-75k, 8846.0% for AGIs $75k-100k, 16554.2% for AGIs $100k-200k, 61605.7% for AGIs over 200k)
Taxable interest for individuals: $1,125 (reported on 26.6% of returns)
This zip code:
$1,125
Illinois:
$2,376
(% of AGI for various income ranges: 17.4% for AGIs below $25k, 14.5% for AGIs $25k-50k, 38.5% for AGIs $50k-75k, 33.8% for AGIs $75k-100k, 105.3% for AGIs $100k-200k, 442.9% for AGIs over 200k)
Ordinary dividends: $4,136 (reported on 19.2% of returns)
Here:
$4,136
State:
$9,061
(% of AGI for various income ranges: 35.4% for AGIs below $25k, 35.7% for AGIs $25k-50k, 58.6% for AGIs $50k-75k, 124.0% for AGIs $75k-100k, 171.8% for AGIs $100k-200k, 2518.6% for AGIs over 200k)
Net capital gain/loss in AGI: +$13,734 (reported on 16.8% of returns)
Here:
+$13,734
State:
+$31,684
(% of AGI for various income ranges: 10.6% for AGIs below $25k, 36.1% for AGIs $25k-50k, 61.7% for AGIs $50k-75k, 114.2% for AGIs $75k-100k, 403.0% for AGIs $100k-200k, 13410.0% for AGIs over 200k)
Profit/loss from business: +$9,241 (reported on 12.1% of returns)
Here:
+$9,241
State:
+$12,175
(% of AGI for various income ranges: 108.9% for AGIs below $25k, 119.6% for AGIs $25k-50k, 98.6% for AGIs $50k-75k, 139.1% for AGIs $75k-100k, 260.2% for AGIs $100k-200k, 1280.0% for AGIs over 200k)
Taxable individual retirement arrangement distribution: $16,632 (reported on 10.5% of returns)
60020:
$16,632
Illinois:
$21,613
(% of AGI for various income ranges: 93.5% for AGIs below $25k, 112.2% for AGIs $25k-50k, 184.2% for AGIs $50k-75k, 369.8% for AGIs $75k-100k, 584.9% for AGIs $100k-200k, 1800.0% for AGIs over 200k)
Total itemized deductions: $22,546 (reported on 9.8% of returns)
Here:
$22,546
State:
$34,948
(% of AGI for various income ranges: 71.7% for AGIs below $25k, 128.6% for AGIs $25k-50k, 311.9% for AGIs $50k-75k, 525.8% for AGIs $75k-100k, 657.7% for AGIs $100k-200k, 2762.9% for AGIs over 200k)
Charity contributions: $4,432 (reported on 6.6% of returns)
Here:
$4,432
State:
$13,122
(% of AGI for various income ranges: 17.1% for AGIs $25k-50k, 24.9% for AGIs $50k-75k, 60.0% for AGIs $75k-100k, 98.2% for AGIs $100k-200k, 681.4% for AGIs over 200k)
Taxes paid: $8,307 (reported on 9.8% of returns)
60020:
$8,307
State:
$8,563
(% of AGI for various income ranges: 17.0% for AGIs below $25k, 44.6% for AGIs $25k-50k, 123.8% for AGIs $50k-75k, 213.1% for AGIs $75k-100k, 261.1% for AGIs $100k-200k, 854.3% for AGIs over 200k)
Earned income credit: $1,916 (reported on 11.0% of returns)
Here:
$1,916
State:
$2,311
(% of AGI for various income ranges: 66.7% for AGIs below $25k, 36.8% for AGIs $25k-50k)
Percentage of individuals using paid preparers for their 2020 taxes: 92.8%
Here:
93%
State:
93%
(% for various income ranges: 90.1% for AGIs below $25k, 93.1% for AGIs $25k-50k, 94.7% for AGIs $50k-75k, 93.4% for AGIs $75k-100k, 94.5% for AGIs $100k-200k, 95.0% for AGIs over 200k)
Averages for the 2012 tax year for zip code 60020, filed in 2013:
Average Adjusted Gross Income (AGI) in 2012: $52,566 (Individual Income Tax Returns)
Here:
$52,566
State:
$68,058
Salary/wage: $49,026 (reported on 82.6% of returns)
Here:
$49,026
State:
$55,396
(% of AGI for various income ranges: 67.9% for AGIs below $25k, 79.6% for AGIs $25k-50k, 79.0% for AGIs $50k-75k, 78.9% for AGIs $75k-100k, 79.4% for AGIs $100k-200k, 65.7% for AGIs over 200k)
Taxable interest for individuals: $833 (reported on 32.3% of returns)
This zip code:
$833
Illinois:
$1,969
(% of AGI for various income ranges: 1.2% for AGIs below $25k, 0.6% for AGIs $25k-50k, 0.6% for AGIs $50k-75k, 0.4% for AGIs $75k-100k, 0.4% for AGIs $100k-200k, 0.3% for AGIs over 200k)
Ordinary dividends: $2,574 (reported on 20.2% of returns)
Here:
$2,574
State:
$7,786
(% of AGI for various income ranges: 2.0% for AGIs below $25k, 0.8% for AGIs $25k-50k, 1.0% for AGIs $50k-75k, 1.0% for AGIs $75k-100k, 0.8% for AGIs $100k-200k, 1.0% for AGIs over 200k)
Net capital gain/loss in AGI: +$2,087 (reported on 14.3% of returns)
Here:
+$2,087
State:
+$22,183
(% of AGI for various income ranges: 0.3% for AGIs $50k-75k, 0.5% for AGIs $75k-100k, 0.8% for AGIs $100k-200k, 2.5% for AGIs over 200k)
Profit/loss from business: +$7,728 (reported on 11.0% of returns)
Here:
+$7,728
State:
+$12,903
(% of AGI for various income ranges: 5.7% for AGIs below $25k, 1.7% for AGIs $25k-50k, 0.8% for AGIs $50k-75k, 0.7% for AGIs $75k-100k, 2.0% for AGIs $100k-200k)
Taxable individual retirement arrangement distribution: $14,293 (reported on 11.9% of returns)
60020:
$14,293
Illinois:
$17,929
(% of AGI for various income ranges: 5.3% for AGIs below $25k, 3.1% for AGIs $25k-50k, 2.8% for AGIs $50k-75k, 3.0% for AGIs $75k-100k, 4.1% for AGIs $100k-200k)
Total itemized deductions: $19,792 (24% of AGI, reported on 42.3% of returns)
Here:
$19,792
State:
$26,433
Here:
23.7% of AGI
State:
19.2% of AGI
(% of AGI for various income ranges: 14.2% for AGIs below $25k, 13.4% for AGIs $25k-50k, 17.0% for AGIs $50k-75k, 17.9% for AGIs $75k-100k, 17.3% for AGIs $100k-200k, 11.8% for AGIs over 200k)
Charity contributions: $1,796 (reported on 32.9% of returns)
Here:
$1,796
State:
$4,525
(% of AGI for various income ranges: 0.7% for AGIs below $25k, 0.7% for AGIs $25k-50k, 1.2% for AGIs $50k-75k, 1.3% for AGIs $75k-100k, 1.3% for AGIs $100k-200k, 1.3% for AGIs over 200k)
Taxes paid: $8,825 (reported on 42.3% of returns)
60020:
$8,825
State:
$11,968
(% of AGI for various income ranges: 4.5% for AGIs below $25k, 5.3% for AGIs $25k-50k, 6.7% for AGIs $50k-75k, 8.2% for AGIs $75k-100k, 8.6% for AGIs $100k-200k, 7.0% for AGIs over 200k)
Earned income credit: $1,895 (reported on 13.3% of returns)
Here:
$1,895
State:
$2,349
(% of AGI for various income ranges: 4.3% for AGIs below $25k, 0.7% for AGIs $25k-50k)
Percentage of individuals using paid preparers for their 2012 taxes: 53.6%
Here:
54%
State:
57%
(% for various income ranges: 47.4% for AGIs below $25k, 53.7% for AGIs $25k-50k, 56.8% for AGIs $50k-75k, 59.3% for AGIs $75k-100k, 60.3% for AGIs $100k-200k, 71.4% for AGIs over 200k)
Averages for the 2004 tax year for zip code 60020, filed in 2005:
Average Adjusted Gross Income (AGI) in 2004: $45,849 (Individual Income Tax Returns)
Here:
$45,849
State:
$54,625
Salary/wage: $43,506 (reported on 84.2% of returns)
Here:
$43,506
State:
$46,811
(% of AGI for various income ranges: 85.0% for AGIs below $10k, 70.5% for AGIs $10k-25k, 82.2% for AGIs $25k-50k, 86.6% for AGIs $50k-75k, 84.0% for AGIs $75k-100k, 72.1% for AGIs over 100k)
Taxable interest for individuals: $1,571 (reported on 46.2% of returns)
This zip code:
$1,571
Illinois:
$2,101
(% of AGI for various income ranges: 6.3% for AGIs below $10k, 3.8% for AGIs $10k-25k, 1.4% for AGIs $25k-50k, 1.2% for AGIs $50k-75k, 0.9% for AGIs $75k-100k, 1.6% for AGIs over 100k)
Taxable dividends: $2,385 (reported on 24.1% of returns)
Here:
$2,385
State:
$4,306
(% of AGI for various income ranges: 5.4% for AGIs below $10k, 2.7% for AGIs $10k-25k, 1.1% for AGIs $25k-50k, 0.6% for AGIs $50k-75k, 1.1% for AGIs $75k-100k, 1.3% for AGIs over 100k)
Net capital gain/loss: +$5,814 (reported on 18.1% of returns)
Here:
+$5,814
State:
+$17,321
(% of AGI for various income ranges: -0.6% for AGIs below $10k, -0.1% for AGIs $10k-25k, 0.7% for AGIs $25k-50k, 1.1% for AGIs $50k-75k, 1.2% for AGIs $75k-100k, 6.4% for AGIs over 100k)
Profit/loss from business: +$7,166 (reported on 11.5% of returns)
Here:
+$7,166
State:
+$11,771
(% of AGI for various income ranges: 6.6% for AGIs below $10k, 5.3% for AGIs $10k-25k, 1.9% for AGIs $25k-50k, 1.3% for AGIs $50k-75k, 1.9% for AGIs $75k-100k, 0.8% for AGIs over 100k)
IRA payment deduction: $3,110 (reported on 2.0% of returns)
60020:
$3,110
Illinois:
$3,087
(% of AGI for various income ranges: 0.2% for AGIs $10k-25k, 0.2% for AGIs $25k-50k, 0.1% for AGIs $50k-75k, 0.1% for AGIs $75k-100k, 0.1% for AGIs over 100k)
Total itemized deductions: $16,133 (24% of AGI, reported on 44.8% of returns)
Here:
$16,133
State:
$20,239
Here:
23.6% of AGI
State:
19.5% of AGI
(% of AGI for various income ranges: 20.6% for AGIs below $10k, 14.8% for AGIs $10k-25k, 15.2% for AGIs $25k-50k, 16.9% for AGIs $50k-75k, 16.3% for AGIs $75k-100k, 15.0% for AGIs over 100k)
Charity contributions deductions: $1,605 (2% of AGI, reported on 38.3% of returns)
Here:
$1,605
State:
$3,719
Here:
2.2% of AGI
State:
3.4% of AGI
(% of AGI for various income ranges: 0.7% for AGIs below $10k, 1.1% for AGIs $10k-25k, 1.2% for AGIs $25k-50k, 1.3% for AGIs $50k-75k, 1.5% for AGIs $75k-100k, 1.5% for AGIs over 100k)
Total tax: $6,142 (reported on 81.6% of returns)
60020:
$6,142
State:
$9,882
(% of AGI for various income ranges: 2.2% for AGIs below $10k, 4.5% for AGIs $10k-25k, 7.9% for AGIs $25k-50k, 10.1% for AGIs $50k-75k, 11.2% for AGIs $75k-100k, 16.5% for AGIs over 100k)
Earned income credit: $1,453 (reported on 9.7% of returns)
Here:
$1,453
State:
$1,788
Percentage of individuals using paid preparers for their 2004 taxes: 57.5%
Here:
58%
State:
61%
(% for various income ranges: 48.5% for AGIs below $10k, 56.3% for AGIs $10k-25k, 56.9% for AGIs $25k-50k, 60.0% for AGIs $50k-75k, 64.1% for AGIs $75k-100k, 67.5% for AGIs over 100k)
Household received Food Stamps/SNAP in the past 12 months: 390 Household did not receive Food Stamps/SNAP in the past 12 months: 4,803
Women who had a birth in the past 12 months: 142 (113 now married, 29 unmarried) Women who did not have a birth in the past 12 months: 2,017 (878 now married, 1,135 unmarried)
Housing units in zip code 60020 with a mortgage: 2,536 (87 second mortgage, 12 home equity loan, 56 both second mortgage and home equity loan) Houses without a mortgage: 24
Median monthly owner costs for units with a mortgage: $1,615 Median monthly owner costs for units without a mortgage: $825
Residents with income below the poverty level in 2022:
This zip code:
11.0%
Whole state:
11.9%
Residents with income below 50% of the poverty level in 2022:
This zip code:
6.4%
Whole state:
5.7%
Median number of rooms in houses and condos:
Here:
5.8
State:
6.4
Median number of rooms in apartments:
Here:
4.1
State:
4.1
Notable locations in this zip code not listed on our city pages
Notable locations in zip code 60020: Fox Lake Regional Sewage Treatment Plant (A), Fox Lake Fire Department Station 1 (B). Display/hide their locations on the map
In group quarters: 49 (-1 institutionalized population)
Size of family households: 1,460 2-persons, 529 3-persons, 485 4-persons, 92 5-persons, 75 6-persons, 14 7-or-more-persons
Size of nonfamily households: 2,029 1-person, 397 2-persons, 189 3-persons
999 married couples with children.
327 single-parent households (97 men, 230 women).
86.1% of residents of 60020 zip code speak English at home.
5.0% of residents speak Spanish at home (65% very well, 18% well, 7% not well, 10% not at all).
7.0% of residents speak other Indo-European language at home (83% very well, 13% well, 3% not well, 1% not at all).
0.6% of residents speak Asian or Pacific Island language at home (54% not well, 46% not at all).
1.3% of residents speak other language at home (100% very well).
Foreign born population: 919 (8.4%) (64.9% of them are naturalized citizens)
This zip code:
8.4%
Whole state:
14.4%
30%Honduras
26%North Macedonia (Macedonia)
12%Serbia
7%Liberia
7%Japan
5%Bolivia
3%Poland
18%German
18%Polish
9%American
7%Irish
6%Italian
3%English
3%Ukrainian
Year of entry for the foreign-born population
1702010 or later
2422000 to 2009
2991990 to 1999
233Before 1990
Major facilities with environmental interests located in this zip code:
PRAIRIE MATERIAL SALES INC (1W HIGHVIEW AVENUE in FOX LAKE, IL)
STATE MASTER (Illinois EPA Project) - AIR PROGRAM STATE MASTER (Illinois EPA Project) - National Pollutant Discharge Elimination System Permit AIR MINOR (AIRS/AFS) CRITERIA AND HAZARDOUS AIR POLLUTANT INVENTORY (Inventory of air pollution sources) National Pollutant Discharge Elimination System NON-MAJOR (Tracking pollutant discharge elimination systems) - permit National Pollutant Discharge Elimination System NON-MAJOR (Tracking pollutant discharge elimination systems) - permit Business SIC classification: READY-MIXED CONCRETE Organizations: PRAIRIE MATERIALS YARD 23 (CONTACT/OWNER)
Alternative names: PRAIRIE MATERIAL SALES YARD 23, PRAIRIE MATERIALS YARD 23
PRECISION CHROME INC (105 PRECISION ROAD in FOX LAKE, IL)
STATE MASTER (Illinois EPA Project) - SOLID WASTE PROGRAM, HAZARDOUS WASTE PROGRAM, AIR PROGRAM AIR MINOR (AIRS/AFS) CRITERIA AND HAZARDOUS AIR POLLUTANT INVENTORY (Inventory of air pollution sources) National Pollutant Discharge Elimination System NON-MAJOR (Tracking pollutant discharge elimination systems) - permit HAZARDOUS WASTE BIENNIAL REPORTER (Resource Conservation and Recovery Act (tracking hazardous waste)) Large Quantity Generators, more that 1000 kg of hazardous waste/month (Resource Conservation and Recovery Act (tracking hazardous waste)) TSD (Resource Conservation and Recovery Act (tracking hazardous waste)) - notification TRI REPORTER (Tracking of toxic chemicals releasing facilities) Business SIC and NAICS classification: ELECTROPLATING, PLATING, POLISHING, ANODIZING, AND COLORING Organizations: DONALD HJARTLAND (CONTACT/OWNER)
AGGREGATE SUPPLY LLC (28435 W. ROUTE 173 in FOX LAKE, IL)
STATE MASTER (Illinois EPA Project) - AIR PROGRAM AIR MINOR (AIRS/AFS) CRITERIA AND HAZARDOUS AIR POLLUTANT INVENTORY (Inventory of air pollution sources) Business SIC classification: CRUSHED AND BROKEN LIMESTONE Alternative names: MIDWEST AGGREGATES L L C
GRANT COMMUNITY HIGH SCHOOL (285 E GRAND AVE in FOX LAKE, IL)
STATE MASTER (Illinois EPA Project) - SOLID WASTE PROGRAM (National Center for Education Statistics) - STATE ID-3404912400001 Organizations: GRANT COMM H S DISTRICT 124 (SCHOOL DISTRICT)
JEWEL FOOD STORES, INC. #3453 (1350 SOUTH ROUTE 12 in FOX LAKE, IL)
AIR MINOR (AIRS/AFS) - ICIS-05-2003-0340, ENFORCEMENT/COMPLIANCE ACTIVITY Conditionally Exempt Small Quantity Generators, less than 100 kg/month of hazardous waste (Resource Conservation and Recovery Act (tracking hazardous waste)) Business SIC classification: GROCERY STORES Organizations: JEWEL STORE (CONTACT/OPERATOR)
Alternative names: JEWEL STORE 3435
JOHN CRANE INC (104 SAYTON RD in FOX LAKE, IL)
STATE MASTER (Illinois EPA Project) - SOLID WASTE PROGRAM, HAZARDOUS WASTE PROGRAM Large Quantity Generators, more that 1000 kg of hazardous waste/month (Resource Conservation and Recovery Act (tracking hazardous waste)) - notification Organizations: CRANE JOHN HOUDAILLE (CONTACT/OWNER)
Alternative names: CRANE JOHN HOUDAILLE INC
ABRASIVE RUBBER WHEEL (135 S ROUTE 12 in FOX LAKE, IL)
STATE MASTER (Illinois EPA Project) - AIR PROGRAM AIR MINOR (AIRS/AFS) CRITERIA AND HAZARDOUS AIR POLLUTANT INVENTORY (Inventory of air pollution sources) Business SIC classification: ABRASIVE PRODUCTS
JACK F FROST IRONWORKS (90 HONING RD in FOX LAKE, IL)
STATE MASTER (Illinois EPA Project) - National Pollutant Discharge Elimination System Permit (Resource Conservation and Recovery Act (tracking hazardous waste)) Organizations: JACK FROST IRONWORKS (CONTACT/OWNER)
Alternative names: JACK FROST IRONWORKS
OLSON OIL CO (2 INDUSTRIAL DR. in FOX LAKE, IL)
STATE MASTER (Illinois EPA Project) - AIR PROGRAM AIR MINOR (AIRS/AFS) CRITERIA AND HAZARDOUS AIR POLLUTANT INVENTORY (Inventory of air pollution sources) Business SIC classification: PETROLEUM BULK STATIONS AND TERMINALS
PAYNE & DOLAN INC (28327 W ROUTE 173 in FOX LAKE, IL)
STATE MASTER (Illinois EPA Project) - AIR PROGRAM AIR MINOR (AIRS/AFS) CRITERIA AND HAZARDOUS AIR POLLUTANT INVENTORY (Inventory of air pollution sources) Business SIC classification: HIGHWAY AND STREET CONSTRUCTION, EXCEPT ELEVATED HIGHWAYS; ASPHALT PAVING MIXTURES AND BLOCKS Business NAICS classification: ASPHALT PAVING MIXTURE AND BLOCK MANUFACTURING.
PEARSON AUTOMOTIVE (272 E GRAND AVE in FOX LAKE, IL)
STATE MASTER (Illinois EPA Project) - HAZARDOUS WASTE PROGRAM, SOLID WASTE PROGRAM (Resource Conservation and Recovery Act (tracking hazardous waste)) Organizations: PEARSONS AUTOMOTIVE (CONTACT/OWNER)
CLARK STORE 1065-ERS (95 GRAND AVE in FOX LAKE, IL)
STATE MASTER (Illinois EPA Project) - SOLID WASTE PROGRAM, AIR PROGRAM AIR MINOR (AIRS/AFS) CRITERIA AND HAZARDOUS AIR POLLUTANT INVENTORY (Inventory of air pollution sources) Business SIC classification: GASOLINE SERVICE STATIONS
Housing units lacking complete plumbing facilities: 0.1% Housing units lacking complete kitchen facilities: 0.5%
83.8%Utility gas
15.5%Electricity
0.7%Other fuel
Population in 1990: 10,336.
Place of birth for U.S.-born residents:
This state: 8,154
Northeast: 150
Midwest: 1,098
South: 384
West: 126
53% of the 60020 zip code residents lived in the same house 5 years ago. Out of people who lived in different houses, 49% lived in this county. Out of people who lived in different counties, 50% lived in Illinois.
87% of the 60020 zip code residents lived in the same house 1 year ago. Out of people who lived in different houses, 44% moved from this county. Out of people who lived in different houses, 39% moved from different county within same state. Out of people who lived in different houses, 19% moved from different state.
Private vs. public school enrollment:
Students in private schools in grades 1 to 8 (elementary and middle school): 96
Here:
14.4%
Illinois:
13.3%
Students in private schools in grades 9 to 12 (high school):
Here:
0.0%
Illinois:
9.9%
Students in private undergraduate colleges: 22
Here:
5.5%
Illinois:
27.4%
Occupation by median earnings in the past 12 months ($)
133,312Health diagnosing and treating practitioners and other technical occupations
103,933Computer and mathematical occupations
93,459Construction and extraction occupations
88,241Management occupations
74,644Legal occupations
69,065Life, physical, and social science occupations
Companies with federal contracts located in this zip code:
GERALDINE J KENT (180 HOWARD CT in FOX LAKE, IL; small business) : $341,826 in 6 contractsfrom 2000 to 2005
Contracts for Other Medical Services, Anesthesiology Services, Dentistry Services by Navy Signed by year:2000: $61,011; 2001: $62,608; 2002: $0; 2003: $68,937; 2004: $72,996; 2005: $76,274; 2006: $0.
Biggest contracts:
$76,274 with Navy for Other Medical Services. Taking place in VA. Signed on 2005-10-21. Completion date: 2005-09-30.
$72,996, same as above.Signed on 2004-10-01. Completion date: 2005-09-30.
$68,937 with Navy for Anesthesiology Services. Signed on 2003-10-01. Completion date: 2004-09-30.
$62,608, same as above.Signed on 2001-10-01. Completion date: 2004-09-30.
DONNA DELAY-VICK (202 RICHARD CT in FOX LAKE, IL; small business) : $189,746 in 4 contractsfrom 2000 to 2002
$66,398 with Navy for Dentistry Services. Signed on 2002-10-01. Completion date: 2003-09-30.
$62,587, same as above.Signed on 2000-10-01. Completion date: 2001-09-30.
$60,761, same as above.Signed on 2000-02-16. Completion date: 2000-09-30.
$0, same as above.Signed on 2000-02-16. Completion date: 2000-09-30.
OR BUSINESS SOLUTIONS INC (27-4 JAMAICA in FOX LAKE, IL; small business)
$3,115 with Navy for Miscellaneous Communication Equipment. Taking place in MD. Signed on 2005-09-22. Completion date: 2005-10-31.
Top industries in this zip code by the number of employees in 2005:
Construction: Commercial and Institutional Building Construction (20-49: 2, 1-4: 1)
Administrative and Support and Waste Management and Remediation Services: Janitorial Services (20-49: 1, 10-19: 2)
Other Services (except Public Administration): Other Similar Organizations (except Business, Professional, Labor, and Political Organizations) (20-49: 1, 10-19: 1)
People in group quarters in 2010:
45 people in nursing facilities/skilled-nursing facilities
Fatal accident statistics in 2012:
Fatal accident count: 2
Vehicles involved in fatal accidents: 2
Fatal accidents caused by drunken drivers: 1
Fatalities: 2
Persons involved in fatal accidents: 4
Pedestrians involved in fatal accidents: 0
Fatal accident statistics in 2011:
Fatal accident count: 1
Vehicles involved in fatal accidents: 2
Fatal accidents caused by drunken drivers: 1
Fatalities: 1
Persons involved in fatal accidents: 2
Pedestrians involved in fatal accidents: 0
Home Mortgage Disclosure Act Aggregated Statistics For Year 2009 (Based on 10 partial tracts)
A) FHA, FSA/RHS & VA Home Purchase Loans
B) Conventional Home Purchase Loans
C) Refinancings
D) Home Improvement Loans
E) Loans on Dwellings For 5+ Families
F) Non-occupant Loans on < 5 Family Dwellings (A B C & D)
G) Loans On Manufactured Home Dwelling (A B C & D)
Number
Average Value
Number
Average Value
Number
Average Value
Number
Average Value
Number
Average Value
Number
Average Value
Number
Average Value
LOANS ORIGINATED
29
$141,476
49
$120,815
213
$176,081
8
$118,198
1
$251,020
32
$144,077
2
$147,985
APPLICATIONS APPROVED, NOT ACCEPTED
2
$237,485
0
$0
20
$154,039
0
$0
0
$0
3
$225,717
0
$0
APPLICATIONS DENIED
3
$262,093
24
$151,217
98
$193,165
15
$37,865
0
$0
16
$125,076
0
$0
APPLICATIONS WITHDRAWN
2
$205,320
3
$168,983
50
$163,175
1
$34,450
0
$0
5
$106,628
0
$0
FILES CLOSED FOR INCOMPLETENESS
1
$184,380
1
$195,190
15
$167,029
3
$73,867
0
$0
3
$85,807
0
$0
Aggregated Statistics For Year 2008 (Based on 10 partial tracts)
A) FHA, FSA/RHS & VA Home Purchase Loans
B) Conventional Home Purchase Loans
C) Refinancings
D) Home Improvement Loans
E) Loans on Dwellings For 5+ Families
F) Non-occupant Loans on < 5 Family Dwellings (A B C & D)
Number
Average Value
Number
Average Value
Number
Average Value
Number
Average Value
Number
Average Value
Number
Average Value
LOANS ORIGINATED
17
$149,654
55
$143,538
161
$200,791
9
$64,413
1
$542,400
26
$111,464
APPLICATIONS APPROVED, NOT ACCEPTED
2
$130,185
6
$186,567
25
$186,404
1
$161,540
0
$0
5
$186,608
APPLICATIONS DENIED
4
$224,548
15
$129,281
137
$176,339
12
$101,182
0
$0
18
$169,451
APPLICATIONS WITHDRAWN
4
$90,385
10
$208,003
37
$178,728
2
$211,665
0
$0
5
$217,846
FILES CLOSED FOR INCOMPLETENESS
2
$149,630
2
$167,450
14
$161,280
0
$0
0
$0
2
$114,515
Aggregated Statistics For Year 2007 (Based on 10 partial tracts)
A) FHA, FSA/RHS & VA Home Purchase Loans
B) Conventional Home Purchase Loans
C) Refinancings
D) Home Improvement Loans
E) Loans on Dwellings For 5+ Families
F) Non-occupant Loans on < 5 Family Dwellings (A B C & D)
Number
Average Value
Number
Average Value
Number
Average Value
Number
Average Value
Number
Average Value
Number
Average Value
LOANS ORIGINATED
4
$175,738
180
$161,535
226
$187,429
37
$67,052
2
$441,285
50
$152,876
APPLICATIONS APPROVED, NOT ACCEPTED
0
$0
27
$173,691
48
$169,503
4
$46,680
0
$0
12
$159,787
APPLICATIONS DENIED
0
$0
33
$204,502
162
$174,148
28
$93,022
0
$0
17
$211,682
APPLICATIONS WITHDRAWN
0
$0
15
$101,328
68
$179,395
6
$107,192
0
$0
15
$181,460
FILES CLOSED FOR INCOMPLETENESS
0
$0
4
$215,302
27
$293,856
2
$53,420
0
$0
4
$171,275
Aggregated Statistics For Year 2006 (Based on 10 partial tracts)
A) FHA, FSA/RHS & VA Home Purchase Loans
B) Conventional Home Purchase Loans
C) Refinancings
D) Home Improvement Loans
E) Loans on Dwellings For 5+ Families
F) Non-occupant Loans on < 5 Family Dwellings (A B C & D)
G) Loans On Manufactured Home Dwelling (A B C & D)
Number
Average Value
Number
Average Value
Number
Average Value
Number
Average Value
Number
Average Value
Number
Average Value
Number
Average Value
LOANS ORIGINATED
13
$190,373
367
$137,698
277
$172,578
34
$60,572
3
$1,445,173
74
$127,957
1
$50,920
APPLICATIONS APPROVED, NOT ACCEPTED
2
$122,185
46
$162,280
38
$165,542
2
$75,075
0
$0
5
$67,954
0
$0
APPLICATIONS DENIED
1
$188,020
67
$125,466
176
$183,747
24
$77,905
0
$0
26
$142,139
0
$0
APPLICATIONS WITHDRAWN
2
$207,460
38
$144,178
96
$212,062
8
$151,719
1
$2,828,800
13
$104,994
0
$0
FILES CLOSED FOR INCOMPLETENESS
0
$0
10
$103,098
22
$178,993
4
$159,158
0
$0
0
$0
0
$0
Aggregated Statistics For Year 2005 (Based on 10 partial tracts)
A) FHA, FSA/RHS & VA Home Purchase Loans
B) Conventional Home Purchase Loans
C) Refinancings
D) Home Improvement Loans
E) Loans on Dwellings For 5+ Families
F) Non-occupant Loans on < 5 Family Dwellings (A B C & D)
G) Loans On Manufactured Home Dwelling (A B C & D)
Number
Average Value
Number
Average Value
Number
Average Value
Number
Average Value
Number
Average Value
Number
Average Value
Number
Average Value
LOANS ORIGINATED
16
$155,482
346
$141,310
297
$155,648
39
$81,497
3
$339,947
80
$123,904
1
$209,330
APPLICATIONS APPROVED, NOT ACCEPTED
2
$218,020
35
$122,419
51
$147,781
5
$33,828
0
$0
9
$97,651
0
$0
APPLICATIONS DENIED
2
$225,085
73
$127,828
164
$160,964
26
$40,150
0
$0
9
$151,184
1
$13,650
APPLICATIONS WITHDRAWN
2
$189,050
46
$146,484
103
$168,368
10
$123,572
0
$0
11
$141,716
0
$0
FILES CLOSED FOR INCOMPLETENESS
3
$175,857
16
$149,259
34
$143,111
2
$68,090
0
$0
2
$157,485
0
$0
Aggregated Statistics For Year 2004 (Based on 10 partial tracts)
A) FHA, FSA/RHS & VA Home Purchase Loans
B) Conventional Home Purchase Loans
C) Refinancings
D) Home Improvement Loans
F) Non-occupant Loans on < 5 Family Dwellings (A B C & D)
G) Loans On Manufactured Home Dwelling (A B C & D)
Number
Average Value
Number
Average Value
Number
Average Value
Number
Average Value
Number
Average Value
Number
Average Value
LOANS ORIGINATED
35
$153,368
296
$125,103
319
$140,320
23
$83,587
67
$124,919
0
$0
APPLICATIONS APPROVED, NOT ACCEPTED
3
$145,163
37
$119,761
51
$150,358
2
$36,910
11
$103,850
1
$113,150
APPLICATIONS DENIED
3
$136,823
40
$111,608
162
$127,433
25
$41,464
16
$89,147
3
$44,703
APPLICATIONS WITHDRAWN
3
$128,617
24
$111,182
85
$151,458
8
$101,878
8
$114,179
0
$0
FILES CLOSED FOR INCOMPLETENESS
3
$148,153
17
$122,892
46
$167,612
3
$37,147
2
$213,040
0
$0
Aggregated Statistics For Year 2003 (Based on 10 partial tracts)
A) FHA, FSA/RHS & VA Home Purchase Loans
B) Conventional Home Purchase Loans
C) Refinancings
D) Home Improvement Loans
E) Loans on Dwellings For 5+ Families
F) Non-occupant Loans on < 5 Family Dwellings (A B C & D)
Number
Average Value
Number
Average Value
Number
Average Value
Number
Average Value
Number
Average Value
Number
Average Value
LOANS ORIGINATED
35
$145,649
229
$131,986
662
$140,815
17
$43,427
3
$365,020
71
$109,795
APPLICATIONS APPROVED, NOT ACCEPTED
2
$156,420
23
$144,877
82
$128,060
6
$22,630
0
$0
8
$146,995
APPLICATIONS DENIED
4
$107,732
31
$101,937
138
$130,468
9
$24,464
0
$0
14
$72,659
APPLICATIONS WITHDRAWN
4
$152,972
23
$151,743
134
$138,590
2
$128,170
0
$0
12
$118,790
FILES CLOSED FOR INCOMPLETENESS
4
$150,725
6
$165,207
21
$160,207
1
$21,220
0
$0
4
$139,370
Aggregated Statistics For Year 2002 (Based on 4 partial tracts)
A) FHA, FSA/RHS & VA Home Purchase Loans
B) Conventional Home Purchase Loans
C) Refinancings
D) Home Improvement Loans
E) Loans on Dwellings For 5+ Families
F) Non-occupant Loans on < 5 Family Dwellings (A B C & D)
Number
Average Value
Number
Average Value
Number
Average Value
Number
Average Value
Number
Average Value
Number
Average Value
LOANS ORIGINATED
15
$121,737
70
$123,268
156
$123,227
5
$30,024
2
$701,385
20
$112,616
APPLICATIONS APPROVED, NOT ACCEPTED
0
$0
5
$139,096
27
$116,050
1
$42,820
0
$0
0
$0
APPLICATIONS DENIED
2
$128,220
7
$111,940
42
$122,417
2
$26,825
0
$0
3
$117,143
APPLICATIONS WITHDRAWN
1
$96,470
4
$103,608
30
$115,733
2
$41,835
0
$0
2
$113,450
FILES CLOSED FOR INCOMPLETENESS
1
$135,850
2
$135,355
16
$129,018
0
$0
0
$0
0
$0
Aggregated Statistics For Year 2001 (Based on 4 partial tracts)
A) FHA, FSA/RHS & VA Home Purchase Loans
B) Conventional Home Purchase Loans
C) Refinancings
D) Home Improvement Loans
E) Loans on Dwellings For 5+ Families
F) Non-occupant Loans on < 5 Family Dwellings (A B C & D)
Number
Average Value
Number
Average Value
Number
Average Value
Number
Average Value
Number
Average Value
Number
Average Value
LOANS ORIGINATED
21
$118,503
67
$125,019
126
$124,933
7
$32,556
1
$408,030
16
$124,619
APPLICATIONS APPROVED, NOT ACCEPTED
1
$53,650
3
$103,527
15
$91,319
3
$68,580
0
$0
1
$74,810
APPLICATIONS DENIED
2
$186,790
8
$134,248
44
$113,452
7
$15,750
0
$0
4
$72,600
APPLICATIONS WITHDRAWN
0
$0
6
$146,593
31
$118,811
3
$63,823
0
$0
4
$127,850
FILES CLOSED FOR INCOMPLETENESS
0
$0
1
$216,570
5
$119,408
0
$0
0
$0
0
$0
Aggregated Statistics For Year 2000 (Based on 4 partial tracts)
A) FHA, FSA/RHS & VA Home Purchase Loans
B) Conventional Home Purchase Loans
C) Refinancings
D) Home Improvement Loans
E) Loans on Dwellings For 5+ Families
F) Non-occupant Loans on < 5 Family Dwellings (A B C & D)
Number
Average Value
Number
Average Value
Number
Average Value
Number
Average Value
Number
Average Value
Number
Average Value
LOANS ORIGINATED
19
$110,693
54
$101,530
40
$114,596
12
$27,728
1
$449,870
15
$95,060
APPLICATIONS APPROVED, NOT ACCEPTED
1
$104,840
4
$92,780
8
$111,914
2
$40,115
0
$0
1
$64,480
APPLICATIONS DENIED
2
$115,915
12
$93,436
26
$125,662
9
$20,946
0
$0
1
$163,900
APPLICATIONS WITHDRAWN
1
$123,050
4
$94,380
20
$108,481
2
$47,005
0
$0
3
$48,070
FILES CLOSED FOR INCOMPLETENESS
0
$0
3
$111,893
2
$87,860
1
$49,220
0
$0
0
$0
Aggregated Statistics For Year 1999 (Based on 5 partial tracts)
A) FHA, FSA/RHS & VA Home Purchase Loans
B) Conventional Home Purchase Loans
C) Refinancings
D) Home Improvement Loans
E) Loans on Dwellings For 5+ Families
F) Non-occupant Loans on < 5 Family Dwellings (A B C & D)
2002 - 2018 National Fire Incident Reporting System (NFIRS) incidents
Based on the data from the years 2002 - 2018 the average number of fire incidents per year is 43. The highest number of reported fire incidents - 78 took place in 2007, and the least - 10 in 2005. The data has an increasing trend.
When looking into fire subcategories, the most incidents belonged to: Structure Fires (52.5%), and Outside Fires (35.3%).
Fire incident types reported to NFIRS in Zip Code 60020

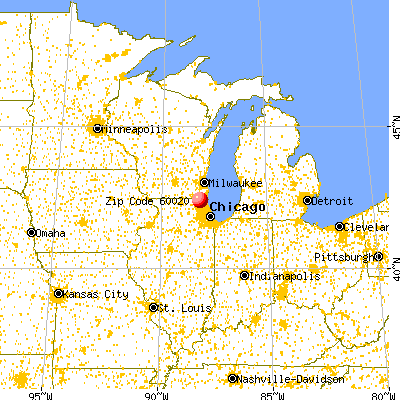


 Nearest zip codes: 60041, 60051, 60073, 60081, 60042, 53192.


 Based on the data from the years 2002 - 2018 the average number of fire incidents per year is 43. The highest number of reported fire incidents - 78 took place in 2007, and the least - 10 in 2005. The data has an increasing trend.
 When looking into fire subcategories, the most incidents belonged to: Structure Fires (52.5%), and Outside Fires (35.3%).