Races in Dunn, North Carolina (NC) Detailed Stats
Data:
Races - White alone (%)
Races - White alone (% change since 2000)
Races - Black alone (%)
Races - Black alone (% change since 2000)
Races - American Indian alone (%)
Races - American Indian alone (% change since 2000)
Races - Asian alone (%)
Races - Asian alone (% change since 2000)
Races - Hispanic (%)
Races - Hispanic (% change since 2000)
Races - Native Hawaiian and Other Pacific Islander alone (%)
Races - Native Hawaiian and Other Pacific Islander alone (% change since 2000)
Races - Two or more races(%)
Races - Two or more races(% change since 2000)
Races - Other race alone (%)
Races - Other race alone (% change since 2000)
Racial diversity
Place of birth - Born in state of residence (%)
Place of birth - Born in state of residence (%) - White
Place of birth - Born in state of residence (%) - Black or African American
Place of birth - Born in state of residence (%) - Asian
Place of birth - Born in state of residence (%) - Hispanic or Latino
Place of birth - Born in state of residence (%) - American Indian and Alaska Native
Place of birth - Born in state of residence (%) - Multirace
Place of birth - Born in state of residence (%) - Other Race
Place of birth - Born in other state (%)
Place of birth - Born in other state (%) - White
Place of birth - Born in other state (%) - Black or African American
Place of birth - Born in other state (%) - Asian
Place of birth - Born in other state (%) - Hispanic or Latino
Place of birth - Born in other state (%) - American Indian and Alaska Native
Place of birth - Born in other state (%) - Multirace
Place of birth - Born in other state (%) - Other Race
Place of birth - Native, outside of US (%)
Place of birth - Native, outside of US (%) - White
Place of birth - Native, outside of US (%) - Black or African American
Place of birth - Native, outside of US (%) - Asian
Place of birth - Native, outside of US (%) - Hispanic or Latino
Place of birth - Native, outside of US (%) - American Indian and Alaska Native
Place of birth - Native, outside of US (%) - Multirace
Place of birth - Native, outside of US (%) - Other Race
Place of birth - Foreign born (%)
Place of birth - Foreign born (%) - White
Place of birth - Foreign born (%) - Black or African American
Place of birth - Foreign born (%) - Asian
Place of birth - Foreign born (%) - Hispanic or Latino
Place of birth - Foreign born (%) - American Indian and Alaska Native
Place of birth - Foreign born (%) - Multirace
Place of birth - Foreign born (%) - Other Race
Residents speaking English at home (%)
Residents speaking English at home - Born in the United States (%)
Residents speaking English at home - Native, born elsewhere (%)
Residents speaking English at home - Foreign born (%)
Residents speaking Spanish at home (%)
Residents speaking Spanish at home - Born in the United States (%)
Residents speaking Spanish at home - Native, born elsewhere (%)
Residents speaking Spanish at home - Foreign born (%)
Residents speaking other language at home (%)
Residents speaking other language at home - Born in the United States (%)
Residents speaking other language at home - Native, born elsewhere (%)
Residents speaking other language at home - Foreign born (%)
Marital status - Never married (%)
Marital status - Now married (%)
Marital status - Separated (%)
Marital status - Widowed (%)
Marital status - Divorced (%)
Ancestries Reported - Arab (%)
Ancestries Reported - Czech (%)
Ancestries Reported - Danish (%)
Ancestries Reported - Dutch (%)
Ancestries Reported - English (%)
Ancestries Reported - French (%)
Ancestries Reported - French Canadian (%)
Ancestries Reported - German (%)
Ancestries Reported - Greek (%)
Ancestries Reported - Hungarian (%)
Ancestries Reported - Irish (%)
Ancestries Reported - Italian (%)
Ancestries Reported - Lithuanian (%)
Ancestries Reported - Norwegian (%)
Ancestries Reported - Polish (%)
Ancestries Reported - Portuguese (%)
Ancestries Reported - Russian (%)
Ancestries Reported - Scotch-Irish (%)
Ancestries Reported - Scottish (%)
Ancestries Reported - Slovak (%)
Ancestries Reported - Subsaharan African (%)
Ancestries Reported - Swedish (%)
Ancestries Reported - Swiss (%)
Ancestries Reported - Ukrainian (%)
Ancestries Reported - United States (%)
Ancestries Reported - Welsh (%)
Ancestries Reported - West Indian (%)
Ancestries Reported - Other (%)
Geographical mobility - Same house 1 year ago (%)
Geographical mobility - Same house 1 year ago (%) - White
Geographical mobility - Same house 1 year ago (%) - Black or African American
Geographical mobility - Same house 1 year ago (%) - Asian
Geographical mobility - Same house 1 year ago (%) - Hispanic or Latino
Geographical mobility - Same house 1 year ago (%) - American Indian and Alaska Native
Geographical mobility - Same house 1 year ago (%) - Multirace
Geographical mobility - Same house 1 year ago (%) - Other Race
Geographical mobility - Moved within same county (%)
Geographical mobility - Moved within same county (%) - White
Geographical mobility - Moved within same county (%) - Black or African American
Geographical mobility - Moved within same county (%) - Asian
Geographical mobility - Moved within same county (%) - Hispanic or Latino
Geographical mobility - Moved within same county (%) - American Indian and Alaska Native
Geographical mobility - Moved within same county (%) - Multirace
Geographical mobility - Moved within same county (%) - Other Race
Geographical mobility - Moved from different county within same state (%)
Geographical mobility - Moved from different county within same state (%) - White
Geographical mobility - Moved from different county within same state (%) - Black or African American
Geographical mobility - Moved from different county within same state (%) - Asian
Geographical mobility - Moved from different county within same state (%) - Hispanic or Latino
Geographical mobility - Moved from different county within same state (%) - American Indian and Alaska Native
Geographical mobility - Moved from different county within same state (%) - Multirace
Geographical mobility - Moved from different county within same state (%) - Other Race
Geographical mobility - Moved from different state (%)
Geographical mobility - Moved from different state (%) - White
Geographical mobility - Moved from different state (%) - Black or African American
Geographical mobility - Moved from different state (%) - Asian
Geographical mobility - Moved from different state (%) - Hispanic or Latino
Geographical mobility - Moved from different state (%) - American Indian and Alaska Native
Geographical mobility - Moved from different state (%) - Multirace
Geographical mobility - Moved from different state (%) - Other Race
Geographical mobility - Moved from abroad (%)
Geographical mobility - Moved from abroad (%) - White
Geographical mobility - Moved from abroad (%) - Black or African American
Geographical mobility - Moved from abroad (%) - Asian
Geographical mobility - Moved from abroad (%) - Hispanic or Latino
Geographical mobility - Moved from abroad (%) - American Indian and Alaska Native
Geographical mobility - Moved from abroad (%) - Multirace
Geographical mobility - Moved from abroad (%) - Other Race
Place of birth for the foreign-born population - Ireland (%)
Place of birth for the foreign-born population - Denmark (%)
Place of birth for the foreign-born population - Norway (%)
Place of birth for the foreign-born population - Sweden (%)
Place of birth for the foreign-born population - United Kingdom (%)
Place of birth for the foreign-born population - England (%)
Place of birth for the foreign-born population - Scotland (%)
Place of birth for the foreign-born population - Other Northern Europe (%)
Place of birth for the foreign-born population - Austria (%)
Place of birth for the foreign-born population - Belgium (%)
Place of birth for the foreign-born population - France (%)
Place of birth for the foreign-born population - Germany (%)
Place of birth for the foreign-born population - Netherlands (%)
Place of birth for the foreign-born population - Switzerland (%)
Place of birth for the foreign-born population - Other Western Europe (%)
Place of birth for the foreign-born population - Greece (%)
Place of birth for the foreign-born population - Italy (%)
Place of birth for the foreign-born population - Portugal (%)
Place of birth for the foreign-born population - Spain (%)
Place of birth for the foreign-born population - Other Southern Europe (%)
Place of birth for the foreign-born population - Albania (%)
Place of birth for the foreign-born population - Belarus (%)
Place of birth for the foreign-born population - Bosnia and Herzegovina (%)
Place of birth for the foreign-born population - Bulgaria (%)
Place of birth for the foreign-born population - Croatia (%)
Place of birth for the foreign-born population - Czechoslovakia (%)
Place of birth for the foreign-born population - Hungary (%)
Place of birth for the foreign-born population - Latvia (%)
Place of birth for the foreign-born population - Lithuania (%)
Place of birth for the foreign-born population - North Macedonia (Macedonia) (%)
Place of birth for the foreign-born population - Moldova (%)
Place of birth for the foreign-born population - Poland (%)
Place of birth for the foreign-born population - Romania (%)
Place of birth for the foreign-born population - Russia (%)
Place of birth for the foreign-born population - Serbia (%)
Place of birth for the foreign-born population - Ukraine (%)
Place of birth for the foreign-born population - Other Eastern Europe (%)
Place of birth for the foreign-born population - China (%)
Place of birth for the foreign-born population - Hong Kong (%)
Place of birth for the foreign-born population - Taiwan (%)
Place of birth for the foreign-born population - Japan (%)
Place of birth for the foreign-born population - Korea (%)
Place of birth for the foreign-born population - Other Eastern Asia (%)
Place of birth for the foreign-born population - Afghanistan (%)
Place of birth for the foreign-born population - Bangladesh (%)
Place of birth for the foreign-born population - India (%)
Place of birth for the foreign-born population - Iran (%)
Place of birth for the foreign-born population - Kazakhstan (%)
Place of birth for the foreign-born population - Nepal (%)
Place of birth for the foreign-born population - Pakistan (%)
Place of birth for the foreign-born population - Sri Lanka (%)
Place of birth for the foreign-born population - Uzbekistan (%)
Place of birth for the foreign-born population - Other South Central Asia (%)
Place of birth for the foreign-born population - Burma (%)
Place of birth for the foreign-born population - Cambodia (%)
Place of birth for the foreign-born population - Indonesia (%)
Place of birth for the foreign-born population - Laos (%)
Place of birth for the foreign-born population - Malaysia (%)
Place of birth for the foreign-born population - Philippines (%)
Place of birth for the foreign-born population - Singapore (%)
Place of birth for the foreign-born population - Thailand (%)
Place of birth for the foreign-born population - Vietnam (%)
Place of birth for the foreign-born population - Other South Eastern Asia (%)
Place of birth for the foreign-born population - Armenia (%)
Place of birth for the foreign-born population - Iraq (%)
Place of birth for the foreign-born population - Israel (%)
Place of birth for the foreign-born population - Jordan (%)
Place of birth for the foreign-born population - Kuwait (%)
Place of birth for the foreign-born population - Lebanon (%)
Place of birth for the foreign-born population - Saudi Arabia (%)
Place of birth for the foreign-born population - Syria (%)
Place of birth for the foreign-born population - Turkey (%)
Place of birth for the foreign-born population - Yemen (%)
Place of birth for the foreign-born population - Other Western Asia (%)
Place of birth for the foreign-born population - Eritrea (%)
Place of birth for the foreign-born population - Ethiopia (%)
Place of birth for the foreign-born population - Kenya (%)
Place of birth for the foreign-born population - Somalia (%)
Place of birth for the foreign-born population - Uganda (%)
Place of birth for the foreign-born population - Zimbabwe (%)
Place of birth for the foreign-born population - Other Eastern Africa (%)
Place of birth for the foreign-born population - Cameroon (%)
Place of birth for the foreign-born population - Congo (%)
Place of birth for the foreign-born population - Democratic Republic of Congo (Zaire) (%)
Place of birth for the foreign-born population - Other Middle Africa (%)
Place of birth for the foreign-born population - Egypt (%)
Place of birth for the foreign-born population - Morocco (%)
Place of birth for the foreign-born population - Sudan (%)
Place of birth for the foreign-born population - Other Northern Africa (%)
Place of birth for the foreign-born population - South Africa (%)
Place of birth for the foreign-born population - Other Southern Africa (%)
Place of birth for the foreign-born population - Cabo Verde (%)
Place of birth for the foreign-born population - Ghana (%)
Place of birth for the foreign-born population - Liberia (%)
Place of birth for the foreign-born population - Nigeria (%)
Place of birth for the foreign-born population - Senegal (%)
Place of birth for the foreign-born population - Sierra Leone (%)
Place of birth for the foreign-born population - Other Western Africa (%)
Place of birth for the foreign-born population - Australia (%)
Place of birth for the foreign-born population - New Zealand (%)
Place of birth for the foreign-born population - Fiji (%)
Place of birth for the foreign-born population - Micronesia (%)
Place of birth for the foreign-born population - Bahamas (%)
Place of birth for the foreign-born population - Barbados (%)
Place of birth for the foreign-born population - Cuba (%)
Place of birth for the foreign-born population - Dominica (%)
Place of birth for the foreign-born population - Dominican Republic (%)
Place of birth for the foreign-born population - Grenada (%)
Place of birth for the foreign-born population - Haiti (%)
Place of birth for the foreign-born population - Jamaica (%)
Place of birth for the foreign-born population - St. Vincent and the Grenadines (%)
Place of birth for the foreign-born population - Trinidad and Tobago (%)
Place of birth for the foreign-born population - West Indies (%)
Place of birth for the foreign-born population - Other Caribbean (%)
Place of birth for the foreign-born population - Belize (%)
Place of birth for the foreign-born population - Costa Rica (%)
Place of birth for the foreign-born population - El Salvador (%)
Place of birth for the foreign-born population - Guatemala (%)
Place of birth for the foreign-born population - Honduras (%)
Place of birth for the foreign-born population - Mexico (%)
Place of birth for the foreign-born population - Nicaragua (%)
Place of birth for the foreign-born population - Panama (%)
Place of birth for the foreign-born population - Other Central America (%)
Place of birth for the foreign-born population - Argentina (%)
Place of birth for the foreign-born population - Bolivia (%)
Place of birth for the foreign-born population - Brazil (%)
Place of birth for the foreign-born population - Chile (%)
Place of birth for the foreign-born population - Colombia (%)
Place of birth for the foreign-born population - Ecuador (%)
Place of birth for the foreign-born population - Guyana (%)
Place of birth for the foreign-born population - Peru (%)
Place of birth for the foreign-born population - Uruguay (%)
Place of birth for the foreign-born population - Venezuela (%)
Place of birth for the foreign-born population - Other South America (%)
Place of birth for the foreign-born population - Canada (%)
Place of birth for the foreign-born population - Other Northern America (%)
Place of birth for the foreign-born population - Other (%)
Latest news about races in Dunn, NC collected exclusively by city-data.com from local newspapers, TV, and radio stations
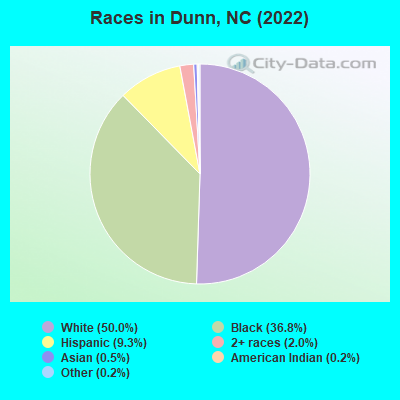
According to 2022 data, the most numerous races in Dunn, NC are White alone (4,408 residents), Black alone (3,244 residents), and Hispanic (816 residents). 93.3% of Dunn residents speak English at home. 4.8% of Dunn, NC residents are foreign-born (3.7% born in Latin America, 0.6% born in Asia), which is 68.2% less than the foreign-born rate of 8.0% across the entire state of North Carolina.
Race distribution in Dunn
2000 2022
5,647,155 70.2% White alone 1,723,301 21.4% Black alone 378,963 4.7% Hispanic 112,416 1.4% Asian alone 95,333 1.2% American Indian alone 79,965 1.0% Two or more races 9,015 0.1% Other race alone 3,165 0.04% Native Hawaiian and Other
6,497,519 60.7% White alone 2,155,650 20.1% Black alone 1,114,799 10.4% Hispanic 438,061 4.1% Two or more races 341,052 3.2% Asian alone 91,758 0.9% American Indian alone 50,180 0.5% Other race alone 9,954 0.09% Native Hawaiian and Other
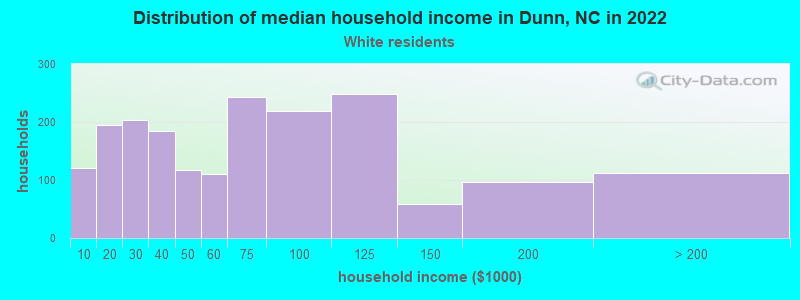
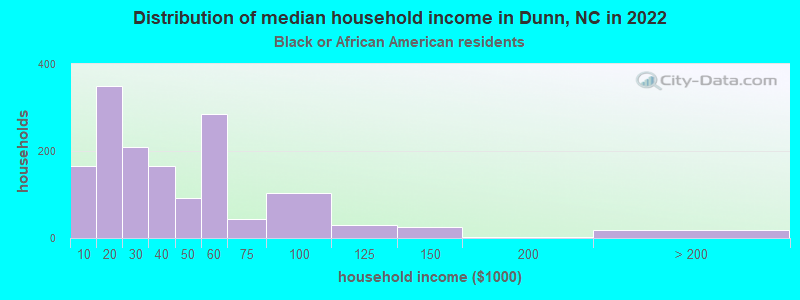
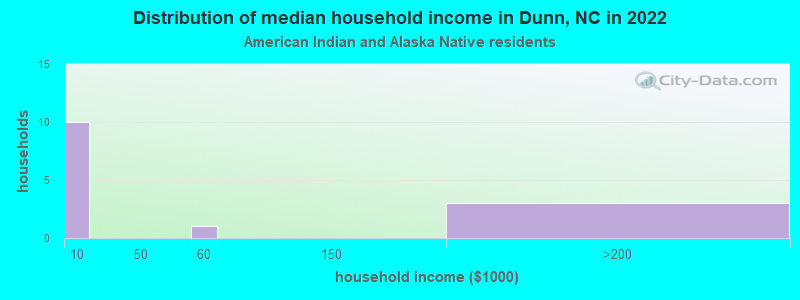
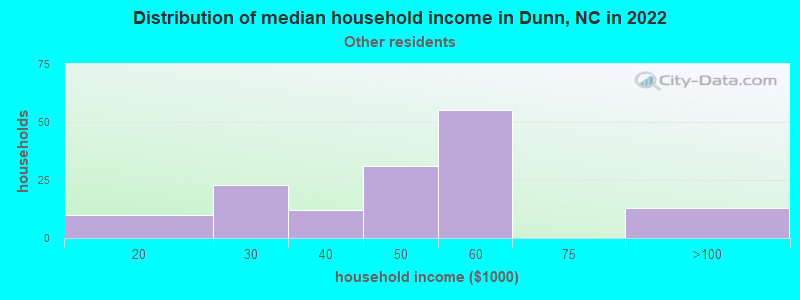
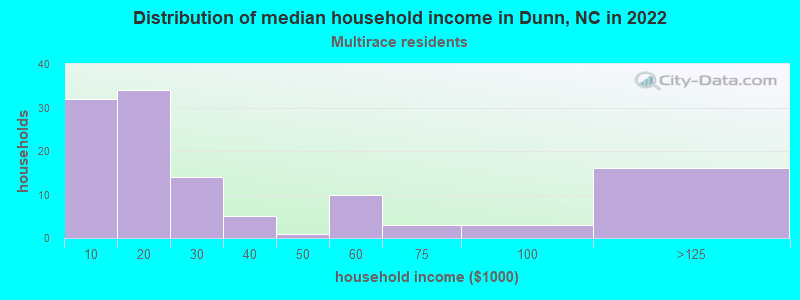
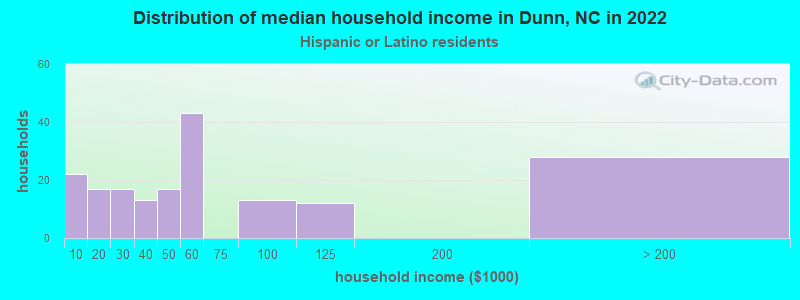
Income and house value in Dunn Median household income in 2022 $52,658 White non-Hispanic householders$26,218 Black householders$2,960 American Indian and Alaska Native householders$45,159 Some other race householders$51,017 Hispanic or Latino race householdersMedian 2022 house value $228,735 White Non-Hispanic householders$158,030 Black or African American householders$224,250 American Indian or Alaska Native householders $224,250 Asian householders$362,758 Two or more races householders
Median age by race in Dunn
53.6 Median age for White residents48.0 60.5 40.7 Median age for Black or African American residents35.4 44.0 61.6 Median age for American Indian / Alaska Native residents-668,604,650.5 -682,971,013.8 45.8 Median age for Asian residents-579,008,073.2 63.1 -864,385,297.0 Median age for Native Hawaiian / Pacific Islander residents-381,443,298.6 -857,142,856.3 17.2 Median age for Other race residents23.0 14.8 26.1 Median age for Two or more races residents29.3 28.2 56.6 Median age for White alone residents50.8 63.5 18.4 Median age for Hispanic or Latino residents20.3 17.0
Owner/renter occupied households by race in Dunn
House owners and renters - White residents 1,455 73.7% Owner occupied519 26.3% Renter occupiedHouse owners and renters - Black or African American residents 640 43.9% Owner occupied818 56.1% Renter occupiedHouse owners and renters - American Indian / Alaska Native residents 7 49.0% Owner occupied7 51.0% Renter occupiedHouse owners and renters - Asian residents 2 36.6% Owner occupied3 63.4% Renter occupiedHouse owners and renters - Other race residents 31 22.5% Owner occupied107 77.5% Renter occupiedHouse owners and renters - Two or more races residents 54 44.9% Owner occupied66 55.1% Renter occupiedHouse owners and renters - White alone residents 1,462 73.0% Owner occupied541 27.0% Renter occupiedHouse owners and renters - Hispanic or Latino residents 66 40.3% Owner occupied98 59.7% Renter occupied
Language usage in Dunn
English speakers - Total 93.3% of residents of Dunn speak English at home.
5.3% of residents speak Spanish at home 324 72.2% Speak English very well125 27.8% Speak English less than very well1.3% of residents speak other language at home 110 100.0% Speak English very well
English speakers - Born in the United States 94.6% of residents of Dunn speak English at home.
3.9% of residents speak Spanish at home 77 100.0% Speak English very well1.4% of residents speak other language at home 28 100.0% Speak English very well
English speakers - Native, born elsewhere 47.6% of residents of Dunn speak English at home.
50.0% of residents speak Spanish at home 30 48.4% Speak English very well32 51.6% Speak English less than very well4.0% of residents speak other language at home 5 100.0% Speak English very well
English speakers - Foreign-born 20.1% of residents of Dunn speak English at home.
77.8% of residents speak Spanish at home 245 72.9% Speak English very well91 27.1% Speak English less than very well4.9% of residents speak other language at home 21 100.0% Speak English very well
White (Caucasian) - Speak only English Native:
99.5% (4,334)Foreign-born:
50.2% (15)
White (Caucasian) - Speak another language Native:
1.1% (50)Foreign-born:
46.6% (14)
Black or African American - Speak only English Native:
98.5% (3,025)Foreign-born:
57.8% (13)
Black or African American - Speak another language Native:
1.5% (46)Foreign-born:
42.5% (10)
Asian - Speak another language Native:
100.0% (3)Foreign-born:
9.8% (4)
Other race - Speak only English Native:
52.0% (123)Foreign-born:
0.6% (2)
Other race - Speak another language Native:
52.6% (124)Foreign-born:
96.9% (346)
Two or more races - Speak another language Native:
10.3% (23)Foreign-born:
100.0% (29)
White alone - Speak only English Native:
98.2% (4,240)Foreign-born:
74.4% (16)
White alone - Speak another language Native:
2.0% (85)Foreign-born:
31.1% (7)
Hispanic or Latino - Speak only English Native:
79.4% (330)Foreign-born:
0.7% (2)
Hispanic or Latino - Speak another language Native:
30.2% (125)Foreign-born:
99.4% (311)
Foreign-born residents in Dunn 419 residents are foreign born (3.7% Latin America , 0.6% Asia ).
This city:
4.8%North Carolina:
8.3%
Marital status for residents in Dunn Marital status - White (Caucasian) population 15 years and over
Males 29.8% Never married51.5% Now married1.6% Separated3.1% Widowed13.9% DivorcedFemales 14.9% Never married43.8% Now married1.7% Separated25.0% Widowed14.7% DivorcedWomen who gave birth in the past 12 months Now married:
0.0% (0)Unmarried:
100.0% (6)
Women who did not give birth in the past 12 months Now married:
46.4% (289)Unmarried:
53.6% (334)
Marital status - Black or African American population 15 years and over
Males 49.6% Never married32.6% Now married6.4% Separated3.6% Widowed7.8% DivorcedFemales 49.3% Never married18.0% Now married8.9% Separated14.9% Widowed8.9% DivorcedWomen who gave birth in the past 12 months Now married:
36.2% (29)Unmarried:
63.7% (51)
Women who did not give birth in the past 12 months Now married:
17.0% (137)Unmarried:
83.0% (670)
Marital status - American Indian / Alaska Native population 15 years and over
Males 75.0% Never married0.0% Now married0.0% Separated0.0% Widowed25.0% DivorcedFemales 0.0% Never married83.3% Now married0.0% Separated0.0% Widowed16.7% DivorcedWomen who did not give birth in the past 12 months Now married:
0.0% (0)Unmarried:
100.0% (1)
Marital status - Asian population 15 years and over
Males 0.0% Never married100.0% Now married0.0% Separated0.0% Widowed0.0% DivorcedFemales 0.0% Never married100.0% Now married0.0% Separated0.0% Widowed0.0% DivorcedWomen who did not give birth in the past 12 months Now married:
100.0% (35)Unmarried:
0.0% (0)
Marital status - Other race population 15 years and over
Males 49.0% Never married51.0% Now married0.0% Separated0.0% Widowed0.0% DivorcedFemales 50.0% Never married20.0% Now married24.1% Separated0.0% Widowed5.9% DivorcedWomen who did not give birth in the past 12 months Now married:
30.9% (52)Unmarried:
69.1% (117)
Marital status - Two or more races population 15 years and over
Males 67.9% Never married19.2% Now married0.0% Separated0.0% Widowed12.8% DivorcedFemales 74.1% Never married4.5% Now married8.0% Separated9.8% Widowed3.6% DivorcedWomen who did not give birth in the past 12 months Now married:
11.5% (12)Unmarried:
88.5% (94)
Marital status - White alone, not Hispanic / Latino population 15 years and over
Males 29.8% Never married51.5% Now married1.6% Separated3.1% Widowed13.9% DivorcedFemales 14.9% Never married43.7% Now married1.7% Separated25.0% Widowed14.7% DivorcedWomen who gave birth in the past 12 months Now married:
0.0% (0)Unmarried:
100.0% (6)
Women who did not give birth in the past 12 months Now married:
46.2% (285)Unmarried:
53.8% (332)
Marital status - Hispanic or Latino population 15 years and over
Males 48.4% Never married50.5% Now married0.0% Separated0.0% Widowed1.1% DivorcedFemales 61.0% Never married19.1% Now married19.9% Separated0.0% Widowed0.0% DivorcedWomen who did not give birth in the past 12 months Now married:
30.8% (69)Unmarried:
69.2% (155)
Ancestries in Dunn
647 11.5% English539 9.6% American433 7.7% Irish154 2.7% German102 1.8% Scotch-Irish49 0.9% Scottish48 0.9% European35 0.6% Italian18 0.3% French17 0.3% British15 0.3% African14 0.2% Russian10 0.2% Polish10 0.2% Jamaican8 0.1% Afghan8 0.1% Hungarian7 0.1% Barbadian6 0.1% Welsh5 0.09% Canadian5 0.09% Danish5 0.09% Portuguese5 0.09% Swedish3 0.05% Celtic1 0.02% Finnish
Children Nativity (place of birth) in Dunn
Children under 6 years - Living with two parents Both parents native 150 100.0% Native0 0.0% Foreign-bornBoth parents foreign-born 7 28.5% Native18 71.5% Foreign-bornChildren under 6 years - Living with one parent Native parent 346 100.0% NativeForeign-born parent 34 100.0% NativeChildren 6 to 17 years - Living with two parents Both parents native 435 100.0% NativeBoth parents foreign-born 7 13.3% Native46 86.7% Foreign-bornOne native, one foreign-born parent 10 100.0% NativeChildren 6 to 17 years - Living with one parent Native parent 413 100.0% NativeForeign-born parent 62 58.4% Native44 41.6% Foreign-born
Grandparents responsible for own grandchildren in Dunn
Grandparents (30 to 59 years) White / Caucasian 7 39.9% Responsible for grandchildren11 60.1% Not responsible for grandchildrenBlack or African American 21 37.3% Responsible for grandchildren35 62.7% Not responsible for grandchildrenWhite alone, not Hispanic / Latino 8 44.1% Responsible for grandchildren10 55.9% Not responsible for grandchildrenGrandparents (60 years and over) White / Caucasian 23 100.0% Not responsible for grandchildrenBlack or African American 18 40.7% Responsible for grandchildren26 59.3% Not responsible for grandchildrenWhite alone, not Hispanic / Latino 24 100.0% Not responsible for grandchildren