Estimated zip code population in 2022: 6,650 Zip code population in 2010: 6,751 Zip code population in 2000: 6,652
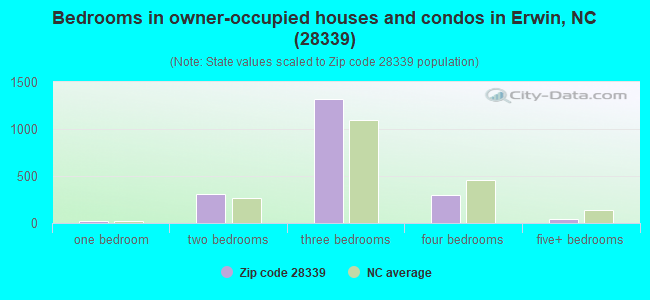
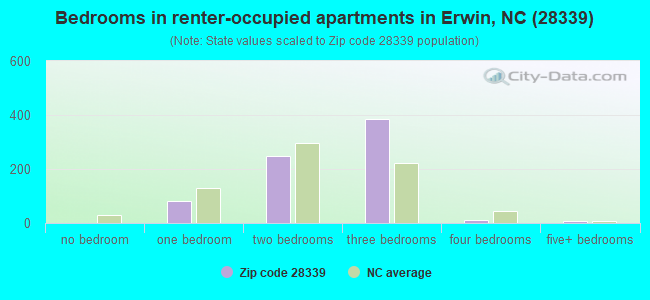
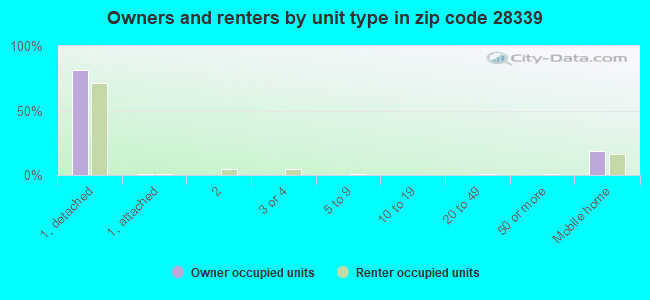
Houses and condos: 2,999 Renter-occupied apartments: 739
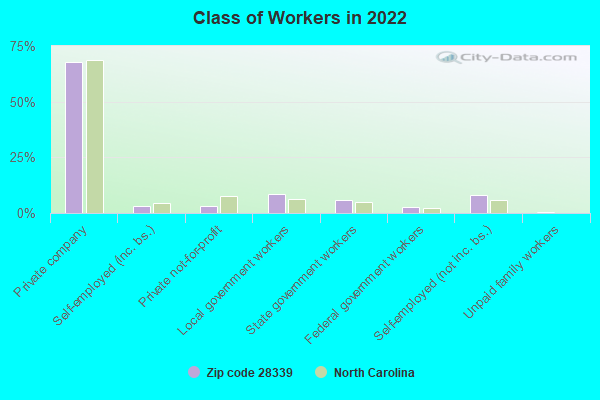
% of renters here:
27%
State:
33%
March 2022 cost of living index in zip code 28339: 80.8 (low, U.S. average is 100)
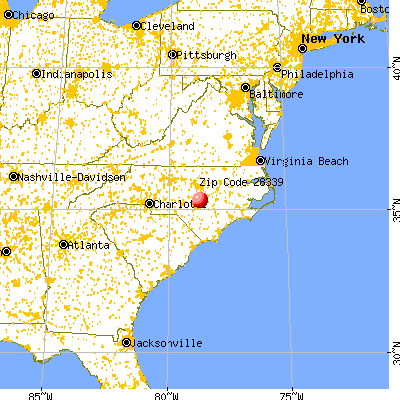
Land area: 35.8 sq. mi. Water area: 0.6 sq. mi.
Population density: 186 people per square mile
(very low).
OSM Map
General Map
Google Map
MSN Map
OSM Map
General Map
Google Map
MSN Map
OSM Map
General Map
Google Map
MSN Map
OSM Map
General Map
Google Map
MSN Map
Please wait while loading the map...
Real estate property taxes paid for housing units in 2022:
This zip code:
0.9% ($1,511)
North Carolina:
0.6% ($1,769)
Median real estate property taxes paid for housing units with mortgages in 2022: $1,664 (0.9%) Median real estate property taxes paid for housing units with no mortgage in 2022: $1,219 (1.1%)
Averages for the 2020 tax year for zip code 28339, filed in 2021:
Average Adjusted Gross Income (AGI) in 2020: $42,061 (Individual Income Tax Returns)
Here:
$42,061
State:
$70,020
Salary/wage: $38,703 (reported on 81.9% of returns)
Here:
$38,703
State:
$58,387
(% of AGI for various income ranges: 1139.5% for AGIs below $25k, 3872.4% for AGIs $25k-50k, 6855.7% for AGIs $50k-75k, 10082.7% for AGIs $75k-100k, 19067.3% for AGIs $100k-200k)
Taxable interest for individuals: $503 (reported on 21.0% of returns)
This zip code:
$503
North Carolina:
$1,479
(% of AGI for various income ranges: 8.2% for AGIs below $25k, 7.2% for AGIs $25k-50k, 23.9% for AGIs $50k-75k, 32.7% for AGIs $75k-100k, 59.1% for AGIs $100k-200k)
Ordinary dividends: $2,783 (reported on 7.4% of returns)
Here:
$2,783
State:
$7,888
(% of AGI for various income ranges: 8.0% for AGIs below $25k, 8.0% for AGIs $25k-50k, 36.1% for AGIs $50k-75k, 34.0% for AGIs $75k-100k, 320.9% for AGIs $100k-200k)
Net capital gain/loss in AGI: +$11,519 (reported on 6.8% of returns)
Here:
+$11,519
State:
+$23,652
(% of AGI for various income ranges: 5.6% for AGIs below $25k, 19.7% for AGIs $25k-50k, 42.1% for AGIs $50k-75k, 143.3% for AGIs $75k-100k, 1719.1% for AGIs $100k-200k)
Profit/loss from business: +$6,928 (reported on 15.2% of returns)
Here:
+$6,928
State:
+$11,710
(% of AGI for various income ranges: 156.2% for AGIs below $25k, 141.1% for AGIs $25k-50k, 69.3% for AGIs $50k-75k, 110.7% for AGIs $75k-100k, 330.0% for AGIs $100k-200k)
Taxable individual retirement arrangement distribution: $10,882 (reported on 7.1% of returns)
28339:
$10,882
North Carolina:
$20,247
(% of AGI for various income ranges: 31.5% for AGIs below $25k, 58.2% for AGIs $25k-50k, 177.1% for AGIs $50k-75k, 264.7% for AGIs $75k-100k, 708.2% for AGIs $100k-200k)
Total itemized deductions: $28,120 (reported on 3.2% of returns)
Here:
$28,120
State:
$34,549
(% of AGI for various income ranges: 93.0% for AGIs $25k-50k, 366.1% for AGIs $50k-75k, 1024.5% for AGIs $100k-200k)
Charity contributions: $8,944 (reported on 2.9% of returns)
Here:
$8,944
State:
$13,360
(% of AGI for various income ranges: 10.6% for AGIs below $25k, 92.5% for AGIs $50k-75k, 401.8% for AGIs $100k-200k)
Taxes paid: $5,870 (reported on 3.2% of returns)
28339:
$5,870
State:
$7,586
(% of AGI for various income ranges: 13.7% for AGIs $25k-50k, 70.0% for AGIs $50k-75k, 267.3% for AGIs $100k-200k)
Earned income credit: $2,308 (reported on 25.6% of returns)
Here:
$2,308
State:
$2,337
(% of AGI for various income ranges: 125.3% for AGIs below $25k, 83.8% for AGIs $25k-50k)
Percentage of individuals using paid preparers for their 2020 taxes: 92.9%
Here:
93%
State:
93%
(% for various income ranges: 92.2% for AGIs below $25k, 93.5% for AGIs $25k-50k, 92.5% for AGIs $50k-75k, 91.7% for AGIs $75k-100k, 95.2% for AGIs $100k-200k, 100.0% for AGIs over 200k)
Averages for the 2012 tax year for zip code 28339, filed in 2013:
Average Adjusted Gross Income (AGI) in 2012: $36,666 (Individual Income Tax Returns)
Here:
$36,666
State:
$54,937
Salary/wage: $33,391 (reported on 84.1% of returns)
Here:
$33,391
State:
$46,336
(% of AGI for various income ranges: 73.4% for AGIs below $25k, 83.3% for AGIs $25k-50k, 77.6% for AGIs $50k-75k, 78.6% for AGIs $75k-100k, 68.3% for AGIs $100k-200k)
Taxable interest for individuals: $824 (reported on 26.7% of returns)
This zip code:
$824
North Carolina:
$1,298
(% of AGI for various income ranges: 0.7% for AGIs below $25k, 0.3% for AGIs $25k-50k, 0.5% for AGIs $50k-75k, 0.4% for AGIs $75k-100k, 1.2% for AGIs $100k-200k)
Ordinary dividends: $2,017 (reported on 8.3% of returns)
Here:
$2,017
State:
$6,213
(% of AGI for various income ranges: 0.4% for AGIs below $25k, 0.4% for AGIs $25k-50k, 0.6% for AGIs $50k-75k, 0.1% for AGIs $75k-100k, 0.6% for AGIs $100k-200k)
Net capital gain/loss in AGI: +$540 (reported on 5.4% of returns)
Here:
+$540
State:
+$12,740
(% of AGI for various income ranges: 0.3% for AGIs $100k-200k)
Profit/loss from business: +$6,046 (reported on 14.8% of returns)
Here:
+$6,046
State:
+$10,311
(% of AGI for various income ranges: 7.5% for AGIs below $25k, 2.0% for AGIs $25k-50k, 2.0% for AGIs $50k-75k, 0.8% for AGIs $75k-100k, 0.5% for AGIs $100k-200k)
Taxable individual retirement arrangement distribution: $9,871 (reported on 7.6% of returns)
28339:
$9,871
North Carolina:
$15,575
(% of AGI for various income ranges: 2.1% for AGIs below $25k, 1.7% for AGIs $25k-50k, 2.5% for AGIs $50k-75k, 2.5% for AGIs $75k-100k, 1.6% for AGIs $100k-200k)
Total itemized deductions: $17,383 (25% of AGI, reported on 23.5% of returns)
Here:
$17,383
State:
$23,438
Here:
25.0% of AGI
State:
21.5% of AGI
(% of AGI for various income ranges: 7.1% for AGIs below $25k, 8.9% for AGIs $25k-50k, 11.5% for AGIs $50k-75k, 14.3% for AGIs $75k-100k, 14.6% for AGIs $100k-200k)
Charity contributions: $4,033 (reported on 19.9% of returns)
Here:
$4,033
State:
$4,687
(% of AGI for various income ranges: 1.4% for AGIs below $25k, 1.7% for AGIs $25k-50k, 2.0% for AGIs $50k-75k, 2.8% for AGIs $75k-100k, 3.2% for AGIs $100k-200k)
Taxes paid: $5,457 (reported on 23.5% of returns)
28339:
$5,457
State:
$8,823
(% of AGI for various income ranges: 1.2% for AGIs below $25k, 1.9% for AGIs $25k-50k, 3.2% for AGIs $50k-75k, 5.1% for AGIs $75k-100k, 6.5% for AGIs $100k-200k)
Earned income credit: $2,424 (reported on 29.6% of returns)
Here:
$2,424
State:
$2,376
(% of AGI for various income ranges: 9.2% for AGIs below $25k, 1.5% for AGIs $25k-50k)
Percentage of individuals using paid preparers for their 2012 taxes: 51.3%
Here:
51%
State:
53%
(% for various income ranges: 51.1% for AGIs below $25k, 45.3% for AGIs $25k-50k, 55.6% for AGIs $50k-75k, 58.8% for AGIs $75k-100k, 64.3% for AGIs $100k-200k)
Averages for the 2004 tax year for zip code 28339, filed in 2005:
Average Adjusted Gross Income (AGI) in 2004: $32,325 (Individual Income Tax Returns)
Here:
$32,325
State:
$45,376
Salary/wage: $30,704 (reported on 87.0% of returns)
Here:
$30,704
State:
$39,442
(% of AGI for various income ranges: 94.8% for AGIs below $10k, 81.8% for AGIs $10k-25k, 84.8% for AGIs $25k-50k, 86.6% for AGIs $50k-75k, 86.7% for AGIs $75k-100k, 66.3% for AGIs over 100k)
Taxable interest for individuals: $1,033 (reported on 31.7% of returns)
This zip code:
$1,033
North Carolina:
$1,515
(% of AGI for various income ranges: 2.7% for AGIs below $10k, 1.4% for AGIs $10k-25k, 1.3% for AGIs $25k-50k, 0.4% for AGIs $50k-75k, 0.4% for AGIs $75k-100k, 1.2% for AGIs over 100k)
Taxable dividends: $1,654 (reported on 9.6% of returns)
Here:
$1,654
State:
$4,016
(% of AGI for various income ranges: 1.4% for AGIs below $10k, 0.6% for AGIs $10k-25k, 0.3% for AGIs $25k-50k, 0.4% for AGIs $50k-75k, 0.0% for AGIs $75k-100k, 1.1% for AGIs over 100k)
Net capital gain/loss: +$7,000 (reported on 7.3% of returns)
Here:
+$7,000
State:
+$11,152
(% of AGI for various income ranges: -0.5% for AGIs below $10k, -0.0% for AGIs $10k-25k, 0.7% for AGIs $25k-50k, 1.0% for AGIs $50k-75k, 1.5% for AGIs $75k-100k, 6.6% for AGIs over 100k)
Profit/loss from business: +$3,162 (reported on 13.1% of returns)
Here:
+$3,162
State:
+$9,490
(% of AGI for various income ranges: 8.3% for AGIs below $10k, 2.4% for AGIs $10k-25k, 1.5% for AGIs $25k-50k, 0.0% for AGIs $50k-75k, -0.3% for AGIs $75k-100k, 1.6% for AGIs over 100k)
IRA payment deduction: $3,258 (reported on 1.2% of returns)
28339:
$3,258
North Carolina:
$2,967
Total itemized deductions: $15,435 (26% of AGI, reported on 28.1% of returns)
Here:
$15,435
State:
$19,464
Here:
25.8% of AGI
State:
22.7% of AGI
(% of AGI for various income ranges: 9.0% for AGIs below $10k, 8.4% for AGIs $10k-25k, 12.6% for AGIs $25k-50k, 14.5% for AGIs $50k-75k, 17.0% for AGIs $75k-100k, 16.6% for AGIs over 100k)
Charity contributions deductions: $3,461 (6% of AGI, reported on 24.7% of returns)
Here:
$3,461
State:
$4,035
Here:
5.6% of AGI
State:
4.5% of AGI
(% of AGI for various income ranges: 1.0% for AGIs below $10k, 1.3% for AGIs $10k-25k, 2.3% for AGIs $25k-50k, 2.7% for AGIs $50k-75k, 3.3% for AGIs $75k-100k, 4.5% for AGIs over 100k)
Total tax: $3,810 (reported on 65.9% of returns)
28339:
$3,810
State:
$7,257
(% of AGI for various income ranges: 2.5% for AGIs below $10k, 3.0% for AGIs $10k-25k, 5.8% for AGIs $25k-50k, 8.1% for AGIs $50k-75k, 9.8% for AGIs $75k-100k, 15.6% for AGIs over 100k)
Earned income credit: $1,808 (reported on 28.4% of returns)
Here:
$1,808
State:
$1,851
Percentage of individuals using paid preparers for their 2004 taxes: 69.8%
Here:
70%
State:
62%
(% for various income ranges: 69.5% for AGIs below $10k, 71.0% for AGIs $10k-25k, 69.9% for AGIs $25k-50k, 67.8% for AGIs $50k-75k, 66.9% for AGIs $75k-100k, 71.4% for AGIs over 100k)
Household received Food Stamps/SNAP in the past 12 months: 655 Household did not receive Food Stamps/SNAP in the past 12 months: 2,104
Women who had a birth in the past 12 months: 47 (26 now married, 20 unmarried) Women who did not have a birth in the past 12 months: 1,666 (569 now married, 1,093 unmarried)
Housing units in zip code 28339 with a mortgage: 1,200 (93 second mortgage, 98 both second mortgage and home equity loan) Houses without a mortgage: 31
Median monthly owner costs for units with a mortgage: $1,163 Median monthly owner costs for units without a mortgage: $490
Residents with income below the poverty level in 2022:
This zip code:
15.5%
Whole state:
12.8%
Residents with income below 50% of the poverty level in 2022:
This zip code:
9.9%
Whole state:
6.8%
Median number of rooms in houses and condos:
Here:
5.9
State:
6.4
Median number of rooms in apartments:
Here:
5.0
State:
4.4
Notable locations in this zip code not listed on our city pages
Churches in zip code 28339 include: Linden Chapel (A), Bethel Church (B), West M Street Pentecostal Church (C), Saint Stephens Episcopal Church (D), First Free Will Baptist Church (E), First Baptist Church of Erwin (F), Erwin United Methodist Church (G), Erwin Presbyterian Church (H), Erwin Church of God (I). Display/hide their locations on the map
Streams, rivers, and creeks: Fairy Fair (A), Anderson Creek (B), Williams Swamp (C), Thorntons Creek (D), Little River (E), Stewarts Creek (F), Stewart Creek (G), Juniper Creek (H). Display/hide their locations on the map
703 married couples with children.
481 single-parent households (65 men, 416 women).
89.8% of residents of 28339 zip code speak English at home.
7.7% of residents speak Spanish at home (32% very well, 12% well, 39% not well, 18% not at all).
2.2% of residents speak other Indo-European language at home (100% very well).
0.2% of residents speak Asian or Pacific Island language at home (100% very well).
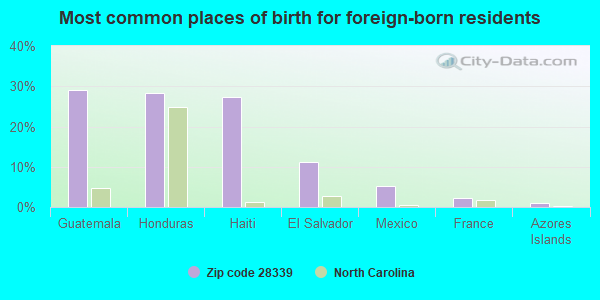
Foreign born population: 540 (8.1%) (36.7% of them are naturalized citizens)
This zip code:
8.1%
Whole state:
8.6%
29%Guatemala
28%Honduras
27%Haiti
11%El Salvador
5%Mexico
2%France
1%Azores Islands
14%American
7%English
7%Irish
4%Jamaican
2%Italian
2%Scottish
2%German
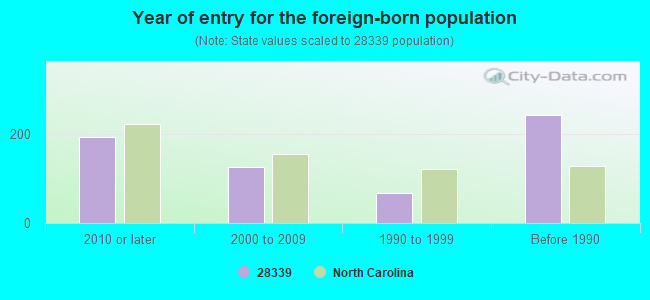
Year of entry for the foreign-born population
1932010 or later
1252000 to 2009
671990 to 1999
243Before 1990
Facilities with environmental interests located in this zip code:
CHASE ENVIRONMENTAL INC (305 MASON DR in ERWIN, NC)
Conditionally Exempt Small Quantity Generators, less than 100 kg/month of hazardous waste (Resource Conservation and Recovery Act (tracking hazardous waste)) TRANSPORTER (Resource Conservation and Recovery Act (tracking hazardous waste)) USED OIL PROGRAM (Resource Conservation and Recovery Act (tracking hazardous waste)) Organizations: KIMBERLY NICOLE DAY (CONTACT/OWNER)
Housing units lacking complete plumbing facilities: 4.7% Housing units lacking complete kitchen facilities: 2.4%
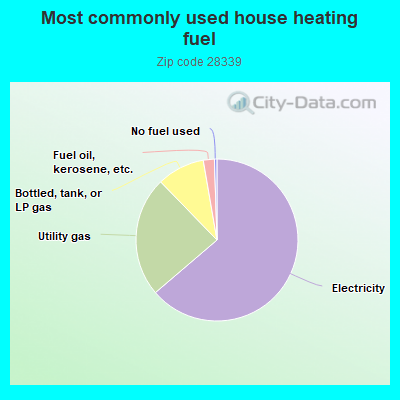
63.5%Electricity
23.9%Utility gas
9.5%Bottled, tank, or LP gas
2.2%Fuel oil, kerosene, etc.
0.5%No fuel used
Population in 1990: 5,574. Population change in the 1990s: +1,078 (+19.3%).
Place of birth for U.S.-born residents:
This state: 4,807
Northeast: 393
Midwest: 167
South: 434
West: 158
59% of the 28339 zip code residents lived in the same house 5 years ago. Out of people who lived in different houses, 60% lived in this county. Out of people who lived in different counties, 50% lived in North Carolina.
93% of the 28339 zip code residents lived in the same house 1 year ago. Out of people who lived in different houses, 50% moved from this county. Out of people who lived in different houses, 30% moved from different county within same state. Out of people who lived in different houses, 13% moved from different state. Out of people who lived in different houses, 11% moved from abroad.
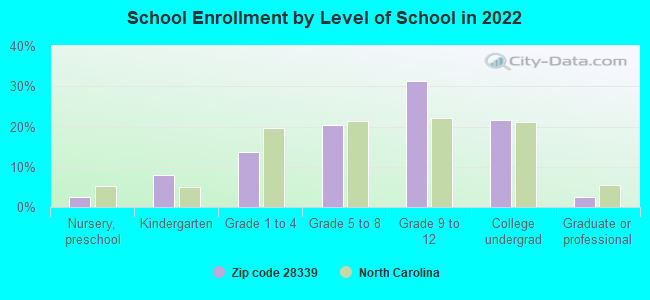
Private vs. public school enrollment:
Students in private schools in grades 1 to 8 (elementary and middle school): 45
Here:
10.6%
North Carolina:
13.8%
Students in private schools in grades 9 to 12 (high school):
Here:
0.0%
North Carolina:
11.9%
Students in private undergraduate colleges: 21
Here:
7.7%
North Carolina:
19.3%
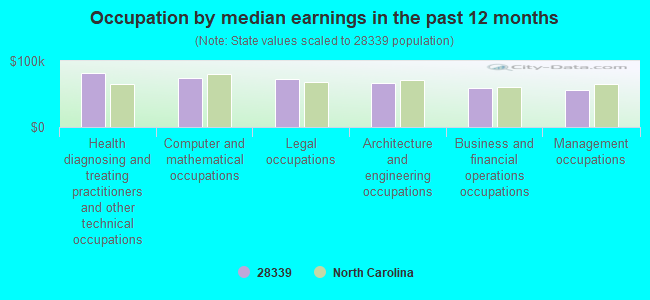
Occupation by median earnings in the past 12 months ($)
81,967Health diagnosing and treating practitioners and other technical occupations
74,534Computer and mathematical occupations
72,500Legal occupations
65,918Architecture and engineering occupations
59,704Business and financial operations occupations
56,568Management occupations
Companies with federal contracts located in this zip code (ERWIN, NC):
BLOCK MANAGEMENT, INC. (100 MOORE ST; small business) : $11,965,911 in 63 contractsfrom 1999 to 2006
Contracts for Guard Services, Lease or Rental of Equipment -- Household and Commercial Furnishings and Appliances, Lease or Rental of Equipment -- Service and Trade Equipment by National Institutes of Health, Army, Navy Signed by year:2000: $1,169,127; 2001: $1,818,897; 2002: $1,949,338; 2003: $1,638,687; 2004: $1,967,665; 2005: $887,171; 2006: $1,092,762.
Biggest contracts:
$1,255,000 with National Institutes of Health for Guard Services. Signed on 2002-01-15. Completion date: 2002-12-15.
$1,042,347, same as above.Signed on 2004-01-09. Effective on 2004-01-01. Completion date: 2004-12-31.
$982,685, same as above.Signed on 2003-01-15. Completion date: 2003-12-15.
$897,000, same as above.Signed on 2001-01-15. Completion date: 2001-12-15.
MANNING, INC (209 WEST E STREET; small business) : $280,650 in 4 contractsfrom 2000 to 2002
$99,800 with Army for Maintenance, Repair or Alteration of Real Property -- Office Buildings. Signed on 2002-08-08. Completion date: 2002-12-20.
$97,500 with Army for Construction of Structures and Facilities -- Sewage and Waste Facilities. Signed on 2000-01-07. Completion date: 2000-05-31.
$51,000 with Army for Maintenance, Repair or Alteration of Real Property -- Troop Housing Facilities. Signed on 2000-09-26. Completion date: 2000-10-27.
$32,350 with Army for Maintenance, Repair or Alteration of Real Property -- Office Buildings. Signed on 2000-09-23. Completion date: 2000-11-17.
INDOOR COMFORT (1953 OLD STAGE RD. SOUTH; small business) : $27,450 in 2 contractsin 2000
$16,950 with Army for Maintenance, Repair or Alteration of Real Property -- Office Buildings. Signed on 2000-09-23. Completion date: 2000-10-27.
$10,500, same as above.Signed on 2000-08-11. Completion date: 2000-08-15.
FAIRCLOTH, FREDDIE (1105 W E ST; small business)
$3,382 with Army for Miscellaneous Prefabricated Structures. Signed on 2006-04-04. Completion date: 2006-04-27.
Top industries in this zip code by the number of employees in 2005:
Health Care and Social Assistance: General Medical and Surgical Hospitals (250-499 employees: 1 establishment)
Construction: Drywall and Insulation Contractors (50-99: 1, 1-4: 1)
Real Estate and Rental and Leasing: Residential Property Managers (20-49: 1)
Other Services (except Public Administration): Religious Organizations (10-19: 1, 5-9: 2, 1-4: 2)
Health Care and Social Assistance: Offices of Optometrists (20-49: 1)
People in group quarters in 2010:
98 people in nursing facilities/skilled-nursing facilities
11 people in group homes intended for adults
10 people in workers' group living quarters and job corps centers
People in group quarters in 2000:
16 people in other noninstitutional group quarters
Fatal accident statistics in 2014:
Fatal accident count: 1
Vehicles involved in fatal accidents: 1
Fatal accidents caused by drunken drivers: 1
Fatalities: 1
Persons involved in fatal accidents: 6
Pedestrians involved in fatal accidents: 0
Fatal accident statistics in 2013:
Fatal accident count: 1
Vehicles involved in fatal accidents: 1
Fatal accidents caused by drunken drivers: 1
Fatalities: 1
Persons involved in fatal accidents: 2
Pedestrians involved in fatal accidents: 0
2002 - 2018 National Fire Incident Reporting System (NFIRS) incidents
Based on the data from the years 2002 - 2018 the average number of fires per year is 83. The highest number of fire incidents - 130 took place in 2006, and the least - 39 in 2013. The data has a decreasing trend.
When looking into fire subcategories, the most reports belonged to: Structure Fires (45.0%), and Outside Fires (40.9%).
Fire incident types reported to NFIRS in Zip Code 28339


 Nearest zip codes: 28356, 28323, 27521, 28342, 27546, 28334.


 Based on the data from the years 2002 - 2018 the average number of fires per year is 83. The highest number of fire incidents - 130 took place in 2006, and the least - 39 in 2013. The data has a decreasing trend.
 When looking into fire subcategories, the most reports belonged to: Structure Fires (45.0%), and Outside Fires (40.9%).