Races in Butner, North Carolina (NC) Detailed Stats
Data:
Races - White alone (%)
Races - White alone (% change since 2000)
Races - Black alone (%)
Races - Black alone (% change since 2000)
Races - American Indian alone (%)
Races - American Indian alone (% change since 2000)
Races - Asian alone (%)
Races - Asian alone (% change since 2000)
Races - Hispanic (%)
Races - Hispanic (% change since 2000)
Races - Native Hawaiian and Other Pacific Islander alone (%)
Races - Native Hawaiian and Other Pacific Islander alone (% change since 2000)
Races - Two or more races(%)
Races - Two or more races(% change since 2000)
Races - Other race alone (%)
Races - Other race alone (% change since 2000)
Racial diversity
Place of birth - Born in state of residence (%)
Place of birth - Born in state of residence (%) - White
Place of birth - Born in state of residence (%) - Black or African American
Place of birth - Born in state of residence (%) - Asian
Place of birth - Born in state of residence (%) - Hispanic or Latino
Place of birth - Born in state of residence (%) - American Indian and Alaska Native
Place of birth - Born in state of residence (%) - Multirace
Place of birth - Born in state of residence (%) - Other Race
Place of birth - Born in other state (%)
Place of birth - Born in other state (%) - White
Place of birth - Born in other state (%) - Black or African American
Place of birth - Born in other state (%) - Asian
Place of birth - Born in other state (%) - Hispanic or Latino
Place of birth - Born in other state (%) - American Indian and Alaska Native
Place of birth - Born in other state (%) - Multirace
Place of birth - Born in other state (%) - Other Race
Place of birth - Native, outside of US (%)
Place of birth - Native, outside of US (%) - White
Place of birth - Native, outside of US (%) - Black or African American
Place of birth - Native, outside of US (%) - Asian
Place of birth - Native, outside of US (%) - Hispanic or Latino
Place of birth - Native, outside of US (%) - American Indian and Alaska Native
Place of birth - Native, outside of US (%) - Multirace
Place of birth - Native, outside of US (%) - Other Race
Place of birth - Foreign born (%)
Place of birth - Foreign born (%) - White
Place of birth - Foreign born (%) - Black or African American
Place of birth - Foreign born (%) - Asian
Place of birth - Foreign born (%) - Hispanic or Latino
Place of birth - Foreign born (%) - American Indian and Alaska Native
Place of birth - Foreign born (%) - Multirace
Place of birth - Foreign born (%) - Other Race
Residents speaking English at home (%)
Residents speaking English at home - Born in the United States (%)
Residents speaking English at home - Native, born elsewhere (%)
Residents speaking English at home - Foreign born (%)
Residents speaking Spanish at home (%)
Residents speaking Spanish at home - Born in the United States (%)
Residents speaking Spanish at home - Native, born elsewhere (%)
Residents speaking Spanish at home - Foreign born (%)
Residents speaking other language at home (%)
Residents speaking other language at home - Born in the United States (%)
Residents speaking other language at home - Native, born elsewhere (%)
Residents speaking other language at home - Foreign born (%)
Marital status - Never married (%)
Marital status - Now married (%)
Marital status - Separated (%)
Marital status - Widowed (%)
Marital status - Divorced (%)
Ancestries Reported - Arab (%)
Ancestries Reported - Czech (%)
Ancestries Reported - Danish (%)
Ancestries Reported - Dutch (%)
Ancestries Reported - English (%)
Ancestries Reported - French (%)
Ancestries Reported - French Canadian (%)
Ancestries Reported - German (%)
Ancestries Reported - Greek (%)
Ancestries Reported - Hungarian (%)
Ancestries Reported - Irish (%)
Ancestries Reported - Italian (%)
Ancestries Reported - Lithuanian (%)
Ancestries Reported - Norwegian (%)
Ancestries Reported - Polish (%)
Ancestries Reported - Portuguese (%)
Ancestries Reported - Russian (%)
Ancestries Reported - Scotch-Irish (%)
Ancestries Reported - Scottish (%)
Ancestries Reported - Slovak (%)
Ancestries Reported - Subsaharan African (%)
Ancestries Reported - Swedish (%)
Ancestries Reported - Swiss (%)
Ancestries Reported - Ukrainian (%)
Ancestries Reported - United States (%)
Ancestries Reported - Welsh (%)
Ancestries Reported - West Indian (%)
Ancestries Reported - Other (%)
Geographical mobility - Same house 1 year ago (%)
Geographical mobility - Same house 1 year ago (%) - White
Geographical mobility - Same house 1 year ago (%) - Black or African American
Geographical mobility - Same house 1 year ago (%) - Asian
Geographical mobility - Same house 1 year ago (%) - Hispanic or Latino
Geographical mobility - Same house 1 year ago (%) - American Indian and Alaska Native
Geographical mobility - Same house 1 year ago (%) - Multirace
Geographical mobility - Same house 1 year ago (%) - Other Race
Geographical mobility - Moved within same county (%)
Geographical mobility - Moved within same county (%) - White
Geographical mobility - Moved within same county (%) - Black or African American
Geographical mobility - Moved within same county (%) - Asian
Geographical mobility - Moved within same county (%) - Hispanic or Latino
Geographical mobility - Moved within same county (%) - American Indian and Alaska Native
Geographical mobility - Moved within same county (%) - Multirace
Geographical mobility - Moved within same county (%) - Other Race
Geographical mobility - Moved from different county within same state (%)
Geographical mobility - Moved from different county within same state (%) - White
Geographical mobility - Moved from different county within same state (%) - Black or African American
Geographical mobility - Moved from different county within same state (%) - Asian
Geographical mobility - Moved from different county within same state (%) - Hispanic or Latino
Geographical mobility - Moved from different county within same state (%) - American Indian and Alaska Native
Geographical mobility - Moved from different county within same state (%) - Multirace
Geographical mobility - Moved from different county within same state (%) - Other Race
Geographical mobility - Moved from different state (%)
Geographical mobility - Moved from different state (%) - White
Geographical mobility - Moved from different state (%) - Black or African American
Geographical mobility - Moved from different state (%) - Asian
Geographical mobility - Moved from different state (%) - Hispanic or Latino
Geographical mobility - Moved from different state (%) - American Indian and Alaska Native
Geographical mobility - Moved from different state (%) - Multirace
Geographical mobility - Moved from different state (%) - Other Race
Geographical mobility - Moved from abroad (%)
Geographical mobility - Moved from abroad (%) - White
Geographical mobility - Moved from abroad (%) - Black or African American
Geographical mobility - Moved from abroad (%) - Asian
Geographical mobility - Moved from abroad (%) - Hispanic or Latino
Geographical mobility - Moved from abroad (%) - American Indian and Alaska Native
Geographical mobility - Moved from abroad (%) - Multirace
Geographical mobility - Moved from abroad (%) - Other Race
Place of birth for the foreign-born population - Ireland (%)
Place of birth for the foreign-born population - Denmark (%)
Place of birth for the foreign-born population - Norway (%)
Place of birth for the foreign-born population - Sweden (%)
Place of birth for the foreign-born population - United Kingdom (%)
Place of birth for the foreign-born population - England (%)
Place of birth for the foreign-born population - Scotland (%)
Place of birth for the foreign-born population - Other Northern Europe (%)
Place of birth for the foreign-born population - Austria (%)
Place of birth for the foreign-born population - Belgium (%)
Place of birth for the foreign-born population - France (%)
Place of birth for the foreign-born population - Germany (%)
Place of birth for the foreign-born population - Netherlands (%)
Place of birth for the foreign-born population - Switzerland (%)
Place of birth for the foreign-born population - Other Western Europe (%)
Place of birth for the foreign-born population - Greece (%)
Place of birth for the foreign-born population - Italy (%)
Place of birth for the foreign-born population - Portugal (%)
Place of birth for the foreign-born population - Spain (%)
Place of birth for the foreign-born population - Other Southern Europe (%)
Place of birth for the foreign-born population - Albania (%)
Place of birth for the foreign-born population - Belarus (%)
Place of birth for the foreign-born population - Bosnia and Herzegovina (%)
Place of birth for the foreign-born population - Bulgaria (%)
Place of birth for the foreign-born population - Croatia (%)
Place of birth for the foreign-born population - Czechoslovakia (%)
Place of birth for the foreign-born population - Hungary (%)
Place of birth for the foreign-born population - Latvia (%)
Place of birth for the foreign-born population - Lithuania (%)
Place of birth for the foreign-born population - North Macedonia (Macedonia) (%)
Place of birth for the foreign-born population - Moldova (%)
Place of birth for the foreign-born population - Poland (%)
Place of birth for the foreign-born population - Romania (%)
Place of birth for the foreign-born population - Russia (%)
Place of birth for the foreign-born population - Serbia (%)
Place of birth for the foreign-born population - Ukraine (%)
Place of birth for the foreign-born population - Other Eastern Europe (%)
Place of birth for the foreign-born population - China (%)
Place of birth for the foreign-born population - Hong Kong (%)
Place of birth for the foreign-born population - Taiwan (%)
Place of birth for the foreign-born population - Japan (%)
Place of birth for the foreign-born population - Korea (%)
Place of birth for the foreign-born population - Other Eastern Asia (%)
Place of birth for the foreign-born population - Afghanistan (%)
Place of birth for the foreign-born population - Bangladesh (%)
Place of birth for the foreign-born population - India (%)
Place of birth for the foreign-born population - Iran (%)
Place of birth for the foreign-born population - Kazakhstan (%)
Place of birth for the foreign-born population - Nepal (%)
Place of birth for the foreign-born population - Pakistan (%)
Place of birth for the foreign-born population - Sri Lanka (%)
Place of birth for the foreign-born population - Uzbekistan (%)
Place of birth for the foreign-born population - Other South Central Asia (%)
Place of birth for the foreign-born population - Burma (%)
Place of birth for the foreign-born population - Cambodia (%)
Place of birth for the foreign-born population - Indonesia (%)
Place of birth for the foreign-born population - Laos (%)
Place of birth for the foreign-born population - Malaysia (%)
Place of birth for the foreign-born population - Philippines (%)
Place of birth for the foreign-born population - Singapore (%)
Place of birth for the foreign-born population - Thailand (%)
Place of birth for the foreign-born population - Vietnam (%)
Place of birth for the foreign-born population - Other South Eastern Asia (%)
Place of birth for the foreign-born population - Armenia (%)
Place of birth for the foreign-born population - Iraq (%)
Place of birth for the foreign-born population - Israel (%)
Place of birth for the foreign-born population - Jordan (%)
Place of birth for the foreign-born population - Kuwait (%)
Place of birth for the foreign-born population - Lebanon (%)
Place of birth for the foreign-born population - Saudi Arabia (%)
Place of birth for the foreign-born population - Syria (%)
Place of birth for the foreign-born population - Turkey (%)
Place of birth for the foreign-born population - Yemen (%)
Place of birth for the foreign-born population - Other Western Asia (%)
Place of birth for the foreign-born population - Eritrea (%)
Place of birth for the foreign-born population - Ethiopia (%)
Place of birth for the foreign-born population - Kenya (%)
Place of birth for the foreign-born population - Somalia (%)
Place of birth for the foreign-born population - Uganda (%)
Place of birth for the foreign-born population - Zimbabwe (%)
Place of birth for the foreign-born population - Other Eastern Africa (%)
Place of birth for the foreign-born population - Cameroon (%)
Place of birth for the foreign-born population - Congo (%)
Place of birth for the foreign-born population - Democratic Republic of Congo (Zaire) (%)
Place of birth for the foreign-born population - Other Middle Africa (%)
Place of birth for the foreign-born population - Egypt (%)
Place of birth for the foreign-born population - Morocco (%)
Place of birth for the foreign-born population - Sudan (%)
Place of birth for the foreign-born population - Other Northern Africa (%)
Place of birth for the foreign-born population - South Africa (%)
Place of birth for the foreign-born population - Other Southern Africa (%)
Place of birth for the foreign-born population - Cabo Verde (%)
Place of birth for the foreign-born population - Ghana (%)
Place of birth for the foreign-born population - Liberia (%)
Place of birth for the foreign-born population - Nigeria (%)
Place of birth for the foreign-born population - Senegal (%)
Place of birth for the foreign-born population - Sierra Leone (%)
Place of birth for the foreign-born population - Other Western Africa (%)
Place of birth for the foreign-born population - Australia (%)
Place of birth for the foreign-born population - New Zealand (%)
Place of birth for the foreign-born population - Fiji (%)
Place of birth for the foreign-born population - Micronesia (%)
Place of birth for the foreign-born population - Bahamas (%)
Place of birth for the foreign-born population - Barbados (%)
Place of birth for the foreign-born population - Cuba (%)
Place of birth for the foreign-born population - Dominica (%)
Place of birth for the foreign-born population - Dominican Republic (%)
Place of birth for the foreign-born population - Grenada (%)
Place of birth for the foreign-born population - Haiti (%)
Place of birth for the foreign-born population - Jamaica (%)
Place of birth for the foreign-born population - St. Vincent and the Grenadines (%)
Place of birth for the foreign-born population - Trinidad and Tobago (%)
Place of birth for the foreign-born population - West Indies (%)
Place of birth for the foreign-born population - Other Caribbean (%)
Place of birth for the foreign-born population - Belize (%)
Place of birth for the foreign-born population - Costa Rica (%)
Place of birth for the foreign-born population - El Salvador (%)
Place of birth for the foreign-born population - Guatemala (%)
Place of birth for the foreign-born population - Honduras (%)
Place of birth for the foreign-born population - Mexico (%)
Place of birth for the foreign-born population - Nicaragua (%)
Place of birth for the foreign-born population - Panama (%)
Place of birth for the foreign-born population - Other Central America (%)
Place of birth for the foreign-born population - Argentina (%)
Place of birth for the foreign-born population - Bolivia (%)
Place of birth for the foreign-born population - Brazil (%)
Place of birth for the foreign-born population - Chile (%)
Place of birth for the foreign-born population - Colombia (%)
Place of birth for the foreign-born population - Ecuador (%)
Place of birth for the foreign-born population - Guyana (%)
Place of birth for the foreign-born population - Peru (%)
Place of birth for the foreign-born population - Uruguay (%)
Place of birth for the foreign-born population - Venezuela (%)
Place of birth for the foreign-born population - Other South America (%)
Place of birth for the foreign-born population - Canada (%)
Place of birth for the foreign-born population - Other Northern America (%)
Place of birth for the foreign-born population - Other (%)
Latest news about races in Butner, NC collected exclusively by city-data.com from local newspapers, TV, and radio stations
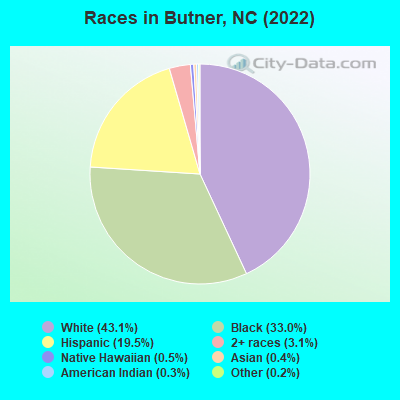
According to 2022 data, the most numerous races in Butner, NC are White alone (3,687 residents), Black alone (2,821 residents), and Hispanic (1,665 residents). 81.4% of Butner residents speak English at home. 11.0% of Butner, NC residents are foreign-born (8.8% born in Latin America, 1.5% born in North America), which is 27.4% greater than the foreign-born rate of 8.0% across the entire state of North Carolina.
Race distribution in Butner
2000 2022
5,647,155 70.2% White alone 1,723,301 21.4% Black alone 378,963 4.7% Hispanic 112,416 1.4% Asian alone 95,333 1.2% American Indian alone 79,965 1.0% Two or more races 9,015 0.1% Other race alone 3,165 0.04% Native Hawaiian and Other
6,497,519 60.7% White alone 2,155,650 20.1% Black alone 1,114,799 10.4% Hispanic 438,061 4.1% Two or more races 341,052 3.2% Asian alone 91,758 0.9% American Indian alone 50,180 0.5% Other race alone 9,954 0.09% Native Hawaiian and Other
Income and house value in Butner Median household income in 2022 $70,647 White non-Hispanic householders$90,549 Black householders$48,486 Some other race householders$79,664 Two or more races householders$47,703 Hispanic or Latino race householdersMedian 2022 house value $258,092 White Non-Hispanic householders$227,062 Black or African American householders $209,330 Asian householders$252,427 Some other race householders
Median age by race in Butner
48.8 Median age for White residents48.7 48.9 42.0 Median age for Black or African American residents39.8 50.3 24.6 Median age for American Indian / Alaska Native residents-668,604,650.5 -682,971,013.8 40.2 Median age for Asian residents32.3 -689,075,629.6 -609,884,331.7 Median age for Native Hawaiian / Pacific Islander residents-611,708,482.1 -612,403,100.2 22.0 Median age for Other race residents20.9 24.6 12.2 Median age for Two or more races residents10.3 20.7 48.6 Median age for White alone residents48.3 49.2 28.3 Median age for Hispanic or Latino residents37.7 24.1
Owner/renter occupied households by race in Butner
House owners and renters - White residents 970 79.1% Owner occupied257 20.9% Renter occupiedHouse owners and renters - Black or African American residents 486 57.9% Owner occupied353 42.1% Renter occupiedHouse owners and renters - American Indian / Alaska Native residents 7 41.2% Owner occupied9 58.8% Renter occupiedHouse owners and renters - Asian residents 7 100.0% Owner occupiedHouse owners and renters - Native Hawaiian / Pacific Islander residents 38 100.0% Renter occupiedHouse owners and renters - Other race residents 204 68.3% Owner occupied95 31.7% Renter occupiedHouse owners and renters - Two or more races residents 73 86.2% Owner occupied12 13.8% Renter occupiedHouse owners and renters - White alone residents 949 79.2% Owner occupied249 20.8% Renter occupiedHouse owners and renters - Hispanic or Latino residents 216 68.0% Owner occupied102 32.0% Renter occupied
Language usage in Butner
English speakers - Total 81.4% of residents of Butner speak English at home.
17.0% of residents speak Spanish at home 755 55.6% Speak English very well602 44.4% Speak English less than very well1.5% of residents speak other language at home 116 100.0% Speak English very well
English speakers - Born in the United States 89.7% of residents of Butner speak English at home.
10.3% of residents speak Spanish at home 193 77.2% Speak English very well57 22.8% Speak English less than very well
English speakers - Native, born elsewhere 13.4% of residents of Butner speak English at home.
100.0% of residents speak Spanish at home 14 12.5% Speak English very well98 87.5% Speak English less than very well
English speakers - Foreign-born 21.4% of residents of Butner speak English at home.
64.6% of residents speak Spanish at home 150 24.6% Speak English very well459 75.4% Speak English less than very well12.3% of residents speak other language at home 116 100.0% Speak English very well
White (Caucasian) - Speak only English Native:
96.8% (3,447)Foreign-born:
70.7% (104)
White (Caucasian) - Speak another language Native:
3.0% (106)Foreign-born:
42.0% (62)
Black or African American - Speak only English Native:
98.3% (2,445)Foreign-born:
29.3% (59)
Black or African American - Speak another language Native:
1.8% (44)Foreign-born:
70.5% (142)
Other race - Speak only English Native:
4.3% (28)Foreign-born:
6.5% (38)
Other race - Speak another language Native:
95.1% (615)Foreign-born:
93.4% (543)
Two or more races - Speak another language Native:
17.7% (63)Foreign-born:
100.0% (31)
White alone - Speak only English Native:
98.5% (3,434)Foreign-born:
100.0% (9)
Hispanic or Latino - Speak only English Native:
12.7% (99)Foreign-born:
17.9% (134)
Hispanic or Latino - Speak another language Native:
85.2% (664)Foreign-born:
82.4% (614)
Foreign-born residents in Butner 943 residents are foreign born (8.8% Latin America , 1.5% North America ).
This city:
11.0%North Carolina:
8.3%
Marital status for residents in Butner Marital status - White (Caucasian) population 15 years and over
Males 31.6% Never married42.0% Now married6.0% Separated1.8% Widowed18.5% DivorcedFemales 22.3% Never married50.3% Now married0.3% Separated3.6% Widowed23.5% DivorcedWomen who gave birth in the past 12 months Now married:
100.0% (20)Unmarried:
0.0% (0)
Women who did not give birth in the past 12 months Now married:
49.4% (275)Unmarried:
50.6% (282)
Marital status - Black or African American population 15 years and over
Males 36.1% Never married50.8% Now married6.4% Separated2.7% Widowed4.0% DivorcedFemales 28.1% Never married48.5% Now married0.0% Separated12.2% Widowed11.1% DivorcedWomen who gave birth in the past 12 months Now married:
100.0% (26)Unmarried:
0.0% (0)
Women who did not give birth in the past 12 months Now married:
58.9% (242)Unmarried:
41.1% (169)
Marital status - American Indian / Alaska Native population 15 years and over
Males 25.0% Never married75.0% Now married0.0% Separated0.0% Widowed0.0% DivorcedFemales 0.0% Never married0.0% Now married100.0% Separated0.0% Widowed0.0% DivorcedWomen who did not give birth in the past 12 months Now married:
100.0% (10)Unmarried:
0.0% (0)
Marital status - Asian population 15 years and over
Males 65.2% Never married34.8% Now married0.0% Separated0.0% Widowed0.0% DivorcedFemales 0.0% Never married100.0% Now married0.0% Separated0.0% Widowed0.0% DivorcedMarital status - Other race population 15 years and over
Males 54.5% Never married30.0% Now married8.2% Separated0.0% Widowed7.3% DivorcedFemales 35.2% Never married40.9% Now married9.6% Separated0.0% Widowed14.3% DivorcedWomen who gave birth in the past 12 months Now married:
0.0% (0)Unmarried:
100.0% (3)
Women who did not give birth in the past 12 months Now married:
44.3% (207)Unmarried:
55.7% (261)
Marital status - Two or more races population 15 years and over
Males 25.9% Never married62.1% Now married0.0% Separated0.0% Widowed12.1% DivorcedFemales 67.5% Never married2.4% Now married0.0% Separated7.2% Widowed22.9% DivorcedWomen who did not give birth in the past 12 months Now married:
2.9% (3)Unmarried:
97.1% (92)
Marital status - White alone, not Hispanic / Latino population 15 years and over
Males 32.5% Never married45.3% Now married2.5% Separated2.1% Widowed17.5% DivorcedFemales 20.7% Never married52.6% Now married0.3% Separated3.8% Widowed22.6% DivorcedWomen who gave birth in the past 12 months Now married:
100.0% (21)Unmarried:
0.0% (0)
Women who did not give birth in the past 12 months Now married:
53.7% (284)Unmarried:
46.3% (245)
Marital status - Hispanic or Latino population 15 years and over
Males 44.9% Never married23.8% Now married16.3% Separated0.0% Widowed15.0% DivorcedFemales 40.5% Never married34.1% Now married8.0% Separated0.0% Widowed17.5% DivorcedWomen who gave birth in the past 12 months Now married:
0.0% (0)Unmarried:
100.0% (2)
Women who did not give birth in the past 12 months Now married:
38.1% (163)Unmarried:
61.9% (265)
Ancestries in Butner
631 15.4% English328 8.0% American169 4.1% German121 3.0% Irish79 1.9% Nigerian54 1.3% Italian45 1.1% European37 0.9% Scottish24 0.6% African14 0.3% French14 0.3% Portuguese13 0.3% Scotch-Irish7 0.2% Lebanese7 0.2% Polish
Children Nativity (place of birth) in Butner
Children under 6 years - Living with two parents Both parents native 347 100.0% NativeBoth parents foreign-born 84 100.0% NativeOne native, one foreign-born parent 34 100.0% NativeChildren under 6 years - Living with one parent Native parent 117 100.0% NativeForeign-born parent 9 100.0% NativeChildren 6 to 17 years - Living with two parents Both parents native 330 100.0% NativeBoth parents foreign-born 267 100.0% NativeOne native, one foreign-born parent 40 100.0% NativeChildren 6 to 17 years - Living with one parent Native parent 358 100.0% NativeForeign-born parent 28 51.0% Native27 49.0% Foreign-born
Grandparents responsible for own grandchildren in Butner
Grandparents (30 to 59 years) White / Caucasian 22 66.5% Responsible for grandchildren11 33.5% Not responsible for grandchildrenBlack or African American 43 84.2% Responsible for grandchildren8 15.8% Not responsible for grandchildrenWhite alone, not Hispanic / Latino 23 67.2% Responsible for grandchildren11 32.8% Not responsible for grandchildrenGrandparents (60 years and over) White / Caucasian 19 100.0% Responsible for grandchildrenBlack or African American 65 50.5% Responsible for grandchildren64 49.5% Not responsible for grandchildrenWhite alone, not Hispanic / Latino 20 100.0% Responsible for grandchildren