Races in Bloomington, Illinois (IL) Detailed Stats
Data:
Races - White alone (%)
Races - White alone (% change since 2000)
Races - Black alone (%)
Races - Black alone (% change since 2000)
Races - American Indian alone (%)
Races - American Indian alone (% change since 2000)
Races - Asian alone (%)
Races - Asian alone (% change since 2000)
Races - Hispanic (%)
Races - Hispanic (% change since 2000)
Races - Native Hawaiian and Other Pacific Islander alone (%)
Races - Native Hawaiian and Other Pacific Islander alone (% change since 2000)
Races - Two or more races(%)
Races - Two or more races(% change since 2000)
Races - Other race alone (%)
Races - Other race alone (% change since 2000)
Racial diversity
Place of birth - Born in state of residence (%)
Place of birth - Born in state of residence (%) - White
Place of birth - Born in state of residence (%) - Black or African American
Place of birth - Born in state of residence (%) - Asian
Place of birth - Born in state of residence (%) - Hispanic or Latino
Place of birth - Born in state of residence (%) - American Indian and Alaska Native
Place of birth - Born in state of residence (%) - Multirace
Place of birth - Born in state of residence (%) - Other Race
Place of birth - Born in other state (%)
Place of birth - Born in other state (%) - White
Place of birth - Born in other state (%) - Black or African American
Place of birth - Born in other state (%) - Asian
Place of birth - Born in other state (%) - Hispanic or Latino
Place of birth - Born in other state (%) - American Indian and Alaska Native
Place of birth - Born in other state (%) - Multirace
Place of birth - Born in other state (%) - Other Race
Place of birth - Native, outside of US (%)
Place of birth - Native, outside of US (%) - White
Place of birth - Native, outside of US (%) - Black or African American
Place of birth - Native, outside of US (%) - Asian
Place of birth - Native, outside of US (%) - Hispanic or Latino
Place of birth - Native, outside of US (%) - American Indian and Alaska Native
Place of birth - Native, outside of US (%) - Multirace
Place of birth - Native, outside of US (%) - Other Race
Place of birth - Foreign born (%)
Place of birth - Foreign born (%) - White
Place of birth - Foreign born (%) - Black or African American
Place of birth - Foreign born (%) - Asian
Place of birth - Foreign born (%) - Hispanic or Latino
Place of birth - Foreign born (%) - American Indian and Alaska Native
Place of birth - Foreign born (%) - Multirace
Place of birth - Foreign born (%) - Other Race
Residents speaking English at home (%)
Residents speaking English at home - Born in the United States (%)
Residents speaking English at home - Native, born elsewhere (%)
Residents speaking English at home - Foreign born (%)
Residents speaking Spanish at home (%)
Residents speaking Spanish at home - Born in the United States (%)
Residents speaking Spanish at home - Native, born elsewhere (%)
Residents speaking Spanish at home - Foreign born (%)
Residents speaking other language at home (%)
Residents speaking other language at home - Born in the United States (%)
Residents speaking other language at home - Native, born elsewhere (%)
Residents speaking other language at home - Foreign born (%)
Marital status - Never married (%)
Marital status - Now married (%)
Marital status - Separated (%)
Marital status - Widowed (%)
Marital status - Divorced (%)
Ancestries Reported - Arab (%)
Ancestries Reported - Czech (%)
Ancestries Reported - Danish (%)
Ancestries Reported - Dutch (%)
Ancestries Reported - English (%)
Ancestries Reported - French (%)
Ancestries Reported - French Canadian (%)
Ancestries Reported - German (%)
Ancestries Reported - Greek (%)
Ancestries Reported - Hungarian (%)
Ancestries Reported - Irish (%)
Ancestries Reported - Italian (%)
Ancestries Reported - Lithuanian (%)
Ancestries Reported - Norwegian (%)
Ancestries Reported - Polish (%)
Ancestries Reported - Portuguese (%)
Ancestries Reported - Russian (%)
Ancestries Reported - Scotch-Irish (%)
Ancestries Reported - Scottish (%)
Ancestries Reported - Slovak (%)
Ancestries Reported - Subsaharan African (%)
Ancestries Reported - Swedish (%)
Ancestries Reported - Swiss (%)
Ancestries Reported - Ukrainian (%)
Ancestries Reported - United States (%)
Ancestries Reported - Welsh (%)
Ancestries Reported - West Indian (%)
Ancestries Reported - Other (%)
Geographical mobility - Same house 1 year ago (%)
Geographical mobility - Same house 1 year ago (%) - White
Geographical mobility - Same house 1 year ago (%) - Black or African American
Geographical mobility - Same house 1 year ago (%) - Asian
Geographical mobility - Same house 1 year ago (%) - Hispanic or Latino
Geographical mobility - Same house 1 year ago (%) - American Indian and Alaska Native
Geographical mobility - Same house 1 year ago (%) - Multirace
Geographical mobility - Same house 1 year ago (%) - Other Race
Geographical mobility - Moved within same county (%)
Geographical mobility - Moved within same county (%) - White
Geographical mobility - Moved within same county (%) - Black or African American
Geographical mobility - Moved within same county (%) - Asian
Geographical mobility - Moved within same county (%) - Hispanic or Latino
Geographical mobility - Moved within same county (%) - American Indian and Alaska Native
Geographical mobility - Moved within same county (%) - Multirace
Geographical mobility - Moved within same county (%) - Other Race
Geographical mobility - Moved from different county within same state (%)
Geographical mobility - Moved from different county within same state (%) - White
Geographical mobility - Moved from different county within same state (%) - Black or African American
Geographical mobility - Moved from different county within same state (%) - Asian
Geographical mobility - Moved from different county within same state (%) - Hispanic or Latino
Geographical mobility - Moved from different county within same state (%) - American Indian and Alaska Native
Geographical mobility - Moved from different county within same state (%) - Multirace
Geographical mobility - Moved from different county within same state (%) - Other Race
Geographical mobility - Moved from different state (%)
Geographical mobility - Moved from different state (%) - White
Geographical mobility - Moved from different state (%) - Black or African American
Geographical mobility - Moved from different state (%) - Asian
Geographical mobility - Moved from different state (%) - Hispanic or Latino
Geographical mobility - Moved from different state (%) - American Indian and Alaska Native
Geographical mobility - Moved from different state (%) - Multirace
Geographical mobility - Moved from different state (%) - Other Race
Geographical mobility - Moved from abroad (%)
Geographical mobility - Moved from abroad (%) - White
Geographical mobility - Moved from abroad (%) - Black or African American
Geographical mobility - Moved from abroad (%) - Asian
Geographical mobility - Moved from abroad (%) - Hispanic or Latino
Geographical mobility - Moved from abroad (%) - American Indian and Alaska Native
Geographical mobility - Moved from abroad (%) - Multirace
Geographical mobility - Moved from abroad (%) - Other Race
Place of birth for the foreign-born population - Ireland (%)
Place of birth for the foreign-born population - Denmark (%)
Place of birth for the foreign-born population - Norway (%)
Place of birth for the foreign-born population - Sweden (%)
Place of birth for the foreign-born population - United Kingdom (%)
Place of birth for the foreign-born population - England (%)
Place of birth for the foreign-born population - Scotland (%)
Place of birth for the foreign-born population - Other Northern Europe (%)
Place of birth for the foreign-born population - Austria (%)
Place of birth for the foreign-born population - Belgium (%)
Place of birth for the foreign-born population - France (%)
Place of birth for the foreign-born population - Germany (%)
Place of birth for the foreign-born population - Netherlands (%)
Place of birth for the foreign-born population - Switzerland (%)
Place of birth for the foreign-born population - Other Western Europe (%)
Place of birth for the foreign-born population - Greece (%)
Place of birth for the foreign-born population - Italy (%)
Place of birth for the foreign-born population - Portugal (%)
Place of birth for the foreign-born population - Spain (%)
Place of birth for the foreign-born population - Other Southern Europe (%)
Place of birth for the foreign-born population - Albania (%)
Place of birth for the foreign-born population - Belarus (%)
Place of birth for the foreign-born population - Bosnia and Herzegovina (%)
Place of birth for the foreign-born population - Bulgaria (%)
Place of birth for the foreign-born population - Croatia (%)
Place of birth for the foreign-born population - Czechoslovakia (%)
Place of birth for the foreign-born population - Hungary (%)
Place of birth for the foreign-born population - Latvia (%)
Place of birth for the foreign-born population - Lithuania (%)
Place of birth for the foreign-born population - North Macedonia (Macedonia) (%)
Place of birth for the foreign-born population - Moldova (%)
Place of birth for the foreign-born population - Poland (%)
Place of birth for the foreign-born population - Romania (%)
Place of birth for the foreign-born population - Russia (%)
Place of birth for the foreign-born population - Serbia (%)
Place of birth for the foreign-born population - Ukraine (%)
Place of birth for the foreign-born population - Other Eastern Europe (%)
Place of birth for the foreign-born population - China (%)
Place of birth for the foreign-born population - Hong Kong (%)
Place of birth for the foreign-born population - Taiwan (%)
Place of birth for the foreign-born population - Japan (%)
Place of birth for the foreign-born population - Korea (%)
Place of birth for the foreign-born population - Other Eastern Asia (%)
Place of birth for the foreign-born population - Afghanistan (%)
Place of birth for the foreign-born population - Bangladesh (%)
Place of birth for the foreign-born population - India (%)
Place of birth for the foreign-born population - Iran (%)
Place of birth for the foreign-born population - Kazakhstan (%)
Place of birth for the foreign-born population - Nepal (%)
Place of birth for the foreign-born population - Pakistan (%)
Place of birth for the foreign-born population - Sri Lanka (%)
Place of birth for the foreign-born population - Uzbekistan (%)
Place of birth for the foreign-born population - Other South Central Asia (%)
Place of birth for the foreign-born population - Burma (%)
Place of birth for the foreign-born population - Cambodia (%)
Place of birth for the foreign-born population - Indonesia (%)
Place of birth for the foreign-born population - Laos (%)
Place of birth for the foreign-born population - Malaysia (%)
Place of birth for the foreign-born population - Philippines (%)
Place of birth for the foreign-born population - Singapore (%)
Place of birth for the foreign-born population - Thailand (%)
Place of birth for the foreign-born population - Vietnam (%)
Place of birth for the foreign-born population - Other South Eastern Asia (%)
Place of birth for the foreign-born population - Armenia (%)
Place of birth for the foreign-born population - Iraq (%)
Place of birth for the foreign-born population - Israel (%)
Place of birth for the foreign-born population - Jordan (%)
Place of birth for the foreign-born population - Kuwait (%)
Place of birth for the foreign-born population - Lebanon (%)
Place of birth for the foreign-born population - Saudi Arabia (%)
Place of birth for the foreign-born population - Syria (%)
Place of birth for the foreign-born population - Turkey (%)
Place of birth for the foreign-born population - Yemen (%)
Place of birth for the foreign-born population - Other Western Asia (%)
Place of birth for the foreign-born population - Eritrea (%)
Place of birth for the foreign-born population - Ethiopia (%)
Place of birth for the foreign-born population - Kenya (%)
Place of birth for the foreign-born population - Somalia (%)
Place of birth for the foreign-born population - Uganda (%)
Place of birth for the foreign-born population - Zimbabwe (%)
Place of birth for the foreign-born population - Other Eastern Africa (%)
Place of birth for the foreign-born population - Cameroon (%)
Place of birth for the foreign-born population - Congo (%)
Place of birth for the foreign-born population - Democratic Republic of Congo (Zaire) (%)
Place of birth for the foreign-born population - Other Middle Africa (%)
Place of birth for the foreign-born population - Egypt (%)
Place of birth for the foreign-born population - Morocco (%)
Place of birth for the foreign-born population - Sudan (%)
Place of birth for the foreign-born population - Other Northern Africa (%)
Place of birth for the foreign-born population - South Africa (%)
Place of birth for the foreign-born population - Other Southern Africa (%)
Place of birth for the foreign-born population - Cabo Verde (%)
Place of birth for the foreign-born population - Ghana (%)
Place of birth for the foreign-born population - Liberia (%)
Place of birth for the foreign-born population - Nigeria (%)
Place of birth for the foreign-born population - Senegal (%)
Place of birth for the foreign-born population - Sierra Leone (%)
Place of birth for the foreign-born population - Other Western Africa (%)
Place of birth for the foreign-born population - Australia (%)
Place of birth for the foreign-born population - New Zealand (%)
Place of birth for the foreign-born population - Fiji (%)
Place of birth for the foreign-born population - Micronesia (%)
Place of birth for the foreign-born population - Bahamas (%)
Place of birth for the foreign-born population - Barbados (%)
Place of birth for the foreign-born population - Cuba (%)
Place of birth for the foreign-born population - Dominica (%)
Place of birth for the foreign-born population - Dominican Republic (%)
Place of birth for the foreign-born population - Grenada (%)
Place of birth for the foreign-born population - Haiti (%)
Place of birth for the foreign-born population - Jamaica (%)
Place of birth for the foreign-born population - St. Vincent and the Grenadines (%)
Place of birth for the foreign-born population - Trinidad and Tobago (%)
Place of birth for the foreign-born population - West Indies (%)
Place of birth for the foreign-born population - Other Caribbean (%)
Place of birth for the foreign-born population - Belize (%)
Place of birth for the foreign-born population - Costa Rica (%)
Place of birth for the foreign-born population - El Salvador (%)
Place of birth for the foreign-born population - Guatemala (%)
Place of birth for the foreign-born population - Honduras (%)
Place of birth for the foreign-born population - Mexico (%)
Place of birth for the foreign-born population - Nicaragua (%)
Place of birth for the foreign-born population - Panama (%)
Place of birth for the foreign-born population - Other Central America (%)
Place of birth for the foreign-born population - Argentina (%)
Place of birth for the foreign-born population - Bolivia (%)
Place of birth for the foreign-born population - Brazil (%)
Place of birth for the foreign-born population - Chile (%)
Place of birth for the foreign-born population - Colombia (%)
Place of birth for the foreign-born population - Ecuador (%)
Place of birth for the foreign-born population - Guyana (%)
Place of birth for the foreign-born population - Peru (%)
Place of birth for the foreign-born population - Uruguay (%)
Place of birth for the foreign-born population - Venezuela (%)
Place of birth for the foreign-born population - Other South America (%)
Place of birth for the foreign-born population - Canada (%)
Place of birth for the foreign-born population - Other Northern America (%)
Place of birth for the foreign-born population - Other (%)
Latest news about races in Bloomington, IL collected exclusively by city-data.com from local newspapers, TV, and radio stations
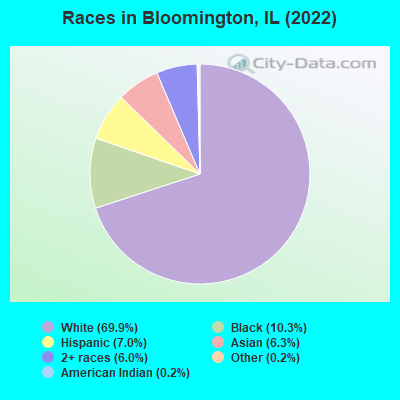
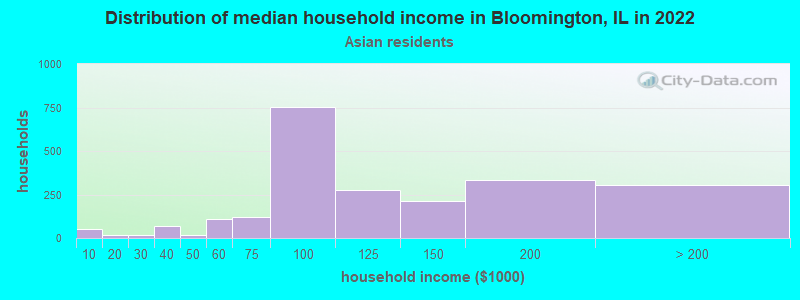
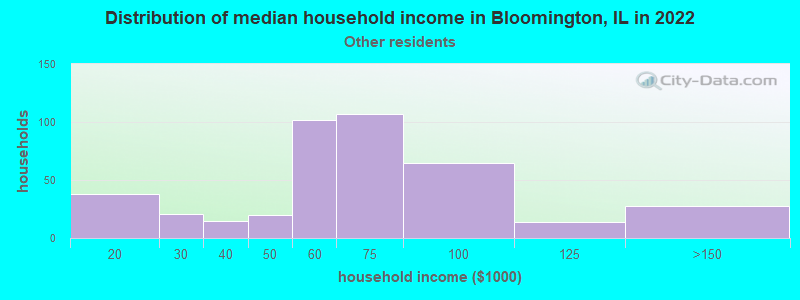
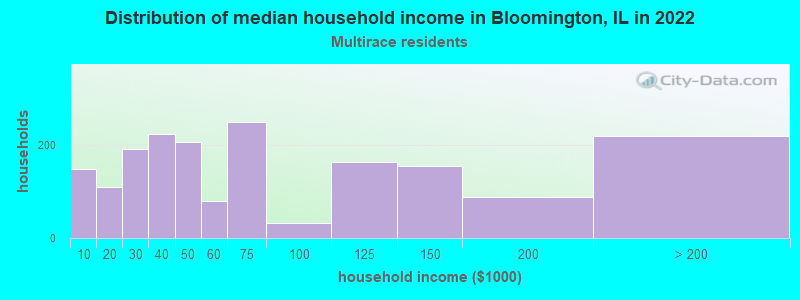
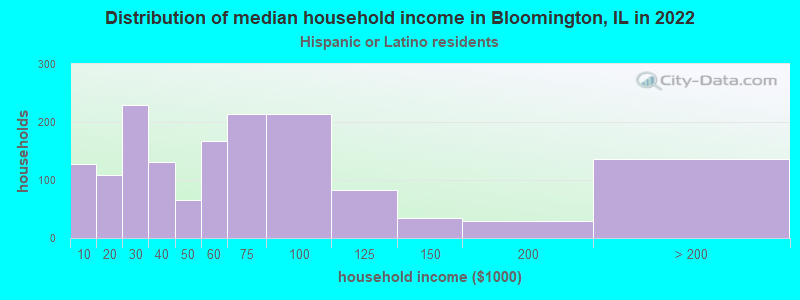
According to 2022 data, the most numerous races in Bloomington, IL are White alone (55,162 residents), Hispanic (5,484 residents), and Black alone (8,156 residents). 89.5% of Bloomington residents speak English at home. 10.2% of Bloomington, IL residents are foreign-born (6.9% born in Asia, 2.1% born in Latin America), which is 37.8% less than the foreign-born rate of 14.0% across the entire state of Illinois.
Race distribution in Bloomington
2000 2022
8,424,140 67.8% White alone 1,856,152 14.9% Black alone 1,530,262 12.3% Hispanic 419,916 3.4% Asian alone 153,996 1.2% Two or more races 13,479 0.1% Other race alone 18,232 0.1% American Indian alone 3,116 0.03% Native Hawaiian and Other
7,356,301 58.5% White alone 2,299,726 18.3% Hispanic 1,660,423 13.2% Black alone 747,296 5.9% Asian alone 458,599 3.6% Two or more races 45,386 0.4% Other race alone 10,405 0.08% American Indian alone 3,896 0.03% Native Hawaiian and Other
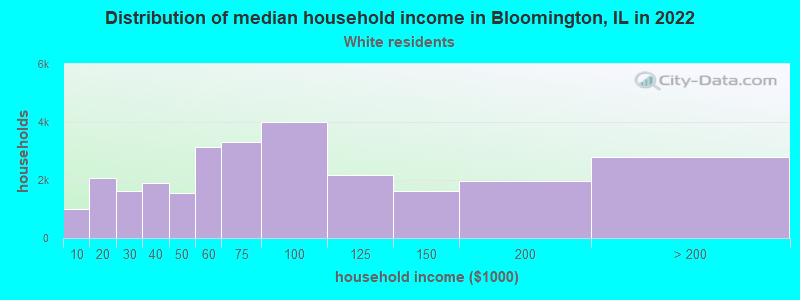
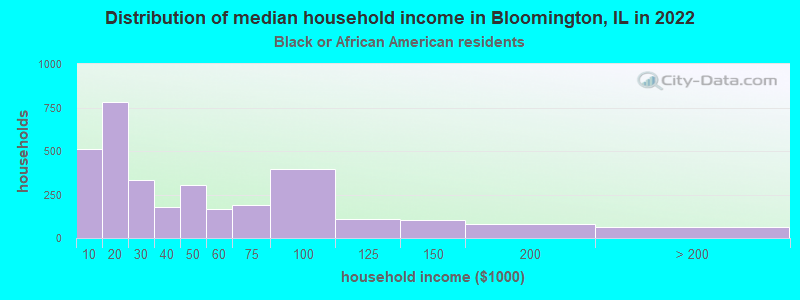
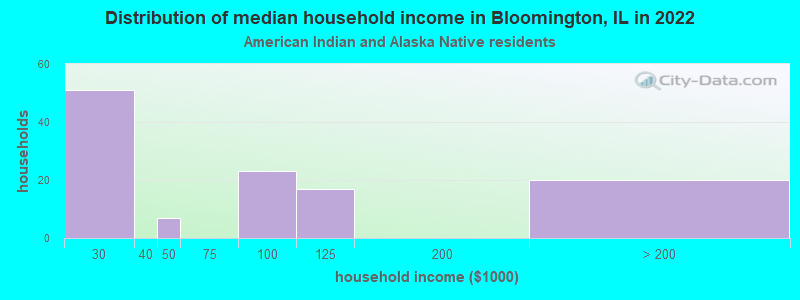
Income and house value in Bloomington Median household income in 2022 $70,370 White non-Hispanic householders$28,750 Black householders$169,563 Asian householders$65,832 Some other race householders$72,106 Two or more races householders$60,795 Hispanic or Latino race householdersMedian 2022 house value $199,343 White Non-Hispanic householders$168,003 Black or African American householders$162,694 American Indian or Alaska Native householders $334,122 Asian householders$173,483 Some other race householders$311,858 Two or more races householders$209,789 Hispanic or Latino householders
Median age by race in Bloomington
42.1 Median age for White residents41.7 42.4 28.0 Median age for Black or African American residents28.2 28.0 39.1 Median age for American Indian / Alaska Native residents42.4 20.0 32.8 Median age for Asian residents32.4 35.1 -666,666,666.0 Median age for Native Hawaiian / Pacific Islander residents-666,666,666.0 -666,666,666.0 46.0 Median age for Other race residents46.5 15.4 23.3 Median age for Two or more races residents27.0 22.4 42.6 Median age for White alone residents42.4 42.7 22.0 Median age for Hispanic or Latino residents33.2 19.8
Owner/renter occupied households by race in Bloomington
House owners and renters - White residents 17,403 64.2% Owner occupied9,688 35.8% Renter occupiedHouse owners and renters - Black or African American residents 1,201 34.9% Owner occupied2,245 65.1% Renter occupiedHouse owners and renters - American Indian / Alaska Native residents 29 17.4% Owner occupied137 82.6% Renter occupiedHouse owners and renters - Asian residents 913 49.8% Owner occupied919 50.2% Renter occupiedHouse owners and renters - Other race residents 685 78.2% Owner occupied191 21.8% Renter occupiedHouse owners and renters - Two or more races residents 1,137 66.1% Owner occupied583 33.9% Renter occupiedHouse owners and renters - White alone residents 17,247 64.3% Owner occupied9,564 35.7% Renter occupiedHouse owners and renters - Hispanic or Latino residents 1,123 68.7% Owner occupied511 31.3% Renter occupied
Language usage in Bloomington
English speakers - Total 89.5% of residents of Bloomington speak English at home.
4.1% of residents speak Spanish at home 1,961 64.4% Speak English very well1,083 35.6% Speak English less than very well6.4% of residents speak other language at home 4,248 88.8% Speak English very well537 11.2% Speak English less than very well
English speakers - Born in the United States 96.1% of residents of Bloomington speak English at home.
1.6% of residents speak Spanish at home 243 100.0% Speak English very well2.3% of residents speak other language at home 347 100.0% Speak English very well
English speakers - Native, born elsewhere 79.8% of residents of Bloomington speak English at home.
11.4% of residents speak Spanish at home 118 100.0% Speak English very well8.7% of residents speak other language at home 90 100.0% Speak English very well
English speakers - Foreign-born 13.2% of residents of Bloomington speak English at home.
25.2% of residents speak Spanish at home 576 36.1% Speak English very well1,018 63.9% Speak English less than very well61.6% of residents speak other language at home 3,365 86.2% Speak English very well537 13.8% Speak English less than very well
White (Caucasian) - Speak only English Native:
98.5% (52,602)Foreign-born:
43.1% (205)
White (Caucasian) - Speak another language Native:
1.5% (798)Foreign-born:
56.9% (271)
Black or African American - Speak only English Native:
97.1% (6,119)Foreign-born:
43.6% (192)
Black or African American - Speak another language Native:
2.9% (181)Foreign-born:
58.0% (256)
American Indian / Alaska Native - Speak only English Native:
74.6% (130)Foreign-born:
32.4% (12)
American Indian / Alaska Native - Speak another language Native:
15.2% (26)Foreign-born:
55.8% (21)
Asian - Speak only English Native:
62.3% (607)Foreign-born:
6.4% (247)
Asian - Speak another language Native:
37.7% (368)Foreign-born:
93.6% (3,591)
Other race - Speak another language Native:
53.1% (420)Foreign-born:
99.9% (524)
Two or more races - Speak only English Native:
88.0% (4,789)Foreign-born:
3.9% (31)
Two or more races - Speak another language Native:
11.9% (650)Foreign-born:
81.3% (649)
White alone - Speak only English Native:
98.9% (52,052)Foreign-born:
43.1% (205)
White alone - Speak another language Native:
1.1% (560)Foreign-born:
56.9% (271)
Hispanic or Latino - Speak only English Native:
63.4% (2,011)Foreign-born:
10.4% (184)
Hispanic or Latino - Speak another language Native:
36.6% (1,160)Foreign-born:
89.6% (1,590)
Foreign-born residents in Bloomington 7,995 residents are foreign born (6.9% Asia , 2.1% Latin America ).
This city:
10.2%Illinois:
14.1%
Marital status for residents in Bloomington Marital status - White (Caucasian) population 15 years and over
Males 36.3% Never married47.5% Now married1.0% Separated4.5% Widowed10.7% DivorcedFemales 35.3% Never married43.8% Now married1.4% Separated6.6% Widowed13.0% DivorcedWomen who gave birth in the past 12 months Now married:
82.4% (554)Unmarried:
17.6% (118)
Women who did not give birth in the past 12 months Now married:
30.6% (4,070)Unmarried:
69.4% (9,223)
Marital status - Black or African American population 15 years and over
Males 60.1% Never married28.0% Now married3.6% Separated0.0% Widowed8.3% DivorcedFemales 63.8% Never married23.0% Now married2.2% Separated1.8% Widowed9.2% DivorcedWomen who gave birth in the past 12 months Now married:
25.6% (39)Unmarried:
74.4% (113)
Women who did not give birth in the past 12 months Now married:
21.1% (338)Unmarried:
78.9% (1,263)
Marital status - American Indian / Alaska Native population 15 years and over
Males 6.3% Never married35.4% Now married0.0% Separated0.0% Widowed58.2% DivorcedFemales 55.9% Never married39.0% Now married0.0% Separated0.0% Widowed5.1% DivorcedWomen who did not give birth in the past 12 months Now married:
34.0% (28)Unmarried:
66.0% (55)
Marital status - Asian population 15 years and over
Males 38.4% Never married60.7% Now married0.0% Separated0.4% Widowed0.6% DivorcedFemales 25.1% Never married64.3% Now married0.7% Separated6.4% Widowed3.5% DivorcedWomen who gave birth in the past 12 months Now married:
100.0% (37)Unmarried:
0.0% (0)
Women who did not give birth in the past 12 months Now married:
65.5% (1,045)Unmarried:
34.5% (550)
Marital status - Other race population 15 years and over
Males 47.0% Never married49.6% Now married0.0% Separated0.0% Widowed3.4% DivorcedFemales 49.4% Never married43.4% Now married0.0% Separated3.2% Widowed4.0% DivorcedWomen who gave birth in the past 12 months Now married:
100.0% (15)Unmarried:
0.0% (0)
Women who did not give birth in the past 12 months Now married:
39.7% (136)Unmarried:
60.3% (207)
Marital status - Two or more races population 15 years and over
Males 63.5% Never married30.5% Now married0.9% Separated0.6% Widowed4.5% DivorcedFemales 54.6% Never married37.1% Now married2.0% Separated3.6% Widowed2.7% DivorcedWomen who gave birth in the past 12 months Now married:
54.9% (89)Unmarried:
45.1% (73)
Women who did not give birth in the past 12 months Now married:
45.2% (577)Unmarried:
54.8% (700)
Marital status - White alone, not Hispanic / Latino population 15 years and over
Males 36.1% Never married47.8% Now married1.0% Separated4.2% Widowed10.8% DivorcedFemales 34.5% Never married44.3% Now married1.4% Separated6.6% Widowed13.1% DivorcedWomen who gave birth in the past 12 months Now married:
100.0% (554)Unmarried:
0.0% (0)
Women who did not give birth in the past 12 months Now married:
31.0% (4,070)Unmarried:
69.0% (9,058)
Marital status - Hispanic or Latino population 15 years and over
Males 47.0% Never married46.9% Now married0.0% Separated0.8% Widowed5.3% DivorcedFemales 47.6% Never married40.3% Now married2.7% Separated6.2% Widowed3.2% DivorcedWomen who gave birth in the past 12 months Now married:
60.0% (61)Unmarried:
40.0% (41)
Women who did not give birth in the past 12 months Now married:
38.5% (422)Unmarried:
61.5% (674)
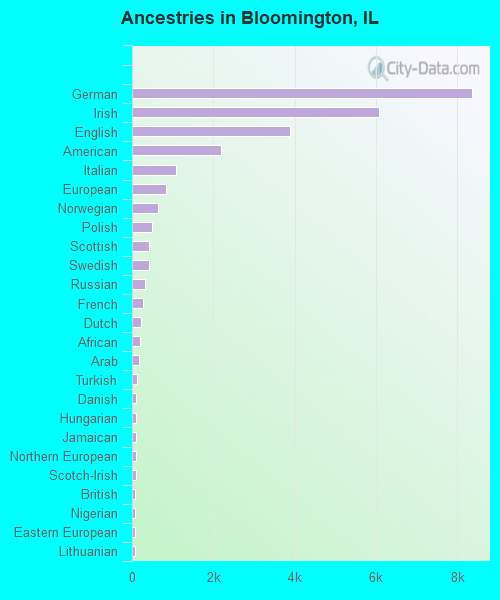
Ancestries in Bloomington
8,365 19.6% German6,084 14.3% Irish3,876 9.1% English2,179 5.1% American1,093 2.6% Italian837 2.0% European631 1.5% Norwegian480 1.1% Polish419 1.0% Scottish408 1.0% Swedish310 0.7% Russian279 0.7% French217 0.5% Dutch206 0.5% African169 0.4% Arab117 0.3% Turkish105 0.2% Danish101 0.2% Hungarian95 0.2% Jamaican91 0.2% Northern European89 0.2% Scotch-Irish82 0.2% British81 0.2% Nigerian79 0.2% Eastern European77 0.2% Lithuanian76 0.2% Greek76 0.2% Belgian62 0.1% Moroccan52 0.1% Portuguese49 0.1% Iranian47 0.1% Canadian44 0.1% French Canadian44 0.1% Guyanese43 0.1% Scandinavian38 0.09% Welsh37 0.09% Jordanian33 0.08% Lebanese32 0.07% Croatian26 0.06% Serbian25 0.06% Slovene23 0.05% Egyptian22 0.05% Australian21 0.05% Latvian20 0.05% Belizean20 0.05% Czech17 0.04% Yugoslavian16 0.04% Austrian13 0.03% Albanian12 0.03% Ukrainian11 0.03% Cape Verdean10 0.02% Swiss7 0.02% Senegalese6 0.01% Romanian6 0.01% Finnish5 0.01% Haitian4 0.01% Macedonian
Geographical mobility in Bloomington Same house 1 year ago 49,699 89.2% White (Caucasian)7,166 89.4% Black or African American157 63.3% American Indian / Alaska Native5,143 79.1% Asian1,299 91.8% Other race5,666 87.4% Two or more races49,031 89.3% White alone, not Hispanic / Latino3,960 82.0% Hispanic or LatinoMoved within same county 3,891 7.0% White / Caucasian113 1.4% Black or African American62 25.0% American Indian / Alaska Native589 9.1% Asian7 94.6% Native Hawaiian / Pacific Islander48 3.4% Other race502 7.7% Two or more races3,851 7.0% White alone, not Hispanic / Latino249 5.2% Hispanic or LatinoMoved within same state 1,712 3.1% White / Caucasian268 3.3% Black or African American14 5.5% American Indian / Alaska Native349 5.4% Asian36 2.5% Other race278 4.3% Two or more races1,632 3.0% White alone, not Hispanic / Latino364 7.5% Hispanic or LatinoMoved from different state 390 0.7% White / Caucasian470 5.9% Black or African American129 2.0% Asian13 0.9% Other race15 0.2% Two or more races390 0.7% White alone, not Hispanic / Latino30 0.6% Hispanic or LatinoMoved from abroad 17 6.9% American Indian / Alaska Native317 4.9% Asian30 2.2% Other race112 1.7% Two or more races103 2.1% Hispanic or Latino
Children Nativity (place of birth) in Bloomington
Children under 6 years - Living with two parents Both parents native 2,893 100.0% NativeBoth parents foreign-born 589 71.7% Native232 28.3% Foreign-bornOne native, one foreign-born parent 296 100.0% NativeChildren under 6 years - Living with one parent Native parent 1,077 100.0% NativeForeign-born parent 63 82.9% Native13 17.1% Foreign-bornChildren 6 to 17 years - Living with two parents Both parents native 6,766 97.5% Native170 2.5% Foreign-bornBoth parents foreign-born 568 58.3% Native406 41.7% Foreign-bornOne native, one foreign-born parent 317 100.0% NativeChildren 6 to 17 years - Living with one parent Native parent 2,208 100.0% NativeForeign-born parent 875 45.2% Native1,062 54.8% Foreign-born
Grandparents responsible for own grandchildren in Bloomington
Grandparents (30 to 59 years) White / Caucasian 4 3.2% Responsible for grandchildren115 96.8% Not responsible for grandchildrenBlack or African American 12 18.7% Responsible for grandchildren53 81.3% Not responsible for grandchildrenWhite alone, not Hispanic / Latino 4 3.1% Responsible for grandchildren117 96.9% Not responsible for grandchildrenGrandparents (60 years and over) White / Caucasian 158 61.9% Responsible for grandchildren97 38.1% Not responsible for grandchildrenBlack or African American 20 100.0% Not responsible for grandchildrenWhite alone, not Hispanic / Latino 158 64.4% Responsible for grandchildren87 35.6% Not responsible for grandchildren