Estimated zip code population in 2022: 34,991 Zip code population in 2010: 36,105 Zip code population in 2000: 37,240
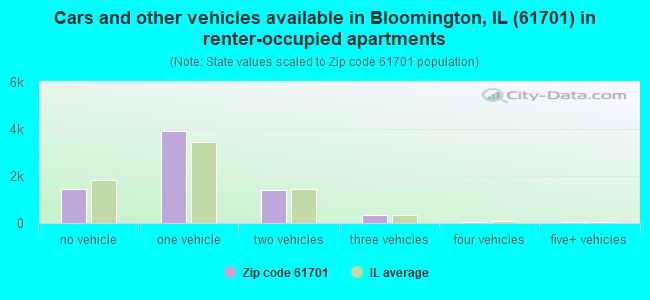
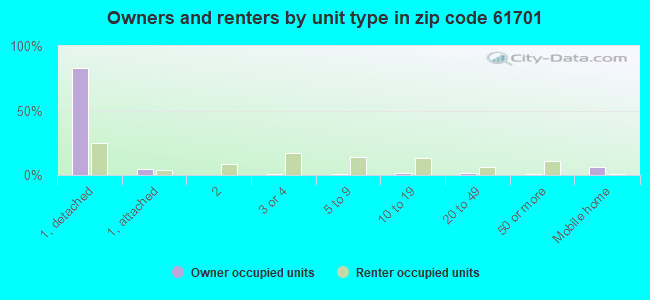
Houses and condos: 18,121 Renter-occupied apartments: 7,174
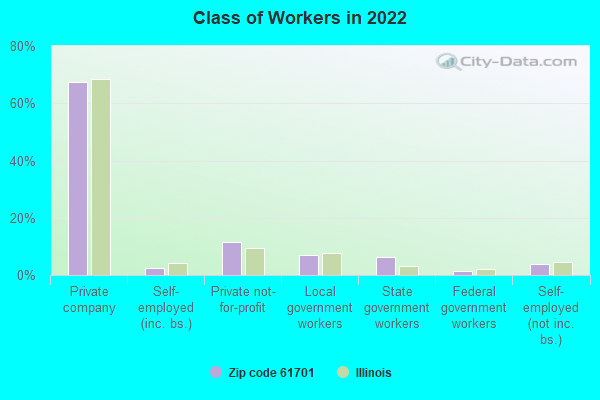
% of renters here:
44%
State:
33%
March 2022 cost of living index in zip code 61701: 85.7 (less than average, U.S. average is 100)
Land area: 11.3 sq. mi. Water area: 0.0 sq. mi.
Population density: 3,099 people per square mile
(average).
OSM Map
General Map
Google Map
MSN Map
OSM Map
General Map
Google Map
MSN Map
OSM Map
General Map
Google Map
MSN Map
OSM Map
General Map
Google Map
MSN Map
Please wait while loading the map...
Real estate property taxes paid for housing units in 2022:
This zip code:
1.9% ($2,705)
Illinois:
2.0% ($4,912)
Median real estate property taxes paid for housing units with mortgages in 2022: $2,864 (1.9%) Median real estate property taxes paid for housing units with no mortgage in 2022: $2,340 (1.8%)
Averages for the 2020 tax year for zip code 61701, filed in 2021:
Average Adjusted Gross Income (AGI) in 2020: $55,838 (Individual Income Tax Returns)
Here:
$55,838
State:
$82,626
Salary/wage: $45,377 (reported on 84.1% of returns)
Here:
$45,377
State:
$66,640
(% of AGI for various income ranges: 1170.0% for AGIs below $25k, 3483.4% for AGIs $25k-50k, 6215.6% for AGIs $50k-75k, 9148.2% for AGIs $75k-100k, 15479.3% for AGIs $100k-200k, 70634.3% for AGIs over 200k)
Taxable interest for individuals: $1,140 (reported on 32.4% of returns)
This zip code:
$1,140
Illinois:
$2,376
(% of AGI for various income ranges: 8.7% for AGIs below $25k, 13.0% for AGIs $25k-50k, 41.5% for AGIs $50k-75k, 59.9% for AGIs $75k-100k, 185.3% for AGIs $100k-200k, 1556.4% for AGIs over 200k)
Ordinary dividends: $5,722 (reported on 15.5% of returns)
Here:
$5,722
State:
$9,061
(% of AGI for various income ranges: 12.9% for AGIs below $25k, 24.4% for AGIs $25k-50k, 79.4% for AGIs $50k-75k, 157.0% for AGIs $75k-100k, 430.2% for AGIs $100k-200k, 4479.3% for AGIs over 200k)
Net capital gain/loss in AGI: +$9,641 (reported on 13.5% of returns)
Here:
+$9,641
State:
+$31,684
(% of AGI for various income ranges: 5.2% for AGIs below $25k, 19.2% for AGIs $25k-50k, 74.0% for AGIs $50k-75k, 126.9% for AGIs $75k-100k, 584.7% for AGIs $100k-200k, 9178.6% for AGIs over 200k)
Profit/loss from business: +$13,580 (reported on 11.0% of returns)
Here:
+$13,580
State:
+$12,175
(% of AGI for various income ranges: 80.8% for AGIs below $25k, 83.0% for AGIs $25k-50k, 137.9% for AGIs $50k-75k, 216.8% for AGIs $75k-100k, 427.6% for AGIs $100k-200k, 6631.4% for AGIs over 200k)
Taxable individual retirement arrangement distribution: $14,579 (reported on 7.9% of returns)
61701:
$14,579
Illinois:
$21,613
(% of AGI for various income ranges: 33.1% for AGIs below $25k, 66.9% for AGIs $25k-50k, 173.2% for AGIs $50k-75k, 266.9% for AGIs $75k-100k, 641.7% for AGIs $100k-200k, 2292.1% for AGIs over 200k)
Self-employed (Keogh) retirement plans: $40,520 (reported on 0.3% of returns)
61701:
$40,520
Illinois:
$30,962
(% of AGI for various income ranges: 12.4% for AGIs $50k-75k, 1282.1% for AGIs over 200k)
Total itemized deductions: $34,110 (reported on 4.5% of returns)
Here:
$34,110
State:
$34,948
(% of AGI for various income ranges: 25.7% for AGIs below $25k, 56.3% for AGIs $25k-50k, 168.3% for AGIs $50k-75k, 369.5% for AGIs $75k-100k, 710.2% for AGIs $100k-200k, 6560.0% for AGIs over 200k)
Charity contributions: $16,426 (reported on 3.4% of returns)
Here:
$16,426
State:
$13,122
(% of AGI for various income ranges: 1.2% for AGIs below $25k, 5.9% for AGIs $25k-50k, 26.5% for AGIs $50k-75k, 75.6% for AGIs $75k-100k, 206.5% for AGIs $100k-200k, 4291.4% for AGIs over 200k)
Taxes paid: $7,129 (reported on 4.5% of returns)
61701:
$7,129
State:
$8,563
(% of AGI for various income ranges: 3.2% for AGIs below $25k, 8.0% for AGIs $25k-50k, 38.3% for AGIs $50k-75k, 106.0% for AGIs $75k-100k, 194.6% for AGIs $100k-200k, 996.4% for AGIs over 200k)
Earned income credit: $2,229 (reported on 19.2% of returns)
Here:
$2,229
State:
$2,311
(% of AGI for various income ranges: 99.4% for AGIs below $25k, 58.0% for AGIs $25k-50k, 1.2% for AGIs $50k-75k)
Percentage of individuals using paid preparers for their 2020 taxes: 94.1%
Here:
94%
State:
93%
(% for various income ranges: 93.1% for AGIs below $25k, 95.2% for AGIs $25k-50k, 93.7% for AGIs $50k-75k, 94.1% for AGIs $75k-100k, 95.2% for AGIs $100k-200k, 95.2% for AGIs over 200k)
Averages for the 2012 tax year for zip code 61701, filed in 2013:
Average Adjusted Gross Income (AGI) in 2012: $48,099 (Individual Income Tax Returns)
Here:
$48,099
State:
$68,058
Salary/wage: $39,947 (reported on 86.6% of returns)
Here:
$39,947
State:
$55,396
(% of AGI for various income ranges: 79.4% for AGIs below $25k, 83.7% for AGIs $25k-50k, 79.5% for AGIs $50k-75k, 77.1% for AGIs $75k-100k, 68.8% for AGIs $100k-200k, 45.7% for AGIs over 200k)
Taxable interest for individuals: $1,193 (reported on 31.6% of returns)
This zip code:
$1,193
Illinois:
$1,969
(% of AGI for various income ranges: 0.7% for AGIs below $25k, 0.4% for AGIs $25k-50k, 0.6% for AGIs $50k-75k, 0.7% for AGIs $75k-100k, 0.9% for AGIs $100k-200k, 1.4% for AGIs over 200k)
Ordinary dividends: $4,681 (reported on 16.2% of returns)
Here:
$4,681
State:
$7,786
(% of AGI for various income ranges: 1.1% for AGIs below $25k, 0.7% for AGIs $25k-50k, 0.9% for AGIs $50k-75k, 1.2% for AGIs $75k-100k, 2.3% for AGIs $100k-200k, 3.0% for AGIs over 200k)
Net capital gain/loss in AGI: +$9,575 (reported on 10.4% of returns)
Here:
+$9,575
State:
+$22,183
(% of AGI for various income ranges: 0.3% for AGIs $50k-75k, 0.4% for AGIs $75k-100k, 1.6% for AGIs $100k-200k, 9.2% for AGIs over 200k)
Profit/loss from business: +$11,781 (reported on 11.6% of returns)
Here:
+$11,781
State:
+$12,903
(% of AGI for various income ranges: 6.1% for AGIs below $25k, 2.4% for AGIs $25k-50k, 1.4% for AGIs $50k-75k, 2.0% for AGIs $75k-100k, 2.1% for AGIs $100k-200k, 4.1% for AGIs over 200k)
Taxable individual retirement arrangement distribution: $13,308 (reported on 8.8% of returns)
61701:
$13,308
Illinois:
$17,929
(% of AGI for various income ranges: 2.0% for AGIs below $25k, 1.5% for AGIs $25k-50k, 2.1% for AGIs $50k-75k, 2.9% for AGIs $75k-100k, 3.0% for AGIs $100k-200k, 3.2% for AGIs over 200k)
Self-employment retirement plans: $25,140 (reported on 0.3% of returns)
61701:
$25,140
Illinois:
$24,666
Total itemized deductions: $19,328 (20% of AGI, reported on 26.3% of returns)
Here:
$19,328
State:
$26,433
Here:
19.6% of AGI
State:
19.2% of AGI
(% of AGI for various income ranges: 5.9% for AGIs below $25k, 7.6% for AGIs $25k-50k, 10.9% for AGIs $50k-75k, 11.7% for AGIs $75k-100k, 13.1% for AGIs $100k-200k, 12.9% for AGIs over 200k)
Charity contributions: $4,110 (reported on 19.3% of returns)
Here:
$4,110
State:
$4,525
(% of AGI for various income ranges: 0.5% for AGIs below $25k, 0.8% for AGIs $25k-50k, 1.4% for AGIs $50k-75k, 1.8% for AGIs $75k-100k, 2.6% for AGIs $100k-200k, 2.5% for AGIs over 200k)
Taxes paid: $7,721 (reported on 26.0% of returns)
61701:
$7,721
State:
$11,968
(% of AGI for various income ranges: 1.2% for AGIs below $25k, 2.5% for AGIs $25k-50k, 3.9% for AGIs $50k-75k, 4.7% for AGIs $75k-100k, 5.8% for AGIs $100k-200k, 6.1% for AGIs over 200k)
Earned income credit: $2,233 (reported on 20.3% of returns)
Here:
$2,233
State:
$2,349
(% of AGI for various income ranges: 6.7% for AGIs below $25k, 0.8% for AGIs $25k-50k)
Percentage of individuals using paid preparers for their 2012 taxes: 46.4%
Here:
46%
State:
57%
(% for various income ranges: 42.9% for AGIs below $25k, 44.3% for AGIs $25k-50k, 50.2% for AGIs $50k-75k, 50.0% for AGIs $75k-100k, 56.3% for AGIs $100k-200k, 79.3% for AGIs over 200k)
Averages for the 2004 tax year for zip code 61701, filed in 2005:
Average Adjusted Gross Income (AGI) in 2004: $42,286 (Individual Income Tax Returns)
Here:
$42,286
State:
$54,625
Salary/wage: $35,013 (reported on 86.1% of returns)
Here:
$35,013
State:
$46,811
(% of AGI for various income ranges: 98.4% for AGIs below $10k, 78.5% for AGIs $10k-25k, 83.9% for AGIs $25k-50k, 81.2% for AGIs $50k-75k, 78.0% for AGIs $75k-100k, 49.3% for AGIs over 100k)
Taxable interest for individuals: $2,195 (reported on 42.1% of returns)
This zip code:
$2,195
Illinois:
$2,101
(% of AGI for various income ranges: 4.0% for AGIs below $10k, 2.2% for AGIs $10k-25k, 1.3% for AGIs $25k-50k, 1.6% for AGIs $50k-75k, 1.6% for AGIs $75k-100k, 3.3% for AGIs over 100k)
Taxable dividends: $3,501 (reported on 20.9% of returns)
Here:
$3,501
State:
$4,306
(% of AGI for various income ranges: 3.1% for AGIs below $10k, 1.2% for AGIs $10k-25k, 0.8% for AGIs $25k-50k, 1.2% for AGIs $50k-75k, 1.6% for AGIs $75k-100k, 2.9% for AGIs over 100k)
Net capital gain/loss: +$7,011 (reported on 14.3% of returns)
Here:
+$7,011
State:
+$17,321
(% of AGI for various income ranges: -0.4% for AGIs below $10k, 0.1% for AGIs $10k-25k, 0.3% for AGIs $25k-50k, 0.6% for AGIs $50k-75k, 0.9% for AGIs $75k-100k, 6.5% for AGIs over 100k)
Profit/loss from business: +$11,116 (reported on 11.9% of returns)
Here:
+$11,116
State:
+$11,771
(% of AGI for various income ranges: 6.2% for AGIs below $10k, 3.1% for AGIs $10k-25k, 2.0% for AGIs $25k-50k, 1.9% for AGIs $50k-75k, 2.2% for AGIs $75k-100k, 4.8% for AGIs over 100k)
Profit/loss from farming: +$1,625 (reported on 0.3% of returns)
Here:
+$1,625
State:
+$2,327
IRA payment deduction: $2,512 (reported on 1.8% of returns)
61701:
$2,512
Illinois:
$3,087
(% of AGI for various income ranges: 0.2% for AGIs below $10k, 0.2% for AGIs $10k-25k, 0.2% for AGIs $25k-50k, 0.1% for AGIs $50k-75k, 0.1% for AGIs $75k-100k, 0.0% for AGIs over 100k)
Self-employed pension: $16,552 (reported on 0.5% of returns)
Here:
$16,552
Illinois:
$16,965
Total itemized deductions: $15,953 (19% of AGI, reported on 27.6% of returns)
Here:
$15,953
State:
$20,239
Here:
18.5% of AGI
State:
19.5% of AGI
(% of AGI for various income ranges: 9.6% for AGIs below $10k, 7.1% for AGIs $10k-25k, 9.2% for AGIs $25k-50k, 11.6% for AGIs $50k-75k, 12.3% for AGIs $75k-100k, 11.1% for AGIs over 100k)
Charity contributions deductions: $4,286 (5% of AGI, reported on 22.8% of returns)
Here:
$4,286
State:
$3,719
Here:
4.5% of AGI
State:
3.4% of AGI
(% of AGI for various income ranges: 0.4% for AGIs below $10k, 0.8% for AGIs $10k-25k, 1.2% for AGIs $25k-50k, 1.9% for AGIs $50k-75k, 2.3% for AGIs $75k-100k, 4.0% for AGIs over 100k)
Total tax: $6,914 (reported on 75.5% of returns)
61701:
$6,914
State:
$9,882
(% of AGI for various income ranges: 2.1% for AGIs below $10k, 4.3% for AGIs $10k-25k, 7.8% for AGIs $25k-50k, 9.7% for AGIs $50k-75k, 11.5% for AGIs $75k-100k, 21.1% for AGIs over 100k)
Earned income credit: $1,673 (reported on 17.3% of returns)
Here:
$1,673
State:
$1,788
Percentage of individuals using paid preparers for their 2004 taxes: 52.2%
Here:
52%
State:
61%
(% for various income ranges: 49.1% for AGIs below $10k, 53.8% for AGIs $10k-25k, 50.5% for AGIs $25k-50k, 52.0% for AGIs $50k-75k, 51.1% for AGIs $75k-100k, 65.9% for AGIs over 100k)
Likely homosexual households (counted as self-reported same-sex unmarried-partner households)
Lesbian couples: 0.1% of all households
Gay men: 0.2% of all households
Household received Food Stamps/SNAP in the past 12 months: 3,327 Household did not receive Food Stamps/SNAP in the past 12 months: 13,262
Women who had a birth in the past 12 months: 539 (319 now married, 220 unmarried) Women who did not have a birth in the past 12 months: 8,471 (2,302 now married, 6,206 unmarried)
Housing units in zip code 61701 with a mortgage: 5,917 (474 second mortgage, 10 home equity loan, 307 both second mortgage and home equity loan) Houses without a mortgage: 50
Median monthly owner costs for units with a mortgage: $1,140 Median monthly owner costs for units without a mortgage: $528
Residents with income below the poverty level in 2022:
This zip code:
19.4%
Whole state:
11.9%
Residents with income below 50% of the poverty level in 2022:
This zip code:
6.3%
Whole state:
5.7%
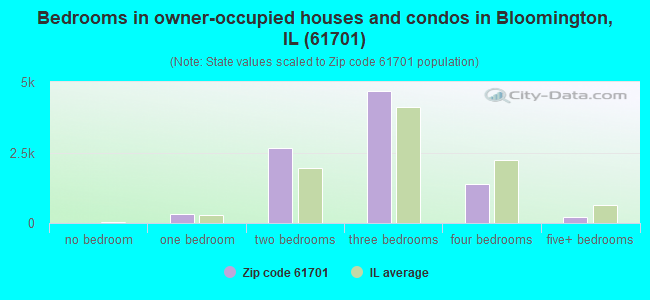
Median number of rooms in houses and condos:
Here:
6.2
State:
6.4
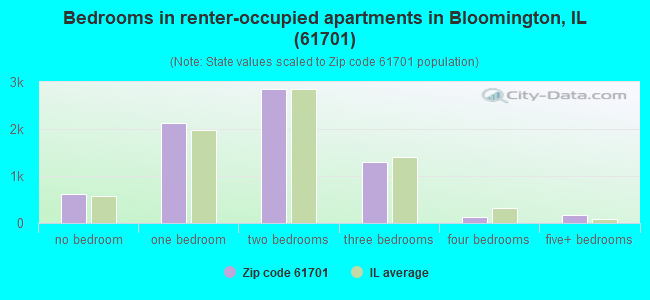
Median number of rooms in apartments:
Here:
3.8
State:
4.1
Notable locations in this zip code not listed on our city pages
Notable locations in zip code 61701: Lakeside Country Club (A), Bible Garden (B), Mark Evans Observatory (C), Highland Park Golf Course (D), Bloomington Country Club (E), Lincoln Leisure Center (F), McLean County Courthouse (G), Bloomington City Hall (H), Alice Miller Center for the Fine Arts (I), Arnold Cabana (J), Blackstock Hall (K), Bloomington Township Fire Protection District Station 2 (L), Buck Memorial Library (M), Dodds Hall (N), Dolan Hall (O), DeMotte Hall (P), Fort Natatorium (Q), Gulick Hall (R), Kemp Hall (S), Magil Hall (T). Display/hide their locations on the map
Shopping Centers: Towanda Plaza Shopping Center (1), Colonial Plaza Shopping Center (2), Eastland Mall Shopping Center (3), Empire Plaza Shopping Center (4). Display/hide their locations on the map
Churches in zip code 61701 include: Bethel Church (A), Bloomington Bible Church (B), Bloomington West Church of God (C), Centennial Christian Church (D), Christ Temple Pentecostal Church (E), Evelyn Chapel (F), Faith Fellowship Church (G), First Baptist Church of Bloomington (H), First Christian Church (I). Display/hide their locations on the map
Parks in zip code 61701 include: Holiday Park (1), O'Neil Park (2), Evergreen Park (3), White Place Historic District (4), Wilder Field (5), Forest Park (6), Miller Park (7), Buckmann Park (8), Ewing Park (9). Display/hide their locations on the map
3,308 married couples with children.
2,691 single-parent households (646 men, 2,045 women).
89.5% of residents of 61701 zip code speak English at home.
4.8% of residents speak Spanish at home (63% very well, 21% well, 14% not well, 2% not at all).
1.5% of residents speak other Indo-European language at home (76% very well, 24% well).
2.8% of residents speak Asian or Pacific Island language at home (49% very well, 19% well, 32% not well).
0.8% of residents speak other language at home (56% very well, 33% well, 11% not well).
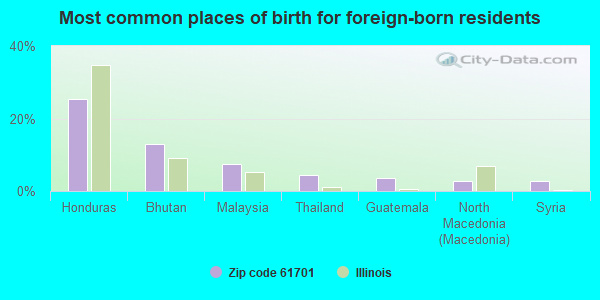
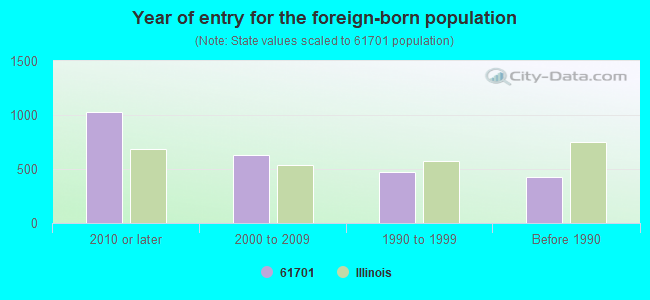
Foreign born population: 2,041 (5.8%) (49.3% of them are naturalized citizens)
Major facilities with environmental interests located in this zip code:
MCLEAN COUNTY CONCRETE CO (1100 W MARKET ST in BLOOMINGTON, IL)
STATE MASTER (Illinois EPA Project) - SOLID WASTE PROGRAM, HAZARDOUS WASTE PROGRAM, AIR PROGRAM STATE MASTER (Illinois EPA Project) - National Pollutant Discharge Elimination System Permit AIR MINOR (AIRS/AFS) CRITERIA AND HAZARDOUS AIR POLLUTANT INVENTORY (Inventory of air pollution sources) National Pollutant Discharge Elimination System NON-MAJOR (Tracking pollutant discharge elimination systems) - permit National Pollutant Discharge Elimination System NON-MAJOR (Tracking pollutant discharge elimination systems) - permit (Resource Conservation and Recovery Act (tracking hazardous waste)) Business SIC classification: READY-MIXED CONCRETE Business NAICS classification: READY-MIX CONCRETE MANUFACTURING. Organizations: MCLEAN COUNTY ASPHALT CO., INC (CONTACT/OWNER)
, KAUFMAN RANDALL G (CONTACT/OWNER)
Alternative names: MCLEAN CO ASPHALT CO INC, MCLEAN COUNTY ASPHALT CO., INC, YUTON ASPHALT PLANT
ROWE CONSTRUCTION CO-PLANT 170 (MARKET ST AND MARTIN LUTHER KI in BLOOMINGTON, IL)
STATE MASTER (Illinois EPA Project) - AIR PROGRAM AIR MINOR (AIRS/AFS) CRITERIA AND HAZARDOUS AIR POLLUTANT INVENTORY (Inventory of air pollution sources) Business SIC classification: READY-MIXED CONCRETE Alternative names: ROWE CONSTRUCTION COMPANY
BLOOMINGTON HIGH SCHOOL (1202 E LOCUST in BLOOMINGTON, IL)
STATE MASTER (Illinois EPA Project) - SOLID WASTE PROGRAM, HAZARDOUS WASTE PROGRAM (Geographic Names Information System) COMPLIANCE ACTIVITY (Tracking inspections of insecticide, fungicide, and rodenticide, and toxic substances) (National Center for Education Statistics) - STATE ID-1706408700001 Small Quantity Generators, between 100 kg and 1000 kg of hazardous waste/month (Resource Conservation and Recovery Act (tracking hazardous waste)) - notification Organizations: DISTRICT 87 (CONTACT/OWNER)
, BLOOMINGTON SCH DIST 87 (SCHOOL DISTRICT)
Alternative names: BLOOMINGTON AREA VOC CTR
MCLEAN COUNTY SERVICE CO (1300 W WASHINGTON ST in BLOOMINGTON, IL)
STATE MASTER (Illinois EPA Project) - AIR PROGRAM STATE MASTER (Illinois EPA Project) - SOLID WASTE PROGRAM, HAZARDOUS WASTE PROGRAM AIR MINOR (AIRS/AFS) Small Quantity Generators, between 100 kg and 1000 kg of hazardous waste/month (Resource Conservation and Recovery Act (tracking hazardous waste)) - notification Business SIC classification: GRAIN AND FIELD BEANS Organizations: CIBA-GEIGY CORP (CONTACT/OWNER)
Alternative names: CIBA SEEDS
LINCOLN TRUCK & AUTO PARTS INC (1800 W OAKLAND AVE in BLOOMINGTON, IL)
STATE MASTER (Illinois EPA Project) - HAZARDOUS WASTE PROGRAM, SCRAP TIRE MANAGEMENT STATE MASTER (Illinois EPA Project) - National Pollutant Discharge Elimination System Permit National Pollutant Discharge Elimination System NON-MAJOR (Tracking pollutant discharge elimination systems) - permit Small Quantity Generators, between 100 kg and 1000 kg of hazardous waste/month (Resource Conservation and Recovery Act (tracking hazardous waste)) - notification Organizations: DENNIS WILLIAM (CONTACT/OWNER)
Alternative names: LINCOLN TRUCK AND AUTO
MIDWEST PAPER STOCK INC (1712 S. BUNN STREET in BLOOMINGTON, IL)
STATE MASTER (Illinois EPA Project) - SOLID WASTE PROGRAM, SCRAP TIRE MANAGEMENT STATE MASTER (Illinois EPA Project) - National Pollutant Discharge Elimination System Permit National Pollutant Discharge Elimination System NON-MAJOR (Tracking pollutant discharge elimination systems) - permit Organizations: MIDWEST PAPER STOCK, INC. (CONTACT/OWNER)
NESTLE USA-BLOOMINGTON (2501 BEICH ROAD in BLOOMINGTON, IL)
STATE MASTER (Illinois EPA Project) - National Pollutant Discharge Elimination System Permit AIR MINOR (AIRS/AFS) COMPLIANCE ACTIVITY (Tracking inspections of insecticide, fungicide, and rodenticide, and toxic substances) CRITERIA AND HAZARDOUS AIR POLLUTANT INVENTORY (Inventory of air pollution sources) National Pollutant Discharge Elimination System NON-MAJOR (Tracking pollutant discharge elimination systems) - permit Small Quantity Generators, between 100 kg and 1000 kg of hazardous waste/month (Resource Conservation and Recovery Act (tracking hazardous waste)) - notification Business SIC classification: CANDY AND OTHER CONFECTIONERY PRODUCTS Organizations: NESTLE BEICH CO INC (CONTACT/OWNER)
Alternative names: BEICH KATHRYN INC, NESTLE BEICH INC, NESTLE UNITED STATES OF AMERICA INCORPORATED CHOCOLATE&CONFECTIONS
NICOR GAS (1201 WEST WASHINGTON STREET in BLOOMINGTON, IL)
STATE MASTER (Illinois EPA Project) - SOLID WASTE PROGRAM, HAZARDOUS WASTE PROGRAM, AIR PROGRAM AIR MINOR (AIRS/AFS) CRITERIA AND HAZARDOUS AIR POLLUTANT INVENTORY (Inventory of air pollution sources) HAZARDOUS WASTE BIENNIAL REPORTER (Resource Conservation and Recovery Act (tracking hazardous waste)) Large Quantity Generators, more that 1000 kg of hazardous waste/month (Resource Conservation and Recovery Act (tracking hazardous waste)) Business SIC classification: NATURAL GAS DISTRIBUTION
PURINA MILLS INC (113 S. EUCLID ST. in BLOOMINGTON, IL)
STATE MASTER (Illinois EPA Project) - SOLID WASTE PROGRAM, AIR PROGRAM AIR MINOR (AIRS/AFS) CRITERIA AND HAZARDOUS AIR POLLUTANT INVENTORY (Inventory of air pollution sources) National Pollutant Discharge Elimination System NON-MAJOR (Tracking pollutant discharge elimination systems) - permit TRI REPORTER (Tracking of toxic chemicals releasing facilities) Business SIC classification: PREPARED FEEDS AND FEED INGREDIENTS FOR ANIMALS AND FOWLS, EXCEPT DOGS AND CATS Organizations: PURINA MILLS, INC. (CONTACT/OWNER)
IC MATERIALS INC (917 EAST GROVE STREET in BLOOMINGTON, IL)
STATE MASTER (Illinois EPA Project) - National Pollutant Discharge Elimination System Permit AIR MINOR (AIRS/AFS) CRITERIA AND HAZARDOUS AIR POLLUTANT INVENTORY (Inventory of air pollution sources) National Pollutant Discharge Elimination System NON-MAJOR (Tracking pollutant discharge elimination systems) - permit Business SIC classification: READY-MIXED CONCRETE Business NAICS classification: READY-MIX CONCRETE MANUFACTURING. Organizations: I.C. MATERIALS, INC. (CONTACT/OWNER)
Alternative names: I.C. MATERIALS, INC., PRAIRIE MATERIAL SALES INC., PRAIRIE MATERIALS YARD 26
GROWMARK INC (1701 TOWANDA AVE-A in BLOOMINGTON, IL)
STATE MASTER (Illinois EPA Project) - SOLID WASTE PROGRAM, HAZARDOUS WASTE PROGRAM STATE MASTER (New Jersey environmental info) - NJEMS-003437, PESTICIDES - MANUFACTURE Small Quantity Generators, between 100 kg and 1000 kg of hazardous waste/month (Resource Conservation and Recovery Act (tracking hazardous waste)) - notification Organizations: UNIVERSAL COOPERATIVES INC Alternative names: GROW MARK INC
PANTAGRAPH, THE (301 W WASHINGTON ST in BLOOMINGTON, IL)
STATE MASTER (Illinois EPA Project) - SOLID WASTE PROGRAM, HAZARDOUS WASTE PROGRAM, AIR PROGRAM AIR MINOR (AIRS/AFS) CRITERIA AND HAZARDOUS AIR POLLUTANT INVENTORY (Inventory of air pollution sources) Large Quantity Generators, more that 1000 kg of hazardous waste/month (Resource Conservation and Recovery Act (tracking hazardous waste)) - notification Business SIC classification: COMMERCIAL PRINTING, LITHOGRAPHIC Organizations: CHRONCLE PUBLISHING (CONTACT/OWNER)
Alternative names: PANTAGRAPH PUBLISHING CO
Housing units lacking complete plumbing facilities: 0.7% Housing units lacking complete kitchen facilities: 1.6%
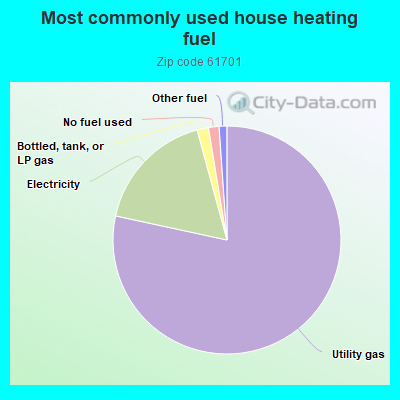
78.4%Utility gas
17.4%Electricity
1.6%Bottled, tank, or LP gas
1.5%No fuel used
1.1%Other fuel
Population in 1990: 35,218. Population change in the 1990s: +2,022 (+5.7%).
Place of birth for U.S.-born residents:
This state: 25,981
Northeast: 658
Midwest: 3,217
South: 1,340
West: 1,255
46% of the 61701 zip code residents lived in the same house 5 years ago. Out of people who lived in different houses, 58% lived in this county. Out of people who lived in different counties, 50% lived in Illinois.
89% of the 61701 zip code residents lived in the same house 1 year ago. Out of people who lived in different houses, 60% moved from this county. Out of people who lived in different houses, 19% moved from different county within same state. Out of people who lived in different houses, 10% moved from different state. Out of people who lived in different houses, 12% moved from abroad.
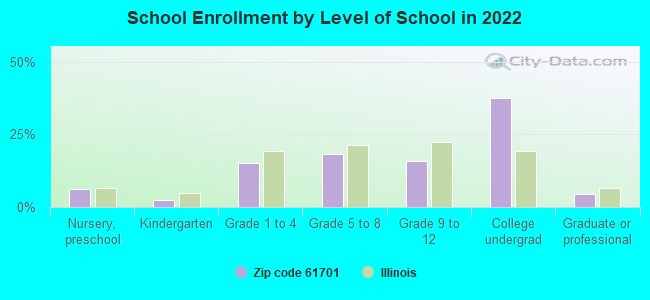
Private vs. public school enrollment:
Students in private schools in grades 1 to 8 (elementary and middle school): 396
Here:
13.2%
Illinois:
13.3%
Students in private schools in grades 9 to 12 (high school): 144
Here:
10.0%
Illinois:
9.9%
Students in private undergraduate colleges: 874
Here:
25.7%
Illinois:
27.4%
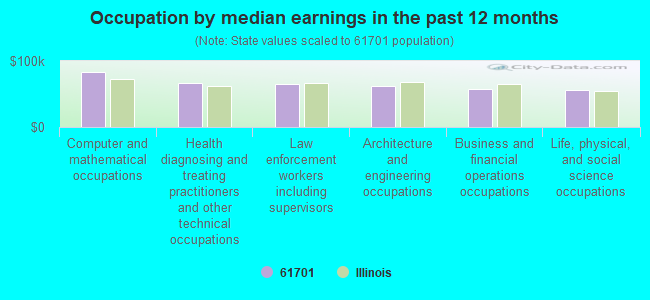
Occupation by median earnings in the past 12 months ($)
83,625Computer and mathematical occupations
66,252Health diagnosing and treating practitioners and other technical occupations
65,301Law enforcement workers including supervisors
62,848Architecture and engineering occupations
57,911Business and financial operations occupations
55,749Life, physical, and social science occupations
Companies with federal contracts located in this zip code (BLOOMINGTON, IL):
BBA ENGINEERING, P C (1509 N CLINTON BLVD; small business) : $2,793,519 in 61 contractsfrom 1999 to 2004
Contracts for Architect - Engineer Services (including landscaping, interior layout, and designing) by Air Force Signed by year:2000: $649,568; 2001: $1,295,651; 2002: $253,571; 2003: $300,492; 2004: $172,961; 2005: $0; 2006: $0.
Biggest contracts:
$342,014 with Air Force for Architect - Engineer Services (including landscaping, interior layout, and designing). Signed on 2001-09-05. Completion date: 2001-12-06.
$249,123, same as above.Signed on 2001-03-08. Completion date: 2001-09-08.
$240,000, same as above.Signed on 2001-04-16. Completion date: 2001-03-16.
$193,171, same as above.Signed on 2001-03-21. Completion date: 2001-03-21.
TRACKING AND IMAGING SYSTEMS I (118 WEST WASHINGTON STREET; small business) : $2,190,206 in 12 contractsfrom 2000 to 2005
Contracts for Defense Electronics and Communication Equipment -- Advanced Development (R&D), Defense Electronics and Communication Equipment -- Basic Research (R&D), Defense Electronics and Communication Equipment -- Management and Support (R&D), Defense Electronics and Communication Equipment -- Applied Research and Exploratory Development (R&D) by Air Force, Navy Signed by year:2000: $465,000; 2001: $446,346; 2002: $151,302; 2003: $450,000; 2004: $521,558; 2005: $156,000; 2006: $0.
Biggest contracts:
$350,000 with Air Force for Defense Electronics and Communication Equipment -- Advanced Development (R&D). Signed on 2000-08-01. Completion date: 2002-06-05.
$300,000 with Navy for Defense Electronics and Communication Equipment -- Basic Research (R&D). Signed on 2003-08-08. Completion date: 2005-03-04.
$278,317 with Air Force for Defense Electronics and Communication Equipment -- Management and Support (R&D). Signed on 2001-02-02. Completion date: 2002-08-08.
$260,779 with Navy for Defense Electronics and Communication Equipment -- Basic Research (R&D). Signed on 2004-05-27. Completion date: 2005-03-04.
QUALITY TRUCK & EQUIPMENT CO I (1201 E BELL; small business) : $194,095 in 2 contractsfrom 2005 to 2006
$190,670 with Air Force for Tractors, Wheeled. Signed on 2005-09-30. Completion date: 2006-03-06.
$3,425 with Army for Road Clearing, Cleaning and Marking Equipment. Signed on 2006-02-04. Completion date: 2006-02-24.
REDBIRD CATERING INC (1507 N MAIN ST; small business) : $9,498 in 2 contractsfrom 2004 to 2006
$6,066 with Army for Meat, Poultry, and Fish. Signed on 2006-01-10. Completion date: 2006-01-10.
$3,432, same as above.Signed on 2004-01-09. Completion date: 2004-01-11.
LONGVIEW, INC (609 HANNAH ST; small business)
$6,350 with Army for Meat, Poultry, and Fish. Signed on 2006-02-15. Completion date: 2006-02-13.
CENTRAL ILLINOIS DOOR, INC (1101 E LINCOLN ST; small business)
$3,458 with U.S. Army Corps of Engineers - civil program financing only for Fencing, Fences, Gates and Components. Signed on 2003-03-27. Completion date: 2003-02-03.
Top industries in this zip code by the number of employees in 2005:
Finance and Insurance: Direct Property and Casualty Insurance Carriers (over 1000 employees: 1 establishment)
Educational Services: Colleges, Universities, and Professional Schools (over 1000: 1)
Health Care and Social Assistance: Offices of Physicians (except Mental Health Specialists) (100-249: 1, 50-99: 2, 20-49: 7, 10-19: 10, 5-9: 7, 1-4: 11)
Administrative and Support and Waste Management and Remediation Services: Collection Agencies (500-999: 1, 5-9: 2, 1-4: 1)
Health Care and Social Assistance: General Medical and Surgical Hospitals (500-999: 1)
People in group quarters in 2010:
1,427 people in college/university student housing
238 people in nursing facilities/skilled-nursing facilities
235 people in local jails and other municipal confinement facilities
119 people in emergency and transitional shelters (with sleeping facilities) for people experiencing homelessness
61 people in other noninstitutional facilities
57 people in group homes intended for adults
51 people in residential treatment centers for juveniles (non-correctional)
People in group quarters in 2000:
1,578 people in college dormitories (includes college quarters off campus)
275 people in nursing homes
203 people in local jails and other confinement facilities (including police lockups)
123 people in other noninstitutional group quarters
109 people in homes or halfway houses for drug/alcohol abuse
22 people in homes for abused, dependent, and neglected children
13 people in religious group quarters
7 people in homes for the mentally ill
Fatal accident statistics in 2014:
Fatal accident count: 2
Vehicles involved in fatal accidents: 3
Fatal accidents caused by drunken drivers: 1
Fatalities: 2
Persons involved in fatal accidents: 10
Pedestrians involved in fatal accidents: 1
Fatal accident statistics in 2013:
Fatal accident count: 1
Vehicles involved in fatal accidents: 1
Fatal accidents caused by drunken drivers: 0
Fatalities: 1
Persons involved in fatal accidents: 1
Pedestrians involved in fatal accidents: 1
Home Mortgage Disclosure Act Aggregated Statistics For Year 2009 (Based on 21 full and 4 partial tracts)
A) FHA, FSA/RHS & VA Home Purchase Loans
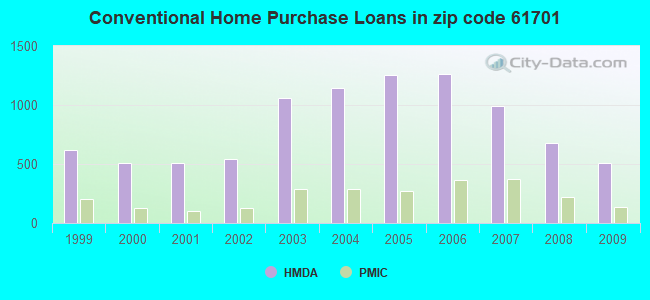
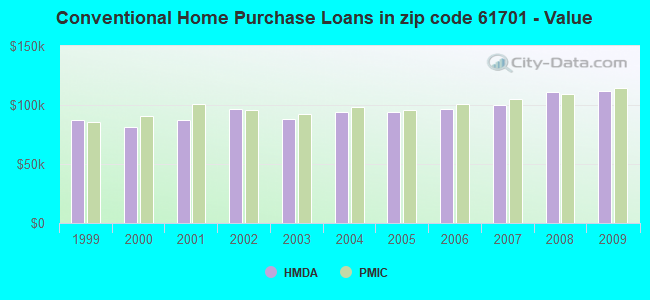
B) Conventional Home Purchase Loans
C) Refinancings
D) Home Improvement Loans
E) Loans on Dwellings For 5+ Families
F) Non-occupant Loans on < 5 Family Dwellings (A B C & D)
G) Loans On Manufactured Home Dwelling (A B C & D)
Number
Average Value
Number
Average Value
Number
Average Value
Number
Average Value
Number
Average Value
Number
Average Value
Number
Average Value
LOANS ORIGINATED
386
$109,746
511
$112,250
1,815
$119,772
98
$63,176
39
$449,935
256
$96,536
2
$30,620
APPLICATIONS APPROVED, NOT ACCEPTED
4
$94,558
15
$158,373
87
$118,250
19
$73,021
0
$0
7
$57,314
2
$21,050
APPLICATIONS DENIED
39
$111,696
32
$71,910
283
$114,020
56
$25,734
0
$0
29
$137,280
11
$19,312
APPLICATIONS WITHDRAWN
36
$102,006
32
$107,282
266
$116,454
9
$32,264
0
$0
23
$96,174
2
$67,530
FILES CLOSED FOR INCOMPLETENESS
4
$104,982
2
$79,845
29
$124,861
0
$0
0
$0
4
$80,490
0
$0
Aggregated Statistics For Year 2008 (Based on 21 full and 4 partial tracts)
A) FHA, FSA/RHS & VA Home Purchase Loans
B) Conventional Home Purchase Loans
C) Refinancings
D) Home Improvement Loans
E) Loans on Dwellings For 5+ Families
F) Non-occupant Loans on < 5 Family Dwellings (A B C & D)
G) Loans On Manufactured Home Dwelling (A B C & D)
Number
Average Value
Number
Average Value
Number
Average Value
Number
Average Value
Number
Average Value
Number
Average Value
Number
Average Value
LOANS ORIGINATED
296
$113,281
675
$110,784
907
$117,623
125
$59,815
31
$387,075
279
$84,946
8
$60,598
APPLICATIONS APPROVED, NOT ACCEPTED
6
$101,407
39
$102,051
77
$112,825
30
$50,723
1
$208,000
24
$118,391
2
$34,760
APPLICATIONS DENIED
33
$108,130
88
$97,182
355
$107,387
103
$51,815
0
$0
46
$81,669
22
$41,567
APPLICATIONS WITHDRAWN
37
$106,626
57
$126,023
145
$110,477
9
$58,239
1
$516,000
13
$75,152
2
$14,355
FILES CLOSED FOR INCOMPLETENESS
6
$141,973
7
$82,709
25
$124,719
0
$0
0
$0
8
$69,912
0
$0
Aggregated Statistics For Year 2007 (Based on 21 full and 4 partial tracts)
A) FHA, FSA/RHS & VA Home Purchase Loans
B) Conventional Home Purchase Loans
C) Refinancings
D) Home Improvement Loans
E) Loans on Dwellings For 5+ Families
F) Non-occupant Loans on < 5 Family Dwellings (A B C & D)
G) Loans On Manufactured Home Dwelling (A B C & D)
Number
Average Value
Number
Average Value
Number
Average Value
Number
Average Value
Number
Average Value
Number
Average Value
Number
Average Value
LOANS ORIGINATED
138
$104,614
993
$100,195
758
$100,476
148
$33,061
27
$966,696
230
$79,886
6
$78,218
APPLICATIONS APPROVED, NOT ACCEPTED
4
$77,835
46
$97,728
124
$88,518
33
$25,329
0
$0
12
$82,155
2
$37,320
APPLICATIONS DENIED
12
$91,322
85
$86,336
531
$114,497
150
$40,961
2
$489,350
48
$80,411
10
$30,652
APPLICATIONS WITHDRAWN
4
$98,398
56
$102,306
230
$116,915
10
$88,914
0
$0
17
$94,736
0
$0
FILES CLOSED FOR INCOMPLETENESS
0
$0
8
$94,099
66
$127,411
3
$23,660
0
$0
4
$108,298
0
$0
Aggregated Statistics For Year 2006 (Based on 21 full and 4 partial tracts)
A) FHA, FSA/RHS & VA Home Purchase Loans
B) Conventional Home Purchase Loans
C) Refinancings
D) Home Improvement Loans
E) Loans on Dwellings For 5+ Families
F) Non-occupant Loans on < 5 Family Dwellings (A B C & D)
G) Loans On Manufactured Home Dwelling (A B C & D)
Number
Average Value
Number
Average Value
Number
Average Value
Number
Average Value
Number
Average Value
Number
Average Value
Number
Average Value
LOANS ORIGINATED
206
$104,830
1,259
$96,209
810
$93,307
197
$35,470
12
$489,696
305
$88,170
21
$24,933
APPLICATIONS APPROVED, NOT ACCEPTED
2
$100,560
68
$96,077
124
$72,869
31
$23,686
0
$0
8
$72,939
13
$51,824
APPLICATIONS DENIED
10
$93,948
142
$80,329
628
$90,697
137
$39,010
0
$0
45
$82,523
26
$44,705
APPLICATIONS WITHDRAWN
10
$121,200
94
$98,701
301
$111,420
13
$39,374
0
$0
24
$96,393
0
$0
FILES CLOSED FOR INCOMPLETENESS
5
$95,994
32
$81,785
65
$99,643
5
$46,534
0
$0
4
$74,858
0
$0
Aggregated Statistics For Year 2005 (Based on 21 full and 4 partial tracts)
A) FHA, FSA/RHS & VA Home Purchase Loans
B) Conventional Home Purchase Loans
C) Refinancings
D) Home Improvement Loans
E) Loans on Dwellings For 5+ Families
F) Non-occupant Loans on < 5 Family Dwellings (A B C & D)
G) Loans On Manufactured Home Dwelling (A B C & D)
Number
Average Value
Number
Average Value
Number
Average Value
Number
Average Value
Number
Average Value
Number
Average Value
Number
Average Value
LOANS ORIGINATED
183
$102,861
1,253
$94,278
1,032
$93,286
187
$40,461
40
$331,504
399
$84,637
13
$24,291
APPLICATIONS APPROVED, NOT ACCEPTED
12
$88,403
97
$117,630
177
$88,631
44
$32,592
2
$119,940
21
$67,208
4
$14,832
APPLICATIONS DENIED
16
$78,307
147
$62,125
620
$91,212
140
$31,756
0
$0
65
$62,178
56
$25,598
APPLICATIONS WITHDRAWN
4
$94,250
141
$91,555
390
$105,429
37
$116,112
0
$0
36
$92,306
4
$39,340
FILES CLOSED FOR INCOMPLETENESS
3
$98,883
30
$108,667
147
$102,098
5
$32,962
0
$0
7
$106,723
2
$33,490
Aggregated Statistics For Year 2004 (Based on 21 full and 4 partial tracts)
A) FHA, FSA/RHS & VA Home Purchase Loans
B) Conventional Home Purchase Loans
C) Refinancings
D) Home Improvement Loans
E) Loans on Dwellings For 5+ Families
F) Non-occupant Loans on < 5 Family Dwellings (A B C & D)
G) Loans On Manufactured Home Dwelling (A B C & D)
Number
Average Value
Number
Average Value
Number
Average Value
Number
Average Value
Number
Average Value
Number
Average Value
Number
Average Value
LOANS ORIGINATED
235
$103,939
1,143
$93,650
1,431
$95,185
177
$37,557
35
$389,441
518
$81,056
19
$27,189
APPLICATIONS APPROVED, NOT ACCEPTED
12
$106,466
46
$81,157
173
$87,495
32
$31,121
0
$0
18
$73,052
6
$39,613
APPLICATIONS DENIED
9
$97,536
141
$58,270
639
$90,362
139
$32,158
0
$0
36
$75,903
64
$25,048
APPLICATIONS WITHDRAWN
5
$77,990
83
$94,576
498
$94,035
32
$48,881
0
$0
35
$92,205
2
$37,320
FILES CLOSED FOR INCOMPLETENESS
0
$0
13
$63,556
51
$118,131
7
$47,310
0
$0
6
$68,438
0
$0
Aggregated Statistics For Year 2003 (Based on 21 full and 4 partial tracts)
A) FHA, FSA/RHS & VA Home Purchase Loans
B) Conventional Home Purchase Loans
C) Refinancings
D) Home Improvement Loans
E) Loans on Dwellings For 5+ Families
F) Non-occupant Loans on < 5 Family Dwellings (A B C & D)
Number
Average Value
Number
Average Value
Number
Average Value
Number
Average Value
Number
Average Value
Number
Average Value
LOANS ORIGINATED
262
$101,329
1,060
$88,282
3,706
$92,867
152
$22,105
35
$365,052
529
$78,318
APPLICATIONS APPROVED, NOT ACCEPTED
15
$99,221
29
$73,629
242
$88,003
38
$23,558
0
$0
21
$85,715
APPLICATIONS DENIED
7
$88,837
159
$58,824
730
$81,828
103
$16,330
0
$0
36
$96,361
APPLICATIONS WITHDRAWN
3
$98,897
44
$86,383
472
$91,384
5
$24,310
1
$392,000
18
$68,004
FILES CLOSED FOR INCOMPLETENESS
2
$80,840
12
$107,046
40
$93,638
4
$25,888
0
$0
1
$67,000
Aggregated Statistics For Year 2002 (Based on 11 full and 4 partial tracts)
A) FHA, FSA/RHS & VA Home Purchase Loans
B) Conventional Home Purchase Loans
C) Refinancings
D) Home Improvement Loans
E) Loans on Dwellings For 5+ Families
F) Non-occupant Loans on < 5 Family Dwellings (A B C & D)
Number
Average Value
Number
Average Value
Number
Average Value
Number
Average Value
Number
Average Value
Number
Average Value
LOANS ORIGINATED
95
$93,882
545
$96,424
1,352
$104,358
70
$21,653
25
$299,104
290
$81,492
APPLICATIONS APPROVED, NOT ACCEPTED
4
$86,575
15
$76,323
82
$79,397
15
$22,774
0
$0
6
$86,502
APPLICATIONS DENIED
4
$83,995
53
$64,676
248
$80,304
37
$9,227
0
$0
16
$65,692
APPLICATIONS WITHDRAWN
3
$77,083
26
$101,237
136
$88,489
2
$26,815
0
$0
9
$94,180
FILES CLOSED FOR INCOMPLETENESS
0
$0
7
$85,527
12
$47,469
0
$0
0
$0
0
$0
Aggregated Statistics For Year 2001 (Based on 11 full and 4 partial tracts)
A) FHA, FSA/RHS & VA Home Purchase Loans
B) Conventional Home Purchase Loans
C) Refinancings
D) Home Improvement Loans
E) Loans on Dwellings For 5+ Families
F) Non-occupant Loans on < 5 Family Dwellings (A B C & D)
Number
Average Value
Number
Average Value
Number
Average Value
Number
Average Value
Number
Average Value
Number
Average Value
LOANS ORIGINATED
84
$92,750
506
$87,177
1,118
$97,220
124
$31,891
26
$251,963
299
$90,285
APPLICATIONS APPROVED, NOT ACCEPTED
8
$86,941
11
$48,530
80
$62,759
34
$30,455
6
$242,415
10
$73,289
APPLICATIONS DENIED
3
$89,277
62
$40,735
218
$91,437
57
$15,909
0
$0
16
$78,766
APPLICATIONS WITHDRAWN
0
$0
22
$56,475
120
$72,831
12
$33,884
0
$0
7
$68,421
FILES CLOSED FOR INCOMPLETENESS
0
$0
4
$110,135
20
$81,344
0
$0
0
$0
1
$58,000
Aggregated Statistics For Year 2000 (Based on 11 full and 4 partial tracts)
A) FHA, FSA/RHS & VA Home Purchase Loans
B) Conventional Home Purchase Loans
C) Refinancings
D) Home Improvement Loans
E) Loans on Dwellings For 5+ Families
F) Non-occupant Loans on < 5 Family Dwellings (A B C & D)
Number
Average Value
Number
Average Value
Number
Average Value
Number
Average Value
Number
Average Value
Number
Average Value
LOANS ORIGINATED
89
$90,673
511
$80,987
387
$91,856
180
$21,156
12
$284,820
195
$62,180
APPLICATIONS APPROVED, NOT ACCEPTED
5
$72,972
18
$72,417
62
$55,227
31
$19,422
0
$0
5
$60,028
APPLICATIONS DENIED
3
$93,157
124
$55,876
160
$57,897
108
$13,514
2
$196,930
26
$55,602
APPLICATIONS WITHDRAWN
5
$178,156
25
$86,609
75
$57,898
10
$19,198
2
$344,485
6
$133,155
FILES CLOSED FOR INCOMPLETENESS
0
$0
2
$67,965
19
$72,524
0
$0
0
$0
0
$0
Aggregated Statistics For Year 1999 (Based on 9 full and 3 partial tracts)
A) FHA, FSA/RHS & VA Home Purchase Loans
B) Conventional Home Purchase Loans
C) Refinancings
D) Home Improvement Loans
E) Loans on Dwellings For 5+ Families
F) Non-occupant Loans on < 5 Family Dwellings (A B C & D)
2002 - 2018 National Fire Incident Reporting System (NFIRS) incidents
Based on the data from the years 2002 - 2018 the average number of fire incidents per year is 131. The highest number of fires - 179 took place in 2005, and the least - 4 in 2009. The data has a decreasing trend.
When looking into fire subcategories, the most incidents belonged to: Structure Fires (42.4%), and Outside Fires (37.5%).
Fire incident types reported to NFIRS in Zip Code 61701


 Nearest zip codes: 61704, 61761, 61705, 61772, 61748, 61776.


 Based on the data from the years 2002 - 2018 the average number of fire incidents per year is 131. The highest number of fires - 179 took place in 2005, and the least - 4 in 2009. The data has a decreasing trend.
 When looking into fire subcategories, the most incidents belonged to: Structure Fires (42.4%), and Outside Fires (37.5%).