Races in Bartlett, Illinois (IL) Detailed Stats
Data:
Races - White alone (%)
Races - White alone (% change since 2000)
Races - Black alone (%)
Races - Black alone (% change since 2000)
Races - American Indian alone (%)
Races - American Indian alone (% change since 2000)
Races - Asian alone (%)
Races - Asian alone (% change since 2000)
Races - Hispanic (%)
Races - Hispanic (% change since 2000)
Races - Native Hawaiian and Other Pacific Islander alone (%)
Races - Native Hawaiian and Other Pacific Islander alone (% change since 2000)
Races - Two or more races(%)
Races - Two or more races(% change since 2000)
Races - Other race alone (%)
Races - Other race alone (% change since 2000)
Racial diversity
Place of birth - Born in state of residence (%)
Place of birth - Born in state of residence (%) - White
Place of birth - Born in state of residence (%) - Black or African American
Place of birth - Born in state of residence (%) - Asian
Place of birth - Born in state of residence (%) - Hispanic or Latino
Place of birth - Born in state of residence (%) - American Indian and Alaska Native
Place of birth - Born in state of residence (%) - Multirace
Place of birth - Born in state of residence (%) - Other Race
Place of birth - Born in other state (%)
Place of birth - Born in other state (%) - White
Place of birth - Born in other state (%) - Black or African American
Place of birth - Born in other state (%) - Asian
Place of birth - Born in other state (%) - Hispanic or Latino
Place of birth - Born in other state (%) - American Indian and Alaska Native
Place of birth - Born in other state (%) - Multirace
Place of birth - Born in other state (%) - Other Race
Place of birth - Native, outside of US (%)
Place of birth - Native, outside of US (%) - White
Place of birth - Native, outside of US (%) - Black or African American
Place of birth - Native, outside of US (%) - Asian
Place of birth - Native, outside of US (%) - Hispanic or Latino
Place of birth - Native, outside of US (%) - American Indian and Alaska Native
Place of birth - Native, outside of US (%) - Multirace
Place of birth - Native, outside of US (%) - Other Race
Place of birth - Foreign born (%)
Place of birth - Foreign born (%) - White
Place of birth - Foreign born (%) - Black or African American
Place of birth - Foreign born (%) - Asian
Place of birth - Foreign born (%) - Hispanic or Latino
Place of birth - Foreign born (%) - American Indian and Alaska Native
Place of birth - Foreign born (%) - Multirace
Place of birth - Foreign born (%) - Other Race
Residents speaking English at home (%)
Residents speaking English at home - Born in the United States (%)
Residents speaking English at home - Native, born elsewhere (%)
Residents speaking English at home - Foreign born (%)
Residents speaking Spanish at home (%)
Residents speaking Spanish at home - Born in the United States (%)
Residents speaking Spanish at home - Native, born elsewhere (%)
Residents speaking Spanish at home - Foreign born (%)
Residents speaking other language at home (%)
Residents speaking other language at home - Born in the United States (%)
Residents speaking other language at home - Native, born elsewhere (%)
Residents speaking other language at home - Foreign born (%)
Marital status - Never married (%)
Marital status - Now married (%)
Marital status - Separated (%)
Marital status - Widowed (%)
Marital status - Divorced (%)
Ancestries Reported - Arab (%)
Ancestries Reported - Czech (%)
Ancestries Reported - Danish (%)
Ancestries Reported - Dutch (%)
Ancestries Reported - English (%)
Ancestries Reported - French (%)
Ancestries Reported - French Canadian (%)
Ancestries Reported - German (%)
Ancestries Reported - Greek (%)
Ancestries Reported - Hungarian (%)
Ancestries Reported - Irish (%)
Ancestries Reported - Italian (%)
Ancestries Reported - Lithuanian (%)
Ancestries Reported - Norwegian (%)
Ancestries Reported - Polish (%)
Ancestries Reported - Portuguese (%)
Ancestries Reported - Russian (%)
Ancestries Reported - Scotch-Irish (%)
Ancestries Reported - Scottish (%)
Ancestries Reported - Slovak (%)
Ancestries Reported - Subsaharan African (%)
Ancestries Reported - Swedish (%)
Ancestries Reported - Swiss (%)
Ancestries Reported - Ukrainian (%)
Ancestries Reported - United States (%)
Ancestries Reported - Welsh (%)
Ancestries Reported - West Indian (%)
Ancestries Reported - Other (%)
Geographical mobility - Same house 1 year ago (%)
Geographical mobility - Same house 1 year ago (%) - White
Geographical mobility - Same house 1 year ago (%) - Black or African American
Geographical mobility - Same house 1 year ago (%) - Asian
Geographical mobility - Same house 1 year ago (%) - Hispanic or Latino
Geographical mobility - Same house 1 year ago (%) - American Indian and Alaska Native
Geographical mobility - Same house 1 year ago (%) - Multirace
Geographical mobility - Same house 1 year ago (%) - Other Race
Geographical mobility - Moved within same county (%)
Geographical mobility - Moved within same county (%) - White
Geographical mobility - Moved within same county (%) - Black or African American
Geographical mobility - Moved within same county (%) - Asian
Geographical mobility - Moved within same county (%) - Hispanic or Latino
Geographical mobility - Moved within same county (%) - American Indian and Alaska Native
Geographical mobility - Moved within same county (%) - Multirace
Geographical mobility - Moved within same county (%) - Other Race
Geographical mobility - Moved from different county within same state (%)
Geographical mobility - Moved from different county within same state (%) - White
Geographical mobility - Moved from different county within same state (%) - Black or African American
Geographical mobility - Moved from different county within same state (%) - Asian
Geographical mobility - Moved from different county within same state (%) - Hispanic or Latino
Geographical mobility - Moved from different county within same state (%) - American Indian and Alaska Native
Geographical mobility - Moved from different county within same state (%) - Multirace
Geographical mobility - Moved from different county within same state (%) - Other Race
Geographical mobility - Moved from different state (%)
Geographical mobility - Moved from different state (%) - White
Geographical mobility - Moved from different state (%) - Black or African American
Geographical mobility - Moved from different state (%) - Asian
Geographical mobility - Moved from different state (%) - Hispanic or Latino
Geographical mobility - Moved from different state (%) - American Indian and Alaska Native
Geographical mobility - Moved from different state (%) - Multirace
Geographical mobility - Moved from different state (%) - Other Race
Geographical mobility - Moved from abroad (%)
Geographical mobility - Moved from abroad (%) - White
Geographical mobility - Moved from abroad (%) - Black or African American
Geographical mobility - Moved from abroad (%) - Asian
Geographical mobility - Moved from abroad (%) - Hispanic or Latino
Geographical mobility - Moved from abroad (%) - American Indian and Alaska Native
Geographical mobility - Moved from abroad (%) - Multirace
Geographical mobility - Moved from abroad (%) - Other Race
Place of birth for the foreign-born population - Ireland (%)
Place of birth for the foreign-born population - Denmark (%)
Place of birth for the foreign-born population - Norway (%)
Place of birth for the foreign-born population - Sweden (%)
Place of birth for the foreign-born population - United Kingdom (%)
Place of birth for the foreign-born population - England (%)
Place of birth for the foreign-born population - Scotland (%)
Place of birth for the foreign-born population - Other Northern Europe (%)
Place of birth for the foreign-born population - Austria (%)
Place of birth for the foreign-born population - Belgium (%)
Place of birth for the foreign-born population - France (%)
Place of birth for the foreign-born population - Germany (%)
Place of birth for the foreign-born population - Netherlands (%)
Place of birth for the foreign-born population - Switzerland (%)
Place of birth for the foreign-born population - Other Western Europe (%)
Place of birth for the foreign-born population - Greece (%)
Place of birth for the foreign-born population - Italy (%)
Place of birth for the foreign-born population - Portugal (%)
Place of birth for the foreign-born population - Spain (%)
Place of birth for the foreign-born population - Other Southern Europe (%)
Place of birth for the foreign-born population - Albania (%)
Place of birth for the foreign-born population - Belarus (%)
Place of birth for the foreign-born population - Bosnia and Herzegovina (%)
Place of birth for the foreign-born population - Bulgaria (%)
Place of birth for the foreign-born population - Croatia (%)
Place of birth for the foreign-born population - Czechoslovakia (%)
Place of birth for the foreign-born population - Hungary (%)
Place of birth for the foreign-born population - Latvia (%)
Place of birth for the foreign-born population - Lithuania (%)
Place of birth for the foreign-born population - North Macedonia (Macedonia) (%)
Place of birth for the foreign-born population - Moldova (%)
Place of birth for the foreign-born population - Poland (%)
Place of birth for the foreign-born population - Romania (%)
Place of birth for the foreign-born population - Russia (%)
Place of birth for the foreign-born population - Serbia (%)
Place of birth for the foreign-born population - Ukraine (%)
Place of birth for the foreign-born population - Other Eastern Europe (%)
Place of birth for the foreign-born population - China (%)
Place of birth for the foreign-born population - Hong Kong (%)
Place of birth for the foreign-born population - Taiwan (%)
Place of birth for the foreign-born population - Japan (%)
Place of birth for the foreign-born population - Korea (%)
Place of birth for the foreign-born population - Other Eastern Asia (%)
Place of birth for the foreign-born population - Afghanistan (%)
Place of birth for the foreign-born population - Bangladesh (%)
Place of birth for the foreign-born population - India (%)
Place of birth for the foreign-born population - Iran (%)
Place of birth for the foreign-born population - Kazakhstan (%)
Place of birth for the foreign-born population - Nepal (%)
Place of birth for the foreign-born population - Pakistan (%)
Place of birth for the foreign-born population - Sri Lanka (%)
Place of birth for the foreign-born population - Uzbekistan (%)
Place of birth for the foreign-born population - Other South Central Asia (%)
Place of birth for the foreign-born population - Burma (%)
Place of birth for the foreign-born population - Cambodia (%)
Place of birth for the foreign-born population - Indonesia (%)
Place of birth for the foreign-born population - Laos (%)
Place of birth for the foreign-born population - Malaysia (%)
Place of birth for the foreign-born population - Philippines (%)
Place of birth for the foreign-born population - Singapore (%)
Place of birth for the foreign-born population - Thailand (%)
Place of birth for the foreign-born population - Vietnam (%)
Place of birth for the foreign-born population - Other South Eastern Asia (%)
Place of birth for the foreign-born population - Armenia (%)
Place of birth for the foreign-born population - Iraq (%)
Place of birth for the foreign-born population - Israel (%)
Place of birth for the foreign-born population - Jordan (%)
Place of birth for the foreign-born population - Kuwait (%)
Place of birth for the foreign-born population - Lebanon (%)
Place of birth for the foreign-born population - Saudi Arabia (%)
Place of birth for the foreign-born population - Syria (%)
Place of birth for the foreign-born population - Turkey (%)
Place of birth for the foreign-born population - Yemen (%)
Place of birth for the foreign-born population - Other Western Asia (%)
Place of birth for the foreign-born population - Eritrea (%)
Place of birth for the foreign-born population - Ethiopia (%)
Place of birth for the foreign-born population - Kenya (%)
Place of birth for the foreign-born population - Somalia (%)
Place of birth for the foreign-born population - Uganda (%)
Place of birth for the foreign-born population - Zimbabwe (%)
Place of birth for the foreign-born population - Other Eastern Africa (%)
Place of birth for the foreign-born population - Cameroon (%)
Place of birth for the foreign-born population - Congo (%)
Place of birth for the foreign-born population - Democratic Republic of Congo (Zaire) (%)
Place of birth for the foreign-born population - Other Middle Africa (%)
Place of birth for the foreign-born population - Egypt (%)
Place of birth for the foreign-born population - Morocco (%)
Place of birth for the foreign-born population - Sudan (%)
Place of birth for the foreign-born population - Other Northern Africa (%)
Place of birth for the foreign-born population - South Africa (%)
Place of birth for the foreign-born population - Other Southern Africa (%)
Place of birth for the foreign-born population - Cabo Verde (%)
Place of birth for the foreign-born population - Ghana (%)
Place of birth for the foreign-born population - Liberia (%)
Place of birth for the foreign-born population - Nigeria (%)
Place of birth for the foreign-born population - Senegal (%)
Place of birth for the foreign-born population - Sierra Leone (%)
Place of birth for the foreign-born population - Other Western Africa (%)
Place of birth for the foreign-born population - Australia (%)
Place of birth for the foreign-born population - New Zealand (%)
Place of birth for the foreign-born population - Fiji (%)
Place of birth for the foreign-born population - Micronesia (%)
Place of birth for the foreign-born population - Bahamas (%)
Place of birth for the foreign-born population - Barbados (%)
Place of birth for the foreign-born population - Cuba (%)
Place of birth for the foreign-born population - Dominica (%)
Place of birth for the foreign-born population - Dominican Republic (%)
Place of birth for the foreign-born population - Grenada (%)
Place of birth for the foreign-born population - Haiti (%)
Place of birth for the foreign-born population - Jamaica (%)
Place of birth for the foreign-born population - St. Vincent and the Grenadines (%)
Place of birth for the foreign-born population - Trinidad and Tobago (%)
Place of birth for the foreign-born population - West Indies (%)
Place of birth for the foreign-born population - Other Caribbean (%)
Place of birth for the foreign-born population - Belize (%)
Place of birth for the foreign-born population - Costa Rica (%)
Place of birth for the foreign-born population - El Salvador (%)
Place of birth for the foreign-born population - Guatemala (%)
Place of birth for the foreign-born population - Honduras (%)
Place of birth for the foreign-born population - Mexico (%)
Place of birth for the foreign-born population - Nicaragua (%)
Place of birth for the foreign-born population - Panama (%)
Place of birth for the foreign-born population - Other Central America (%)
Place of birth for the foreign-born population - Argentina (%)
Place of birth for the foreign-born population - Bolivia (%)
Place of birth for the foreign-born population - Brazil (%)
Place of birth for the foreign-born population - Chile (%)
Place of birth for the foreign-born population - Colombia (%)
Place of birth for the foreign-born population - Ecuador (%)
Place of birth for the foreign-born population - Guyana (%)
Place of birth for the foreign-born population - Peru (%)
Place of birth for the foreign-born population - Uruguay (%)
Place of birth for the foreign-born population - Venezuela (%)
Place of birth for the foreign-born population - Other South America (%)
Place of birth for the foreign-born population - Canada (%)
Place of birth for the foreign-born population - Other Northern America (%)
Place of birth for the foreign-born population - Other (%)
Latest news about races in Bartlett, IL collected exclusively by city-data.com from local newspapers, TV, and radio stations
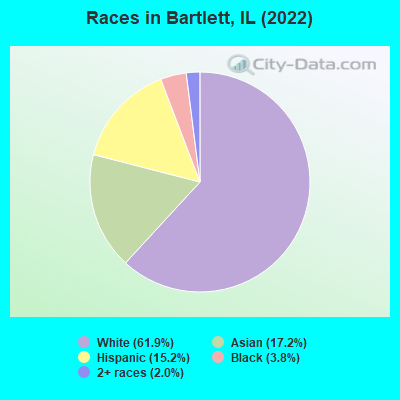
According to 2022 data, the most numerous races in Bartlett, IL are White alone (24,719 residents), Hispanic (6,074 residents), and Black alone (1,502 residents). 69.7% of Bartlett residents speak English at home. 20.5% of Bartlett, IL residents are foreign-born (11.4% born in Asia, 4.8% born in Europe, 3.8% born in Latin America), which is 31.7% greater than the foreign-born rate of 14.0% across the entire state of Illinois.
Race distribution in Bartlett
2000 2022
8,424,140 67.8% White alone 1,856,152 14.9% Black alone 1,530,262 12.3% Hispanic 419,916 3.4% Asian alone 153,996 1.2% Two or more races 13,479 0.1% Other race alone 18,232 0.1% American Indian alone 3,116 0.03% Native Hawaiian and Other
7,356,301 58.5% White alone 2,299,726 18.3% Hispanic 1,660,423 13.2% Black alone 747,296 5.9% Asian alone 458,599 3.6% Two or more races 45,386 0.4% Other race alone 10,405 0.08% American Indian alone 3,896 0.03% Native Hawaiian and Other
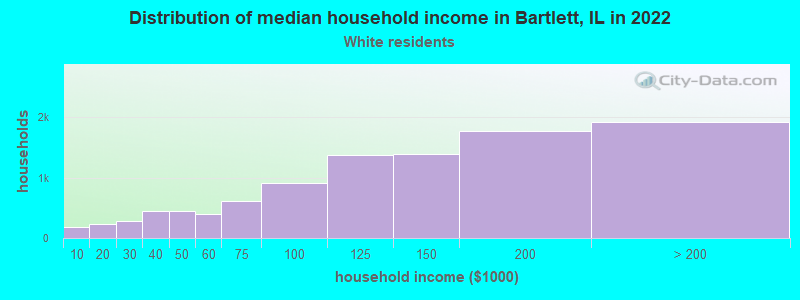
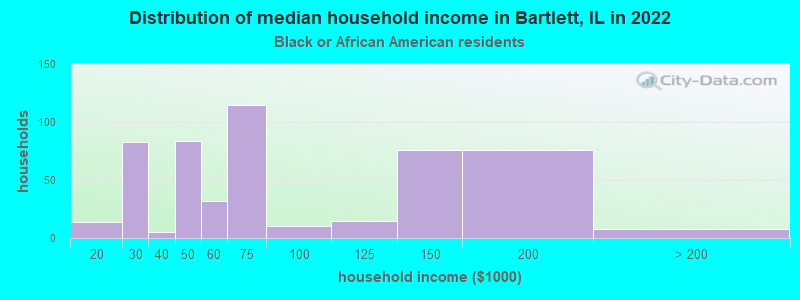
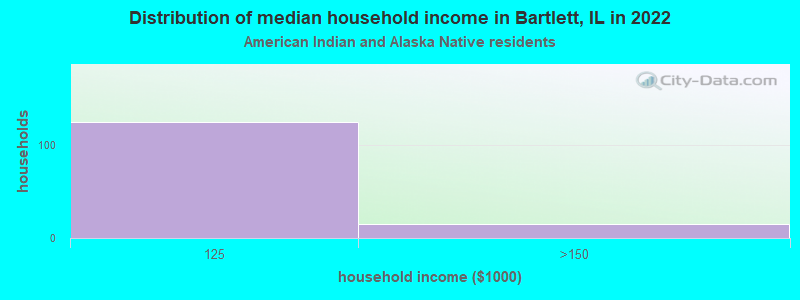
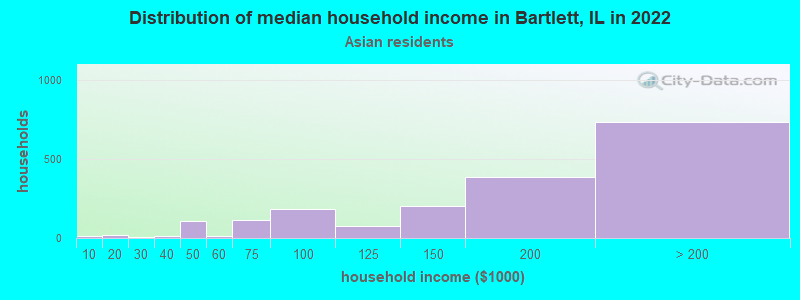
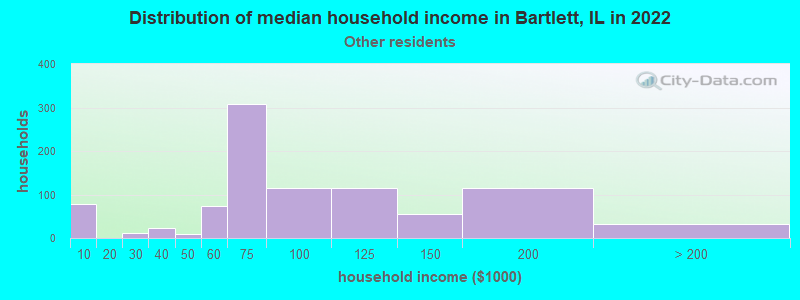
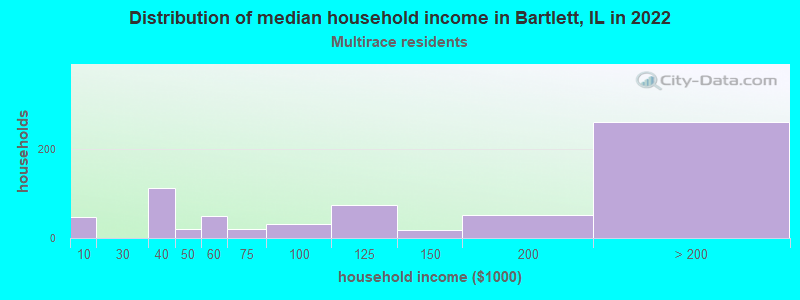
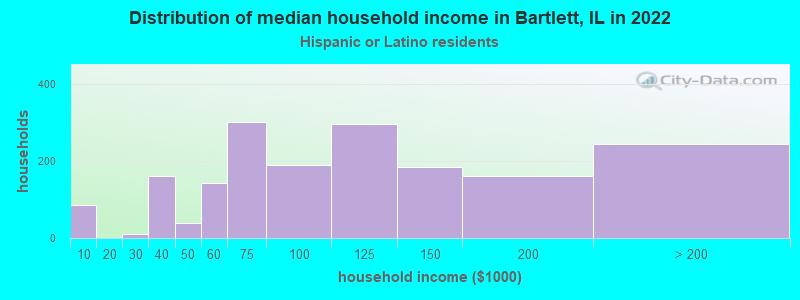
Income and house value in Bartlett Median household income in 2022 $124,763 White non-Hispanic householders$68,582 Black householders$109,230 American Indian and Alaska Native householders$165,279 Asian householders$77,937 Some other race householders$99,688 Hispanic or Latino race householdersMedian 2022 house value $352,535 White Non-Hispanic householders$295,652 Black or African American householders $383,484 Asian householders$291,849 Some other race householders$371,208 Two or more races householders$300,148 Hispanic or Latino householders
Median age by race in Bartlett
46.7 Median age for White residents45.1 48.6 41.6 Median age for Black or African American residents36.8 46.3 22.0 Median age for American Indian / Alaska Native residents32.5 14.9 41.0 Median age for Asian residents40.1 42.0 -687,999,999.3 Median age for Native Hawaiian / Pacific Islander residents-918,721,460.3 -610,229,276.3 30.0 Median age for Other race residents30.8 25.1 28.5 Median age for Two or more races residents25.0 30.5 47.4 Median age for White alone residents45.3 48.9 29.2 Median age for Hispanic or Latino residents31.4 24.2
Owner/renter occupied households by race in Bartlett
House owners and renters - White residents 8,781 87.9% Owner occupied1,204 12.1% Renter occupiedHouse owners and renters - Black or African American residents 460 86.1% Owner occupied74 13.9% Renter occupiedHouse owners and renters - American Indian / Alaska Native residents 30 23.9% Owner occupied96 76.1% Renter occupiedHouse owners and renters - Asian residents 1,874 95.7% Owner occupied85 4.3% Renter occupiedHouse owners and renters - Native Hawaiian / Pacific Islander residents 42 100.0% Renter occupiedHouse owners and renters - Other race residents 498 55.6% Owner occupied398 44.4% Renter occupiedHouse owners and renters - Two or more races residents 590 84.8% Owner occupied105 15.2% Renter occupiedHouse owners and renters - White alone residents 8,933 89.0% Owner occupied1,108 11.0% Renter occupiedHouse owners and renters - Hispanic or Latino residents 1,127 62.2% Owner occupied684 37.8% Renter occupied
Language usage in Bartlett
English speakers - Total 69.7% of residents of Bartlett speak English at home.
9.4% of residents speak Spanish at home 2,080 59.1% Speak English very well1,442 40.9% Speak English less than very well20.9% of residents speak other language at home 5,502 70.4% Speak English very well2,314 29.6% Speak English less than very well
English speakers - Born in the United States 89.0% of residents of Bartlett speak English at home.
9.3% of residents speak Spanish at home 342 70.2% Speak English very well145 29.8% Speak English less than very well1.4% of residents speak other language at home 74 100.0% Speak English very well
English speakers - Native, born elsewhere 16.9% of residents of Bartlett speak English at home.
59.3% of residents speak Spanish at home 26 14.9% Speak English very well149 85.1% Speak English less than very well19.3% of residents speak other language at home 40 70.2% Speak English very well17 29.8% Speak English less than very well
English speakers - Foreign-born 9.0% of residents of Bartlett speak English at home.
17.2% of residents speak Spanish at home 596 42.4% Speak English very well810 57.6% Speak English less than very well73.6% of residents speak other language at home 3,823 63.5% Speak English very well2,201 36.5% Speak English less than very well
White (Caucasian) - Speak only English Native:
97.3% (20,613)Foreign-born:
10.2% (188)
White (Caucasian) - Speak another language Native:
5.2% (1,092)Foreign-born:
89.5% (1,642)
Black or African American - Speak only English Native:
98.9% (1,397)Foreign-born:
97.5% (40)
Black or African American - Speak another language Native:
1.0% (15)Foreign-born:
16.6% (7)
American Indian / Alaska Native - Speak another language Native:
5.7% (29)Foreign-born:
100.0% (17)
Asian - Speak only English Native:
56.4% (983)Foreign-born:
7.2% (335)
Asian - Speak another language Native:
43.6% (760)Foreign-born:
93.4% (4,356)
Other race - Speak only English Native:
24.1% (344)Foreign-born:
11.3% (124)
Other race - Speak another language Native:
75.8% (1,079)Foreign-born:
87.9% (967)
Two or more races - Speak only English Native:
64.7% (1,307)Foreign-born:
16.1% (46)
Two or more races - Speak another language Native:
34.2% (691)Foreign-born:
83.9% (241)
White alone - Speak only English Native:
94.8% (20,378)Foreign-born:
9.9% (196)
White alone - Speak another language Native:
4.9% (1,048)Foreign-born:
90.7% (1,796)
Hispanic or Latino - Speak only English Native:
47.1% (1,808)Foreign-born:
9.3% (144)
Hispanic or Latino - Speak another language Native:
53.8% (2,062)Foreign-born:
90.1% (1,400)
Foreign-born residents in Bartlett 8,186 residents are foreign born (11.4% Asia , 4.8% Europe , 3.8% Latin America ).
This city:
20.5%Illinois:
14.1%
Marital status for residents in Bartlett Marital status - White (Caucasian) population 15 years and over
Males 27.5% Never married65.2% Now married0.7% Separated1.9% Widowed4.6% DivorcedFemales 23.6% Never married62.6% Now married0.5% Separated7.8% Widowed5.4% DivorcedWomen who gave birth in the past 12 months Now married:
84.0% (248)Unmarried:
16.0% (47)
Women who did not give birth in the past 12 months Now married:
52.5% (2,279)Unmarried:
47.5% (2,063)
Marital status - Black or African American population 15 years and over
Males 69.6% Never married28.1% Now married0.0% Separated2.3% Widowed0.0% DivorcedFemales 55.0% Never married35.4% Now married1.2% Separated3.8% Widowed4.6% DivorcedWomen who did not give birth in the past 12 months Now married:
11.3% (41)Unmarried:
88.7% (319)
Marital status - American Indian / Alaska Native population 15 years and over
Males 50.8% Never married43.2% Now married0.0% Separated0.0% Widowed6.1% DivorcedFemales 45.7% Never married45.7% Now married0.0% Separated8.6% Widowed0.0% DivorcedWomen who did not give birth in the past 12 months Now married:
44.2% (90)Unmarried:
55.8% (114)
Marital status - Asian population 15 years and over
Males 28.6% Never married65.9% Now married0.2% Separated3.3% Widowed1.9% DivorcedFemales 16.5% Never married75.1% Now married0.0% Separated7.9% Widowed0.5% DivorcedWomen who gave birth in the past 12 months Now married:
100.0% (187)Unmarried:
0.0% (0)
Women who did not give birth in the past 12 months Now married:
66.4% (797)Unmarried:
33.6% (403)
Marital status - Other race population 15 years and over
Males 35.0% Never married59.3% Now married0.0% Separated2.0% Widowed3.7% DivorcedFemales 45.6% Never married45.4% Now married1.6% Separated5.3% Widowed2.1% DivorcedWomen who gave birth in the past 12 months Now married:
11.5% (7)Unmarried:
88.5% (52)
Women who did not give birth in the past 12 months Now married:
52.7% (421)Unmarried:
47.3% (378)
Marital status - Two or more races population 15 years and over
Males 40.9% Never married58.0% Now married0.0% Separated1.1% Widowed0.0% DivorcedFemales 24.5% Never married69.7% Now married0.0% Separated0.0% Widowed5.9% DivorcedWomen who did not give birth in the past 12 months Now married:
63.2% (279)Unmarried:
36.8% (162)
Marital status - White alone, not Hispanic / Latino population 15 years and over
Males 26.2% Never married66.2% Now married0.8% Separated2.0% Widowed4.8% DivorcedFemales 21.6% Never married64.0% Now married0.6% Separated8.2% Widowed5.7% DivorcedWomen who gave birth in the past 12 months Now married:
82.4% (249)Unmarried:
17.6% (53)
Women who did not give birth in the past 12 months Now married:
53.5% (2,343)Unmarried:
46.5% (2,036)
Marital status - Hispanic or Latino population 15 years and over
Males 40.6% Never married56.7% Now married0.0% Separated0.8% Widowed1.9% DivorcedFemales 43.8% Never married48.8% Now married0.7% Separated3.7% Widowed3.1% DivorcedWomen who gave birth in the past 12 months Now married:
44.6% (37)Unmarried:
55.4% (46)
Women who did not give birth in the past 12 months Now married:
51.1% (810)Unmarried:
48.9% (776)
Ancestries in Bartlett
2,671 13.4% Polish1,909 9.6% Italian1,546 7.8% German902 4.5% Irish775 3.9% American506 2.5% European358 1.8% English136 0.7% Greek105 0.5% Scottish78 0.4% Lithuanian73 0.4% Swedish54 0.3% Norwegian49 0.2% French41 0.2% Russian38 0.2% Romanian32 0.2% Czech32 0.2% Serbian28 0.1% Danish26 0.1% Scotch-Irish26 0.1% Albanian26 0.1% Bulgarian25 0.1% Hungarian25 0.1% Eastern European22 0.1% Belgian21 0.1% Assyrian18 0.09% Northern European18 0.09% French Canadian17 0.09% Dutch17 0.09% Czechoslovakian17 0.09% British16 0.08% Austrian16 0.08% Egyptian15 0.08% Ethiopian14 0.07% Croatian14 0.07% Lebanese14 0.07% Scandinavian11 0.06% Luxembourger7 0.04% Nigerian7 0.04% Turkish7 0.04% Ukrainian3 0.02% Slovak3 0.02% Trinidadian and Tobagonian
Geographical mobility in Bartlett Same house 1 year ago 22,208 93.7% White (Caucasian)1,309 86.2% Black or African American520 98.7% American Indian / Alaska Native6,034 89.9% Asian28 100.0% Native Hawaiian / Pacific Islander2,598 90.5% Other race2,531 92.4% Two or more races23,143 94.2% White alone, not Hispanic / Latino5,465 91.5% Hispanic or LatinoMoved within same county 466 2.0% White / Caucasian93 6.1% Black or African American336 5.0% Asian202 7.0% Other race83 3.0% Two or more races454 1.8% White alone, not Hispanic / Latino286 4.8% Hispanic or LatinoMoved within same state 784 3.3% White / Caucasian164 10.8% Black or African American167 2.5% Asian49 1.7% Other race749 3.0% White alone, not Hispanic / Latino118 2.0% Hispanic or LatinoMoved from different state 80 0.3% White / Caucasian91 1.4% Asian82 0.3% White alone, not Hispanic / LatinoMoved from abroad 7 0.0% White33 0.5% Asian25 0.9% Other race162 5.9% Two or more races8 0.0% White alone, not Hispanic / Latino139 2.3% Hispanic or Latino
Children Nativity (place of birth) in Bartlett
Children under 6 years - Living with two parents Both parents native 1,285 100.0% NativeBoth parents foreign-born 855 100.0% NativeOne native, one foreign-born parent 248 100.0% NativeChildren under 6 years - Living with one parent Native parent 462 100.0% NativeForeign-born parent 43 100.0% NativeChildren 6 to 17 years - Living with two parents Both parents native 2,886 96.6% Native101 3.4% Foreign-bornBoth parents foreign-born 888 79.7% Native226 20.3% Foreign-bornOne native, one foreign-born parent 401 100.0% NativeChildren 6 to 17 years - Living with one parent Native parent 983 100.0% NativeForeign-born parent 203 50.1% Native202 49.9% Foreign-born
Place of birth for residents in Bartlett 4,612 Asia3,364 South Central Asia1,933 Europe1,565 Americas1,541 Latin America1,424 Eastern Europe1,337 Central America881 South Eastern Asia420 Southern Europe285 Eastern Asia211 China198 South America80 Western Asia75 Africa57 Western Europe39 Eastern Africa30 Northern Europe23 Northern America21 Northern Africa13 Western Africa4 Caribbean2,318 India1,229 Mexico1,179 Poland864 Pakistan805 Philippines392 Italy118 Nepal113 China100 Venezuela73 Guatemala60 Hong Kong53 Korea52 Bulgaria49 Germany45 Colombia44 Romania44 Vietnam37 Taiwan30 Czechoslovakia30 Serbia29 Ethiopia27 Greece27 Argentina24 Bosnia and Herzegovina24 El Salvador23 Canada21 Egypt20 Ukraine19 Japan19 Iran15 Saudi Arabia15 Lebanon14 Ecuador13 Laos13 Latvia13 Nigeria13 Russia13 Ireland12 England12 Sri Lanka10 Bangladesh9 United Arab Emirates9 Kazakhstan9 Panama9 Hungary9 Peru8 Burma (Myanmar)8 Malaysia8 Turkey7 France4 Kenya4 Tanzania3 United Kingdom1 North Macedonia (Macedonia)
Grandparents responsible for own grandchildren in Bartlett
Grandparents (30 to 59 years) White / Caucasian 16 45.5% Responsible for grandchildren19 54.5% Not responsible for grandchildrenBlack or African American 10 100.0% Not responsible for grandchildrenAsian 44 100.0% Not responsible for grandchildrenOther race 24 100.0% Not responsible for grandchildrenWhite alone, not Hispanic / Latino 21 56.5% Responsible for grandchildren17 43.5% Not responsible for grandchildrenHispanic or Latino 20 100.0% Not responsible for grandchildrenGrandparents (60 years and over) White / Caucasian 49 19.5% Responsible for grandchildren202 80.5% Not responsible for grandchildrenBlack or African American 95 100.0% Not responsible for grandchildrenAsian 26 4.3% Responsible for grandchildren591 95.7% Not responsible for grandchildrenOther race 21 100.0% Not responsible for grandchildrenWhite alone, not Hispanic / Latino 49 16.9% Responsible for grandchildren240 83.1% Not responsible for grandchildrenHispanic or Latino 15 26.0% Responsible for grandchildren43 74.0% Not responsible for grandchildren