Estimated zip code population in 2022: 2,189 Zip code population in 2010: 2,448 Zip code population in 2000: 698
Houses and condos: 912 Renter-occupied apartments: 49
% of renters here:
5%
State:
33%
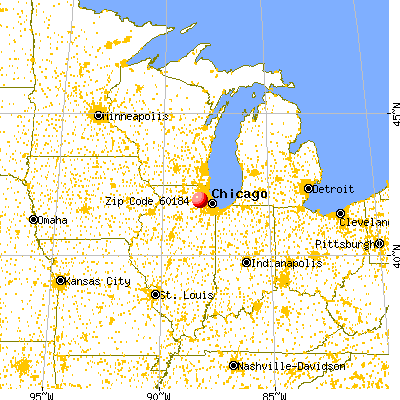
March 2022 cost of living index in zip code 60184: 98.2 (near average, U.S. average is 100)
Land area: 8.1 sq. mi. Water area: 0.3 sq. mi.
Population density: 270 people per square mile
(very low).
OSM Map
General Map
Google Map
MSN Map
OSM Map
General Map
Google Map
MSN Map
OSM Map
General Map
Google Map
MSN Map
OSM Map
General Map
Google Map
MSN Map
Please wait while loading the map...
Real estate property taxes paid for housing units in 2022:
This zip code:
1.4% ($9,718)
Illinois:
2.0% ($4,912)
Median real estate property taxes paid for housing units with mortgages in 2022: $9,569 (1.4%) Median real estate property taxes paid for housing units with no mortgage in 2022: $9,944 (1.3%)
Business Search- 14 Million verified businesses
Males: 1,069
(48.9%)
Females: 1,119
(51.1%)
For population 25 years and over in 60184:
High school or higher: 98.4%
Bachelor's degree or higher: 54.7%
Graduate or professional degree: 25.2%
Unemployed: 2.3%
Mean travel time to work (commute): 27.4 minutes
For population 15 years and over in 60184:
Never married: 19.9%
Now married: 67.3%
Separated: 0.3%
Widowed: 3.0%
Divorced: 9.5%
Zip code 60184 compared to state average:
Median household income above state average.
Median house value significantly above state average.
Unemployed percentage below state average.
Black race population percentage significantly below state average.
Hispanic race population percentage significantly below state average.
Median age significantly above state average.
Renting percentage significantly below state average.
Number of rooms per house significantly above state average.
House age below state average.
Percentage of population with a bachelor's degree or higher above state average.
Estimated median house/condo value in 2022: $698,819
60184:
$698,819
Illinois:
$251,600
According to our research of Illinois and other state lists, there were 2 registered sex offenders living in 60184 zip code as of May 23, 2024. The ratio of all residents to sex offenders in zip code 60184 is 1,263 to 1. The ratio of registered sex offenders to all residents in this zip code is lower than the state average.
Median resident age:
This zip code:
52.7 years
Illinois median age:
39.1 years
Average household size:
This zip code:
2.4 people
Illinois:
2.4 people
Averages for the 2020 tax year for zip code 60184, filed in 2021:
Average Adjusted Gross Income (AGI) in 2020: $269,526 (Individual Income Tax Returns)
Here:
$269,526
State:
$82,626
Salary/wage: $133,677 (reported on 79.4% of returns)
Here:
$133,677
State:
$66,640
(% of AGI for various income ranges: 1227.5% for AGIs below $25k, 3755.0% for AGIs $25k-50k, 7656.2% for AGIs $50k-75k, 9008.3% for AGIs $75k-100k, 18840.0% for AGIs $100k-200k, 86320.9% for AGIs over 200k)
Taxable interest for individuals: $6,082 (reported on 52.4% of returns)
This zip code:
$6,082
Illinois:
$2,376
(% of AGI for various income ranges: 36.9% for AGIs below $25k, 55.0% for AGIs $25k-50k, 200.0% for AGIs $50k-75k, 308.3% for AGIs $75k-100k, 368.2% for AGIs $100k-200k, 2853.6% for AGIs over 200k)
Ordinary dividends: $27,748 (reported on 48.4% of returns)
Here:
$27,748
State:
$9,061
(% of AGI for various income ranges: 129.4% for AGIs below $25k, 166.7% for AGIs $25k-50k, 310.0% for AGIs $50k-75k, 760.0% for AGIs $75k-100k, 1216.4% for AGIs $100k-200k, 13160.9% for AGIs over 200k)
Net capital gain/loss in AGI: +$93,426 (reported on 46.0% of returns)
Here:
+$93,426
State:
+$31,684
(% of AGI for various income ranges: 74.4% for AGIs below $25k, 40.8% for AGIs $25k-50k, 385.0% for AGIs $50k-75k, 826.7% for AGIs $75k-100k, 1534.5% for AGIs $100k-200k, 46842.7% for AGIs over 200k)
Profit/loss from business: +$13,600 (reported on 19.8% of returns)
Here:
+$13,600
State:
+$12,175
(% of AGI for various income ranges: 161.9% for AGIs below $25k, 280.0% for AGIs $25k-50k, 1103.8% for AGIs $50k-75k, 728.2% for AGIs $100k-200k, 1019.1% for AGIs over 200k)
Taxable individual retirement arrangement distribution: $44,906 (reported on 13.5% of returns)
60184:
$44,906
Illinois:
$21,613
(% of AGI for various income ranges: 371.7% for AGIs $25k-50k, 606.2% for AGIs $50k-75k, 2193.6% for AGIs $100k-200k, 3900.0% for AGIs over 200k)
Total itemized deductions: $43,118 (reported on 31.0% of returns)
Here:
$43,118
State:
$34,948
(% of AGI for various income ranges: 750.0% for AGIs $25k-50k, 795.0% for AGIs $50k-75k, 1440.0% for AGIs $75k-100k, 2887.3% for AGIs $100k-200k, 10218.2% for AGIs over 200k)
Charity contributions: $19,597 (reported on 24.6% of returns)
Here:
$19,597
State:
$13,122
(% of AGI for various income ranges: 111.7% for AGIs $25k-50k, 205.0% for AGIs $75k-100k, 510.9% for AGIs $100k-200k, 4778.2% for AGIs over 200k)
Taxes paid: $9,776 (reported on 29.4% of returns)
60184:
$9,776
State:
$8,563
(% of AGI for various income ranges: 249.2% for AGIs $25k-50k, 230.0% for AGIs $50k-75k, 405.0% for AGIs $75k-100k, 858.2% for AGIs $100k-200k, 1770.0% for AGIs over 200k)
Earned income credit: $1,517 (reported on 4.8% of returns)
Here:
$1,517
State:
$2,311
(% of AGI for various income ranges: 56.9% for AGIs below $25k)
Percentage of individuals using paid preparers for their 2020 taxes: 91.3%
Here:
91%
State:
93%
(% for various income ranges: 89.3% for AGIs below $25k, 88.2% for AGIs $25k-50k, 85.7% for AGIs $50k-75k, 88.9% for AGIs $75k-100k, 95.8% for AGIs $100k-200k, 94.1% for AGIs over 200k)
Averages for the 2012 tax year for zip code 60184, filed in 2013:
Average Adjusted Gross Income (AGI) in 2012: $218,350 (Individual Income Tax Returns)
Here:
$218,350
State:
$68,058
Salary/wage: $133,461 (reported on 81.3% of returns)
Here:
$133,461
State:
$55,396
(% of AGI for various income ranges: 84.0% for AGIs below $25k, 97.8% for AGIs $25k-50k, 71.8% for AGIs $50k-75k, 55.9% for AGIs $75k-100k, 65.7% for AGIs $100k-200k, 44.4% for AGIs over 200k)
Taxable interest for individuals: $7,153 (reported on 59.3% of returns)
This zip code:
$7,153
Illinois:
$1,969
(% of AGI for various income ranges: 1.9% for AGIs below $25k, 1.7% for AGIs $25k-50k, 1.8% for AGIs $50k-75k, 3.3% for AGIs $75k-100k, 2.0% for AGIs $100k-200k, 1.9% for AGIs over 200k)
Ordinary dividends: $19,719 (reported on 50.4% of returns)
Here:
$19,719
State:
$7,786
(% of AGI for various income ranges: 6.3% for AGIs below $25k, 1.8% for AGIs $25k-50k, 4.6% for AGIs $50k-75k, 3.8% for AGIs $75k-100k, 3.6% for AGIs $100k-200k, 4.8% for AGIs over 200k)
Net capital gain/loss in AGI: +$49,864 (reported on 43.1% of returns)
Here:
+$49,864
State:
+$22,183
(% of AGI for various income ranges: 1.2% for AGIs $75k-100k, 1.2% for AGIs $100k-200k, 12.3% for AGIs over 200k)
Profit/loss from business: +$33,348 (reported on 18.7% of returns)
Here:
+$33,348
State:
+$12,903
(% of AGI for various income ranges: 8.2% for AGIs below $25k, 6.4% for AGIs $25k-50k, 5.8% for AGIs $50k-75k, 4.7% for AGIs $75k-100k, 3.9% for AGIs $100k-200k, 2.3% for AGIs over 200k)
Taxable individual retirement arrangement distribution: $40,156 (reported on 14.6% of returns)
60184:
$40,156
Illinois:
$17,929
(% of AGI for various income ranges: 7.9% for AGIs $25k-50k, 6.2% for AGIs $75k-100k, 6.1% for AGIs $100k-200k, 2.0% for AGIs over 200k)
Self-employment retirement plans: $18,275 (reported on 3.3% of returns)
60184:
$18,275
Illinois:
$24,666
(% of AGI for various income ranges: 2.1% for AGIs $100k-200k)
Total itemized deductions: $58,237 (17% of AGI, reported on 61.0% of returns)
Here:
$58,237
State:
$26,433
Here:
17.0% of AGI
State:
19.2% of AGI
(% of AGI for various income ranges: 30.0% for AGIs below $25k, 24.0% for AGIs $25k-50k, 34.1% for AGIs $50k-75k, 26.9% for AGIs $75k-100k, 26.9% for AGIs $100k-200k, 13.1% for AGIs over 200k)
Charity contributions: $10,033 (reported on 56.1% of returns)
Here:
$10,033
State:
$4,525
(% of AGI for various income ranges: 1.2% for AGIs below $25k, 1.8% for AGIs $25k-50k, 2.4% for AGIs $50k-75k, 3.1% for AGIs $75k-100k, 2.6% for AGIs $100k-200k, 2.6% for AGIs over 200k)
Taxes paid: $31,319 (reported on 61.0% of returns)
60184:
$31,319
State:
$11,968
(% of AGI for various income ranges: 14.8% for AGIs below $25k, 12.4% for AGIs $25k-50k, 17.0% for AGIs $50k-75k, 15.0% for AGIs $75k-100k, 13.4% for AGIs $100k-200k, 7.3% for AGIs over 200k)
Earned income credit: $1,500 (reported on 4.9% of returns)
Here:
$1,500
State:
$2,349
(% of AGI for various income ranges: 2.6% for AGIs below $25k)
Percentage of individuals using paid preparers for their 2012 taxes: 63.4%
Here:
63%
State:
57%
(% for various income ranges: 52.8% for AGIs below $25k, 46.7% for AGIs $25k-50k, 60.0% for AGIs $50k-75k, 70.0% for AGIs $75k-100k, 66.7% for AGIs $100k-200k, 82.1% for AGIs over 200k)
Averages for the 2004 tax year for zip code 60184, filed in 2005:
Average Adjusted Gross Income (AGI) in 2004: $179,320 (Individual Income Tax Returns)
Here:
$179,320
State:
$54,625
Salary/wage: $123,790 (reported on 82.0% of returns)
Here:
$123,790
State:
$46,811
(% of AGI for various income ranges: 95.6% for AGIs $10k-25k, 68.7% for AGIs $25k-50k, 63.5% for AGIs $50k-75k, 74.2% for AGIs $75k-100k, 53.8% for AGIs over 100k)
Taxable interest for individuals: $5,852 (reported on 76.3% of returns)
This zip code:
$5,852
Illinois:
$2,101
(% of AGI for various income ranges: 5.4% for AGIs $10k-25k, 5.4% for AGIs $25k-50k, 4.6% for AGIs $50k-75k, 2.5% for AGIs $75k-100k, 2.2% for AGIs over 100k)
Taxable dividends: $9,567 (reported on 59.4% of returns)
Here:
$9,567
State:
$4,306
(% of AGI for various income ranges: 4.7% for AGIs $10k-25k, 4.6% for AGIs $25k-50k, 2.5% for AGIs $50k-75k, 3.2% for AGIs $75k-100k, 3.0% for AGIs over 100k)
Net capital gain/loss: +$39,057 (reported on 54.6% of returns)
Here:
+$39,057
State:
+$17,321
(% of AGI for various income ranges: 5.7% for AGIs $10k-25k, 1.6% for AGIs $25k-50k, 0.4% for AGIs $50k-75k, -0.3% for AGIs $75k-100k, 13.0% for AGIs over 100k)
Profit/loss from business: +$26,892 (reported on 16.9% of returns)
Here:
+$26,892
State:
+$11,771
(% of AGI for various income ranges: 3.8% for AGIs $25k-50k, 9.1% for AGIs $50k-75k, 1.7% for AGIs $75k-100k, 2.3% for AGIs over 100k)
IRA payment deduction: $4,172 (reported on 5.6% of returns)
60184:
$4,172
Illinois:
$3,087
(% of AGI for various income ranges: 1.5% for AGIs $50k-75k, 0.1% for AGIs over 100k)
Self-employed pension: $19,129 (reported on 2.7% of returns)
Here:
$19,129
Illinois:
$16,965
Total itemized deductions: $40,068 (15% of AGI, reported on 65.2% of returns)
Here:
$40,068
State:
$20,239
Here:
15.2% of AGI
State:
19.5% of AGI
(% of AGI for various income ranges: 22.5% for AGIs $10k-25k, 30.3% for AGIs $25k-50k, 33.0% for AGIs $50k-75k, 29.1% for AGIs $75k-100k, 12.6% for AGIs over 100k)
Charity contributions deductions: $7,965 (3% of AGI, reported on 61.5% of returns)
Here:
$7,965
State:
$3,719
Here:
2.9% of AGI
State:
3.4% of AGI
(% of AGI for various income ranges: 1.7% for AGIs $10k-25k, 2.9% for AGIs $25k-50k, 3.7% for AGIs $50k-75k, 3.0% for AGIs $75k-100k, 2.7% for AGIs over 100k)
Total tax: $44,625 (reported on 82.3% of returns)
60184:
$44,625
State:
$9,882
(% of AGI for various income ranges: 4.3% for AGIs $10k-25k, 7.2% for AGIs $25k-50k, 9.8% for AGIs $50k-75k, 9.3% for AGIs $75k-100k, 21.6% for AGIs over 100k)
Earned income credit: $1,240 (reported on 2.2% of returns)
Here:
$1,240
State:
$1,788
Percentage of individuals using paid preparers for their 2004 taxes: 68.0%
Here:
68%
State:
61%
(% for various income ranges: 59.1% for AGIs below $10k, 61.1% for AGIs $10k-25k, 61.5% for AGIs $25k-50k, 71.4% for AGIs $50k-75k, 69.6% for AGIs $75k-100k, 74.7% for AGIs over 100k)
Household received Food Stamps/SNAP in the past 12 months: 17 Household did not receive Food Stamps/SNAP in the past 12 months: 874
Women who had a birth in the past 12 months: 18 (18 now married, 0 unmarried) Women who did not have a birth in the past 12 months: 391 (190 now married, 198 unmarried)
Housing units in zip code 60184 with a mortgage: 603 (55 second mortgage, 56 both second mortgage and home equity loan) Houses without a mortgage: 48
Median monthly owner costs for units with a mortgage: $3,263 Median monthly owner costs for units without a mortgage: $1,519
Residents with income below the poverty level in 2022:
This zip code:
0.9%
Whole state:
11.9%
Residents with income below 50% of the poverty level in 2022:
This zip code:
0.6%
Whole state:
5.7%
Median number of rooms in houses and condos:
Here:
8.3
State:
6.4
Median number of rooms in apartments:
Here:
9.8
State:
4.1
Notable locations in this zip code not listed on our city pages
Size of family households: 374 2-persons, 109 3-persons, 147 4-persons, 30 5-persons, 19 6-persons
Size of nonfamily households: 184 1-person, 36 2-persons, 1 4-persons
263 married couples with children.
32 single-parent households (5 men, 27 women).
84.5% of residents of 60184 zip code speak English at home.
3.8% of residents speak Spanish at home (94% very well, 6% well).
11.2% of residents speak other Indo-European language at home (48% very well, 50% well, 1% not well).
0.2% of residents speak Asian or Pacific Island language at home (100% well).
0.3% of residents speak other language at home (100% very well).
Foreign born population: 359 (16.4%) (82.2% of them are naturalized citizens)
This zip code:
16.4%
Whole state:
14.4%
25%North Macedonia (Macedonia)
19%Nepal
14%Bhutan
13%Lithuania
8%Honduras
4%Sweden
3%United Kingdom, excluding England and Scotland
16%Polish
10%Italian
8%American
5%Irish
5%German
5%European
4%Romanian
Year of entry for the foreign-born population
72010 or later
512000 to 2009
961990 to 1999
202Before 1990
Facilities with environmental interests located in this zip code:
RON BRADDOCK (RTE 15 AND RT 242 in WAYNE, IL)
STATE MASTER (Illinois EPA Project) - SOLID WASTE PROGRAM, HAZARDOUS WASTE PROGRAM (Resource Conservation and Recovery Act (tracking hazardous waste)) Organizations: BRADDOCK RON (CONTACT/OWNER)
Alternative names: BRADDOCK RON
DCDPW-CASCADE WWTP (NORTH AVENUE & PRINCE CROSSING in WAYNE TOWNSHIP, IL)
National Pollutant Discharge Elimination System NON-MAJOR (Tracking pollutant discharge elimination systems) - permit National Pollutant Discharge Elimination System NON-MAJOR (Tracking pollutant discharge elimination systems) - permit Business SIC classification: SEWERAGE SYSTEMS Alternative names: CASCADE STP, DUPAGE CO. DEPT. ENV. CONCERNS, DUPAGE CO. PUBLIC WORKS, DUPAGE COUNTY-CASCADE STP
94.0%Utility gas
3.9%Electricity
1.5%Bottled, tank, or LP gas
0.8%Wood
Place of birth for U.S.-born residents:
This state: 1,489
Northeast: 57
Midwest: 135
South: 71
West: 62
69% of the 60184 zip code residents lived in the same house 5 years ago. Out of people who lived in different houses, 52% lived in this county. Out of people who lived in different counties, 50% lived in Illinois.
91% of the 60184 zip code residents lived in the same house 1 year ago. Out of people who lived in different houses, 67% moved from this county. Out of people who lived in different houses, 27% moved from different county within same state. Out of people who lived in different houses, 2% moved from different state.
Private vs. public school enrollment:
Students in private schools in grades 1 to 8 (elementary and middle school): 15
Here:
16.3%
Illinois:
13.3%
Students in private schools in grades 9 to 12 (high school): 34
Here:
36.6%
Illinois:
9.9%
Students in private undergraduate colleges: 21
Here:
16.1%
Illinois:
27.4%
Occupation by median earnings in the past 12 months ($)
170,547Health diagnosing and treating practitioners and other technical occupations
106,583Architecture and engineering occupations
105,075Management occupations
103,598Business and financial operations occupations
95,416Legal occupations
94,735Community and social service occupations
Companies with federal contracts located in this zip code:
REINHART TECHNOLOGIES INC (5N601 GUILD LN in WAYNE, IL) : $25,992 in 3 contractsfrom 2003 to 2005
$8,664 with Army for ADP Software. Signed on 2005-09-14. Completion date: 2006-09-30.
$8,664 with Army for Other ADP and Telecommunications Services (includes data storage on tapes, compact disks, etc.). Signed on 2004-09-07. Completion date: 2005-09-30.
$8,664, same as above.Signed on 2003-09-02. Completion date: 2004-09-30.
Top industries in this zip code by the number of employees in 2005:
Finance and Insurance: Insurance Agencies and Brokerages (20-49 employees: 1 establishment, 1-4 employees: 2 establishments)
Arts, Entertainment, and Recreation: Fitness and Recreational Sports Centers (20-49: 1, 1-4: 1)
Detailed PMIC statistics for the following Tracts:8413.01
2002 - 2018 National Fire Incident Reporting System (NFIRS) incidents
According to the data from the years 2002 - 2018 the average number of fires per year is 7. The highest number of fires - 16 took place in 2015, and the least - 0 in 2007. The data has an increasing trend.
When looking into fire subcategories, the most reports belonged to: Structure Fires (45.8%), and Outside Fires (44.9%).
Fire incident types reported to NFIRS in Zip Code 60184


 Nearest zip codes: 60174, 60103, 60177, 60185, 60120, 60107.


 According to the data from the years 2002 - 2018 the average number of fires per year is 7. The highest number of fires - 16 took place in 2015, and the least - 0 in 2007. The data has an increasing trend.
 When looking into fire subcategories, the most reports belonged to: Structure Fires (45.8%), and Outside Fires (44.9%).