Siloam Springs, Arkansas Submit your own pictures of this city and show them to the world
OSM Map
General Map
Google Map
MSN Map
OSM Map
General Map
Google Map
MSN Map
OSM Map
General Map
Google Map
MSN Map
OSM Map
General Map
Google Map
MSN Map
Please wait while loading the map...
Population in 2022: 18,654 (96% urban, 4% rural). Population change since 2000: +72.0%Males: 8,820 Females: 9,834
March 2022 cost of living index in Siloam Springs: 82.8 (low, U.S. average is 100) Percentage of residents living in poverty in 2022: 15.8%for White Non-Hispanic residents , 29.5% for Black residents , 19.8% for Hispanic or Latino residents , 0.9% for American Indian residents , 3.7% for other race residents , 8.6% for two or more races residents )
Profiles of local businesses
Business Search - 14 Million verified businesses
Data:
Median household income ($)
Median household income (% change since 2000)
Household income diversity
Ratio of average income to average house value (%)
Ratio of average income to average rent
Median household income ($) - White
Median household income ($) - Black or African American
Median household income ($) - Asian
Median household income ($) - Hispanic or Latino
Median household income ($) - American Indian and Alaska Native
Median household income ($) - Multirace
Median household income ($) - Other Race
Median household income for houses/condos with a mortgage ($)
Median household income for apartments without a mortgage ($)
Races - White alone (%)
Races - White alone (% change since 2000)
Races - Black alone (%)
Races - Black alone (% change since 2000)
Races - American Indian alone (%)
Races - American Indian alone (% change since 2000)
Races - Asian alone (%)
Races - Asian alone (% change since 2000)
Races - Hispanic (%)
Races - Hispanic (% change since 2000)
Races - Native Hawaiian and Other Pacific Islander alone (%)
Races - Native Hawaiian and Other Pacific Islander alone (% change since 2000)
Races - Two or more races (%)
Races - Two or more races (% change since 2000)
Races - Other race alone (%)
Races - Other race alone (% change since 2000)
Racial diversity
Unemployment (%)
Unemployment (% change since 2000)
Unemployment (%) - White
Unemployment (%) - Black or African American
Unemployment (%) - Asian
Unemployment (%) - Hispanic or Latino
Unemployment (%) - American Indian and Alaska Native
Unemployment (%) - Multirace
Unemployment (%) - Other Race
Population density (people per square mile)
Population - Males (%)
Population - Females (%)
Population - Males (%) - White
Population - Males (%) - Black or African American
Population - Males (%) - Asian
Population - Males (%) - Hispanic or Latino
Population - Males (%) - American Indian and Alaska Native
Population - Males (%) - Multirace
Population - Males (%) - Other Race
Population - Females (%) - White
Population - Females (%) - Black or African American
Population - Females (%) - Asian
Population - Females (%) - Hispanic or Latino
Population - Females (%) - American Indian and Alaska Native
Population - Females (%) - Multirace
Population - Females (%) - Other Race
Coronavirus confirmed cases (May 23, 2024)
Deaths caused by coronavirus (May 23, 2024)
Coronavirus confirmed cases (per 100k population) (May 23, 2024)
Deaths caused by coronavirus (per 100k population) (May 23, 2024)
Daily increase in number of cases (May 23, 2024)
Weekly increase in number of cases (May 23, 2024)
Cases doubled (in days) (May 23, 2024)
Hospitalized patients (Apr 18, 2022)
Negative test results (Apr 18, 2022)
Total test results (Apr 18, 2022)
COVID Vaccine doses distributed (per 100k population) (Sep 19, 2023)
COVID Vaccine doses administered (per 100k population) (Sep 19, 2023)
COVID Vaccine doses distributed (Sep 19, 2023)
COVID Vaccine doses administered (Sep 19, 2023)
Likely homosexual households (%)
Likely homosexual households (% change since 2000)
Likely homosexual households - Lesbian couples (%)
Likely homosexual households - Lesbian couples (% change since 2000)
Likely homosexual households - Gay men (%)
Likely homosexual households - Gay men (% change since 2000)
Cost of living index
Median gross rent ($)
Median contract rent ($)
Median monthly housing costs ($)
Median house or condo value ($)
Median house or condo value ($ change since 2000)
Mean house or condo value by units in structure - 1, detached ($)
Mean house or condo value by units in structure - 1, attached ($)
Mean house or condo value by units in structure - 2 ($)
Mean house or condo value by units in structure by units in structure - 3 or 4 ($)
Mean house or condo value by units in structure - 5 or more ($)
Mean house or condo value by units in structure - Boat, RV, van, etc. ($)
Mean house or condo value by units in structure - Mobile home ($)
Median house or condo value ($) - White
Median house or condo value ($) - Black or African American
Median house or condo value ($) - Asian
Median house or condo value ($) - Hispanic or Latino
Median house or condo value ($) - American Indian and Alaska Native
Median house or condo value ($) - Multirace
Median house or condo value ($) - Other Race
Median resident age
Resident age diversity
Median resident age - Males
Median resident age - Females
Median resident age - White
Median resident age - Black or African American
Median resident age - Asian
Median resident age - Hispanic or Latino
Median resident age - American Indian and Alaska Native
Median resident age - Multirace
Median resident age - Other Race
Median resident age - Males - White
Median resident age - Males - Black or African American
Median resident age - Males - Asian
Median resident age - Males - Hispanic or Latino
Median resident age - Males - American Indian and Alaska Native
Median resident age - Males - Multirace
Median resident age - Males - Other Race
Median resident age - Females - White
Median resident age - Females - Black or African American
Median resident age - Females - Asian
Median resident age - Females - Hispanic or Latino
Median resident age - Females - American Indian and Alaska Native
Median resident age - Females - Multirace
Median resident age - Females - Other Race
Commute - mean travel time to work (minutes)
Travel time to work - Less than 5 minutes (%)
Travel time to work - Less than 5 minutes (% change since 2000)
Travel time to work - 5 to 9 minutes (%)
Travel time to work - 5 to 9 minutes (% change since 2000)
Travel time to work - 10 to 19 minutes (%)
Travel time to work - 10 to 19 minutes (% change since 2000)
Travel time to work - 20 to 29 minutes (%)
Travel time to work - 20 to 29 minutes (% change since 2000)
Travel time to work - 30 to 39 minutes (%)
Travel time to work - 30 to 39 minutes (% change since 2000)
Travel time to work - 40 to 59 minutes (%)
Travel time to work - 40 to 59 minutes (% change since 2000)
Travel time to work - 60 to 89 minutes (%)
Travel time to work - 60 to 89 minutes (% change since 2000)
Travel time to work - 90 or more minutes (%)
Travel time to work - 90 or more minutes (% change since 2000)
Marital status - Never married (%)
Marital status - Now married (%)
Marital status - Separated (%)
Marital status - Widowed (%)
Marital status - Divorced (%)
Median family income ($)
Median family income (% change since 2000)
Median non-family income ($)
Median non-family income (% change since 2000)
Median per capita income ($)
Median per capita income (% change since 2000)
Median family income ($) - White
Median family income ($) - Black or African American
Median family income ($) - Asian
Median family income ($) - Hispanic or Latino
Median family income ($) - American Indian and Alaska Native
Median family income ($) - Multirace
Median family income ($) - Other Race
Median year house/condo built
Median year apartment built
Year house built - Built 2005 or later (%)
Year house built - Built 2000 to 2004 (%)
Year house built - Built 1990 to 1999 (%)
Year house built - Built 1980 to 1989 (%)
Year house built - Built 1970 to 1979 (%)
Year house built - Built 1960 to 1969 (%)
Year house built - Built 1950 to 1959 (%)
Year house built - Built 1940 to 1949 (%)
Year house built - Built 1939 or earlier (%)
Average household size
Household density (households per square mile)
Average household size - White
Average household size - Black or African American
Average household size - Asian
Average household size - Hispanic or Latino
Average household size - American Indian and Alaska Native
Average household size - Multirace
Average household size - Other Race
Occupied housing units (%)
Vacant housing units (%)
Owner occupied housing units (%)
Renter occupied housing units (%)
Vacancy status - For rent (%)
Vacancy status - For sale only (%)
Vacancy status - Rented or sold, not occupied (%)
Vacancy status - For seasonal, recreational, or occasional use (%)
Vacancy status - For migrant workers (%)
Vacancy status - Other vacant (%)
Residents with income below the poverty level (%)
Residents with income below 50% of the poverty level (%)
Children below poverty level (%)
Poor families by family type - Married-couple family (%)
Poor families by family type - Male, no wife present (%)
Poor families by family type - Female, no husband present (%)
Poverty status for native-born residents (%)
Poverty status for foreign-born residents (%)
Poverty among high school graduates not in families (%)
Poverty among people who did not graduate high school not in families (%)
Residents with income below the poverty level (%) - White
Residents with income below the poverty level (%) - Black or African American
Residents with income below the poverty level (%) - Asian
Residents with income below the poverty level (%) - Hispanic or Latino
Residents with income below the poverty level (%) - American Indian and Alaska Native
Residents with income below the poverty level (%) - Multirace
Residents with income below the poverty level (%) - Other Race
Air pollution - Air Quality Index (AQI)
Air pollution - CO
Air pollution - NO2
Air pollution - SO2
Air pollution - Ozone
Air pollution - PM10
Air pollution - PM25
Air pollution - Pb
Crime - Murders per 100,000 population
Crime - Rapes per 100,000 population
Crime - Robberies per 100,000 population
Crime - Assaults per 100,000 population
Crime - Burglaries per 100,000 population
Crime - Thefts per 100,000 population
Crime - Auto thefts per 100,000 population
Crime - Arson per 100,000 population
Crime - City-data.com crime index
Crime - Violent crime index
Crime - Property crime index
Crime - Murders per 100,000 population (5 year average)
Crime - Rapes per 100,000 population (5 year average)
Crime - Robberies per 100,000 population (5 year average)
Crime - Assaults per 100,000 population (5 year average)
Crime - Burglaries per 100,000 population (5 year average)
Crime - Thefts per 100,000 population (5 year average)
Crime - Auto thefts per 100,000 population (5 year average)
Crime - Arson per 100,000 population (5 year average)
Crime - City-data.com crime index (5 year average)
Crime - Violent crime index (5 year average)
Crime - Property crime index (5 year average)
1996 Presidential Elections Results (%) - Democratic Party (Clinton)
1996 Presidential Elections Results (%) - Republican Party (Dole)
1996 Presidential Elections Results (%) - Other
2000 Presidential Elections Results (%) - Democratic Party (Gore)
2000 Presidential Elections Results (%) - Republican Party (Bush)
2000 Presidential Elections Results (%) - Other
2004 Presidential Elections Results (%) - Democratic Party (Kerry)
2004 Presidential Elections Results (%) - Republican Party (Bush)
2004 Presidential Elections Results (%) - Other
2008 Presidential Elections Results (%) - Democratic Party (Obama)
2008 Presidential Elections Results (%) - Republican Party (McCain)
2008 Presidential Elections Results (%) - Other
2012 Presidential Elections Results (%) - Democratic Party (Obama)
2012 Presidential Elections Results (%) - Republican Party (Romney)
2012 Presidential Elections Results (%) - Other
2016 Presidential Elections Results (%) - Democratic Party (Clinton)
2016 Presidential Elections Results (%) - Republican Party (Trump)
2016 Presidential Elections Results (%) - Other
2020 Presidential Elections Results (%) - Democratic Party (Biden)
2020 Presidential Elections Results (%) - Republican Party (Trump)
2020 Presidential Elections Results (%) - Other
Ancestries Reported - Arab (%)
Ancestries Reported - Czech (%)
Ancestries Reported - Danish (%)
Ancestries Reported - Dutch (%)
Ancestries Reported - English (%)
Ancestries Reported - French (%)
Ancestries Reported - French Canadian (%)
Ancestries Reported - German (%)
Ancestries Reported - Greek (%)
Ancestries Reported - Hungarian (%)
Ancestries Reported - Irish (%)
Ancestries Reported - Italian (%)
Ancestries Reported - Lithuanian (%)
Ancestries Reported - Norwegian (%)
Ancestries Reported - Polish (%)
Ancestries Reported - Portuguese (%)
Ancestries Reported - Russian (%)
Ancestries Reported - Scotch-Irish (%)
Ancestries Reported - Scottish (%)
Ancestries Reported - Slovak (%)
Ancestries Reported - Subsaharan African (%)
Ancestries Reported - Swedish (%)
Ancestries Reported - Swiss (%)
Ancestries Reported - Ukrainian (%)
Ancestries Reported - United States (%)
Ancestries Reported - Welsh (%)
Ancestries Reported - West Indian (%)
Ancestries Reported - Other (%)
Educational Attainment - No schooling completed (%)
Educational Attainment - Less than high school (%)
Educational Attainment - High school or equivalent (%)
Educational Attainment - Less than 1 year of college (%)
Educational Attainment - 1 or more years of college (%)
Educational Attainment - Associate degree (%)
Educational Attainment - Bachelor's degree (%)
Educational Attainment - Master's degree (%)
Educational Attainment - Professional school degree (%)
Educational Attainment - Doctorate degree (%)
School Enrollment - Nursery, preschool (%)
School Enrollment - Kindergarten (%)
School Enrollment - Grade 1 to 4 (%)
School Enrollment - Grade 5 to 8 (%)
School Enrollment - Grade 9 to 12 (%)
School Enrollment - College undergrad (%)
School Enrollment - Graduate or professional (%)
School Enrollment - Not enrolled in school (%)
School enrollment - Public schools (%)
School enrollment - Private schools (%)
School enrollment - Not enrolled (%)
Median number of rooms in houses and condos
Median number of rooms in apartments
Housing units lacking complete plumbing facilities (%)
Housing units lacking complete kitchen facilities (%)
Density of houses
Urban houses (%)
Rural houses (%)
Households with people 60 years and over (%)
Households with people 65 years and over (%)
Households with people 75 years and over (%)
Households with one or more nonrelatives (%)
Households with no nonrelatives (%)
Population in households (%)
Family households (%)
Nonfamily households (%)
Population in families (%)
Family households with own children (%)
Median number of bedrooms in owner occupied houses
Mean number of bedrooms in owner occupied houses
Median number of bedrooms in renter occupied houses
Mean number of bedrooms in renter occupied houses
Median number of vehichles in owner occupied houses
Mean number of vehichles in owner occupied houses
Median number of vehichles in renter occupied houses
Mean number of vehichles in renter occupied houses
Mortgage status - with mortgage (%)
Mortgage status - with second mortgage (%)
Mortgage status - with home equity loan (%)
Mortgage status - with both second mortgage and home equity loan (%)
Mortgage status - without a mortgage (%)
Average family size
Average family size - White
Average family size - Black or African American
Average family size - Asian
Average family size - Hispanic or Latino
Average family size - American Indian and Alaska Native
Average family size - Multirace
Average family size - Other Race
Geographical mobility - Same house 1 year ago (%)
Geographical mobility - Moved within same county (%)
Geographical mobility - Moved from different county within same state (%)
Geographical mobility - Moved from different state (%)
Geographical mobility - Moved from abroad (%)
Place of birth - Born in state of residence (%)
Place of birth - Born in other state (%)
Place of birth - Native, outside of US (%)
Place of birth - Foreign born (%)
Housing units in structures - 1, detached (%)
Housing units in structures - 1, attached (%)
Housing units in structures - 2 (%)
Housing units in structures - 3 or 4 (%)
Housing units in structures - 5 to 9 (%)
Housing units in structures - 10 to 19 (%)
Housing units in structures - 20 to 49 (%)
Housing units in structures - 50 or more (%)
Housing units in structures - Mobile home (%)
Housing units in structures - Boat, RV, van, etc. (%)
House/condo owner moved in on average (years ago)
Renter moved in on average (years ago)
Year householder moved into unit - Moved in 1999 to March 2000 (%)
Year householder moved into unit - Moved in 1995 to 1998 (%)
Year householder moved into unit - Moved in 1990 to 1994 (%)
Year householder moved into unit - Moved in 1980 to 1989 (%)
Year householder moved into unit - Moved in 1970 to 1979 (%)
Year householder moved into unit - Moved in 1969 or earlier (%)
Means of transportation to work - Drove car alone (%)
Means of transportation to work - Carpooled (%)
Means of transportation to work - Public transportation (%)
Means of transportation to work - Bus or trolley bus (%)
Means of transportation to work - Streetcar or trolley car (%)
Means of transportation to work - Subway or elevated (%)
Means of transportation to work - Railroad (%)
Means of transportation to work - Ferryboat (%)
Means of transportation to work - Taxicab (%)
Means of transportation to work - Motorcycle (%)
Means of transportation to work - Bicycle (%)
Means of transportation to work - Walked (%)
Means of transportation to work - Other means (%)
Working at home (%)
Industry diversity
Most Common Industries - Agriculture, forestry, fishing and hunting, and mining (%)
Most Common Industries - Agriculture, forestry, fishing and hunting (%)
Most Common Industries - Mining, quarrying, and oil and gas extraction (%)
Most Common Industries - Construction (%)
Most Common Industries - Manufacturing (%)
Most Common Industries - Wholesale trade (%)
Most Common Industries - Retail trade (%)
Most Common Industries - Transportation and warehousing, and utilities (%)
Most Common Industries - Transportation and warehousing (%)
Most Common Industries - Utilities (%)
Most Common Industries - Information (%)
Most Common Industries - Finance and insurance, and real estate and rental and leasing (%)
Most Common Industries - Finance and insurance (%)
Most Common Industries - Real estate and rental and leasing (%)
Most Common Industries - Professional, scientific, and management, and administrative and waste management services (%)
Most Common Industries - Professional, scientific, and technical services (%)
Most Common Industries - Management of companies and enterprises (%)
Most Common Industries - Administrative and support and waste management services (%)
Most Common Industries - Educational services, and health care and social assistance (%)
Most Common Industries - Educational services (%)
Most Common Industries - Health care and social assistance (%)
Most Common Industries - Arts, entertainment, and recreation, and accommodation and food services (%)
Most Common Industries - Arts, entertainment, and recreation (%)
Most Common Industries - Accommodation and food services (%)
Most Common Industries - Other services, except public administration (%)
Most Common Industries - Public administration (%)
Occupation diversity
Most Common Occupations - Management, business, science, and arts occupations (%)
Most Common Occupations - Management, business, and financial occupations (%)
Most Common Occupations - Management occupations (%)
Most Common Occupations - Business and financial operations occupations (%)
Most Common Occupations - Computer, engineering, and science occupations (%)
Most Common Occupations - Computer and mathematical occupations (%)
Most Common Occupations - Architecture and engineering occupations (%)
Most Common Occupations - Life, physical, and social science occupations (%)
Most Common Occupations - Education, legal, community service, arts, and media occupations (%)
Most Common Occupations - Community and social service occupations (%)
Most Common Occupations - Legal occupations (%)
Most Common Occupations - Education, training, and library occupations (%)
Most Common Occupations - Arts, design, entertainment, sports, and media occupations (%)
Most Common Occupations - Healthcare practitioners and technical occupations (%)
Most Common Occupations - Health diagnosing and treating practitioners and other technical occupations (%)
Most Common Occupations - Health technologists and technicians (%)
Most Common Occupations - Service occupations (%)
Most Common Occupations - Healthcare support occupations (%)
Most Common Occupations - Protective service occupations (%)
Most Common Occupations - Fire fighting and prevention, and other protective service workers including supervisors (%)
Most Common Occupations - Law enforcement workers including supervisors (%)
Most Common Occupations - Food preparation and serving related occupations (%)
Most Common Occupations - Building and grounds cleaning and maintenance occupations (%)
Most Common Occupations - Personal care and service occupations (%)
Most Common Occupations - Sales and office occupations (%)
Most Common Occupations - Sales and related occupations (%)
Most Common Occupations - Office and administrative support occupations (%)
Most Common Occupations - Natural resources, construction, and maintenance occupations (%)
Most Common Occupations - Farming, fishing, and forestry occupations (%)
Most Common Occupations - Construction and extraction occupations (%)
Most Common Occupations - Installation, maintenance, and repair occupations (%)
Most Common Occupations - Production, transportation, and material moving occupations (%)
Most Common Occupations - Production occupations (%)
Most Common Occupations - Transportation occupations (%)
Most Common Occupations - Material moving occupations (%)
People in Group quarters - Institutionalized population (%)
People in Group quarters - Correctional institutions (%)
People in Group quarters - Federal prisons and detention centers (%)
People in Group quarters - Halfway houses (%)
People in Group quarters - Local jails and other confinement facilities (including police lockups) (%)
People in Group quarters - Military disciplinary barracks (%)
People in Group quarters - State prisons (%)
People in Group quarters - Other types of correctional institutions (%)
People in Group quarters - Nursing homes (%)
People in Group quarters - Hospitals/wards, hospices, and schools for the handicapped (%)
People in Group quarters - Hospitals/wards and hospices for chronically ill (%)
People in Group quarters - Hospices or homes for chronically ill (%)
People in Group quarters - Military hospitals or wards for chronically ill (%)
People in Group quarters - Other hospitals or wards for chronically ill (%)
People in Group quarters - Hospitals or wards for drug/alcohol abuse (%)
People in Group quarters - Mental (Psychiatric) hospitals or wards (%)
People in Group quarters - Schools, hospitals, or wards for the mentally retarded (%)
People in Group quarters - Schools, hospitals, or wards for the physically handicapped (%)
People in Group quarters - Institutions for the deaf (%)
People in Group quarters - Institutions for the blind (%)
People in Group quarters - Orthopedic wards and institutions for the physically handicapped (%)
People in Group quarters - Wards in general hospitals for patients who have no usual home elsewhere (%)
People in Group quarters - Wards in military hospitals for patients who have no usual home elsewhere (%)
People in Group quarters - Juvenile institutions (%)
People in Group quarters - Long-term care (%)
People in Group quarters - Homes for abused, dependent, and neglected children (%)
People in Group quarters - Residential treatment centers for emotionally disturbed children (%)
People in Group quarters - Training schools for juvenile delinquents (%)
People in Group quarters - Short-term care, detention or diagnostic centers for delinquent children (%)
People in Group quarters - Type of juvenile institution unknown (%)
People in Group quarters - Noninstitutionalized population (%)
People in Group quarters - College dormitories (includes college quarters off campus) (%)
People in Group quarters - Military quarters (%)
People in Group quarters - On base (%)
People in Group quarters - Barracks, unaccompanied personnel housing (UPH), (Enlisted/Officer), ;and similar group living quarters for military personnel (%)
People in Group quarters - Transient quarters for temporary residents (%)
People in Group quarters - Military ships (%)
People in Group quarters - Group homes (%)
People in Group quarters - Homes or halfway houses for drug/alcohol abuse (%)
People in Group quarters - Homes for the mentally ill (%)
People in Group quarters - Homes for the mentally retarded (%)
People in Group quarters - Homes for the physically handicapped (%)
People in Group quarters - Other group homes (%)
People in Group quarters - Religious group quarters (%)
People in Group quarters - Dormitories (%)
People in Group quarters - Agriculture workers' dormitories on farms (%)
People in Group quarters - Job Corps and vocational training facilities (%)
People in Group quarters - Other workers' dormitories (%)
People in Group quarters - Crews of maritime vessels (%)
People in Group quarters - Other nonhousehold living situations (%)
People in Group quarters - Other noninstitutional group quarters (%)
Residents speaking English at home (%)
Residents speaking English at home - Born in the United States (%)
Residents speaking English at home - Native, born elsewhere (%)
Residents speaking English at home - Foreign born (%)
Residents speaking Spanish at home (%)
Residents speaking Spanish at home - Born in the United States (%)
Residents speaking Spanish at home - Native, born elsewhere (%)
Residents speaking Spanish at home - Foreign born (%)
Residents speaking other language at home (%)
Residents speaking other language at home - Born in the United States (%)
Residents speaking other language at home - Native, born elsewhere (%)
Residents speaking other language at home - Foreign born (%)
Class of Workers - Employee of private company (%)
Class of Workers - Self-employed in own incorporated business (%)
Class of Workers - Private not-for-profit wage and salary workers (%)
Class of Workers - Local government workers (%)
Class of Workers - State government workers (%)
Class of Workers - Federal government workers (%)
Class of Workers - Self-employed workers in own not incorporated business and Unpaid family workers (%)
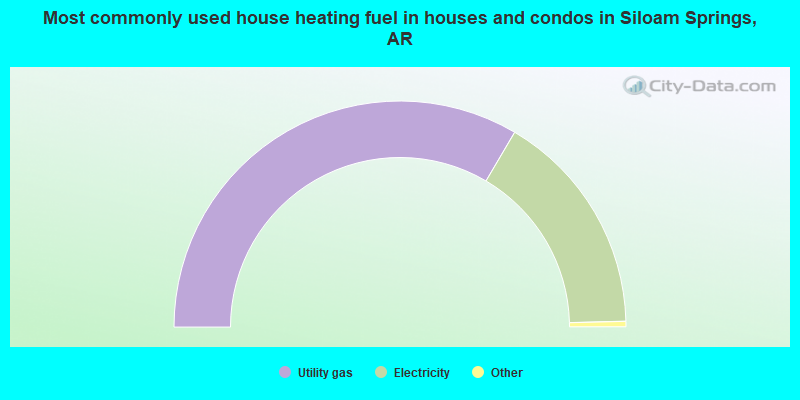
House heating fuel used in houses and condos - Utility gas (%)
House heating fuel used in houses and condos - Bottled, tank, or LP gas (%)
House heating fuel used in houses and condos - Electricity (%)
House heating fuel used in houses and condos - Fuel oil, kerosene, etc. (%)
House heating fuel used in houses and condos - Coal or coke (%)
House heating fuel used in houses and condos - Wood (%)
House heating fuel used in houses and condos - Solar energy (%)
House heating fuel used in houses and condos - Other fuel (%)
House heating fuel used in houses and condos - No fuel used (%)
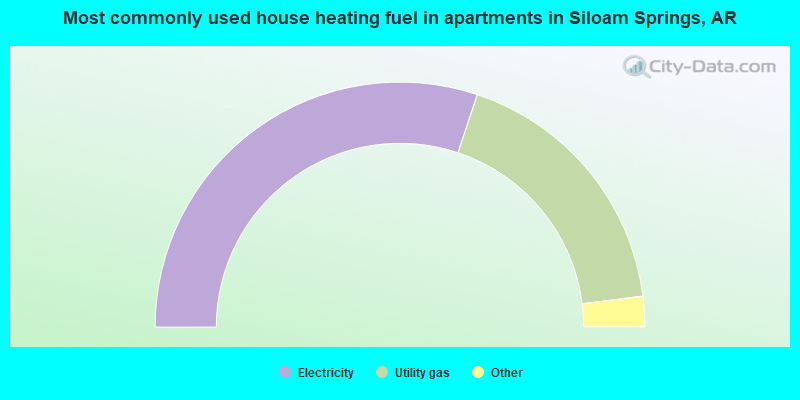
House heating fuel used in apartments - Utility gas (%)
House heating fuel used in apartments - Bottled, tank, or LP gas (%)
House heating fuel used in apartments - Electricity (%)
House heating fuel used in apartments - Fuel oil, kerosene, etc. (%)
House heating fuel used in apartments - Coal or coke (%)
House heating fuel used in apartments - Wood (%)
House heating fuel used in apartments - Solar energy (%)
House heating fuel used in apartments - Other fuel (%)
House heating fuel used in apartments - No fuel used (%)
Armed forces status - In Armed Forces (%)
Armed forces status - Civilian (%)
Armed forces status - Civilian - Veteran (%)
Armed forces status - Civilian - Nonveteran (%)
Fatal accidents locations in years 2005-2021
Fatal accidents locations in 2005
Fatal accidents locations in 2006
Fatal accidents locations in 2007
Fatal accidents locations in 2008
Fatal accidents locations in 2009
Fatal accidents locations in 2010
Fatal accidents locations in 2011
Fatal accidents locations in 2012
Fatal accidents locations in 2013
Fatal accidents locations in 2014
Fatal accidents locations in 2015
Fatal accidents locations in 2016
Fatal accidents locations in 2017
Fatal accidents locations in 2018
Fatal accidents locations in 2019
Fatal accidents locations in 2020
Fatal accidents locations in 2021
Alcohol use - People drinking some alcohol every month (%)
Alcohol use - People not drinking at all (%)
Alcohol use - Average days/month drinking alcohol
Alcohol use - Average drinks/week
Alcohol use - Average days/year people drink much
Audiometry - Average condition of hearing (%)
Audiometry - People that can hear a whisper from across a quiet room (%)
Audiometry - People that can hear normal voice from across a quiet room (%)
Audiometry - Ears ringing, roaring, buzzing (%)
Audiometry - Had a job exposure to loud noise (%)
Audiometry - Had off-work exposure to loud noise (%)
Blood Pressure & Cholesterol - Has high blood pressure (%)
Blood Pressure & Cholesterol - Checking blood pressure at home (%)
Blood Pressure & Cholesterol - Frequently checking blood cholesterol (%)
Blood Pressure & Cholesterol - Has high cholesterol level (%)
Consumer Behavior - Money monthly spent on food at supermarket/grocery store
Consumer Behavior - Money monthly spent on food at other stores
Consumer Behavior - Money monthly spent on eating out
Consumer Behavior - Money monthly spent on carryout/delivered foods
Consumer Behavior - Income spent on food at supermarket/grocery store (%)
Consumer Behavior - Income spent on food at other stores (%)
Consumer Behavior - Income spent on eating out (%)
Consumer Behavior - Income spent on carryout/delivered foods (%)
Current Health Status - General health condition (%)
Current Health Status - Blood donors (%)
Current Health Status - Has blood ever tested for HIV virus (%)
Current Health Status - Left-handed people (%)
Dermatology - People using sunscreen (%)
Diabetes - Diabetics (%)
Diabetes - Had a blood test for high blood sugar (%)
Diabetes - People taking insulin (%)
Diet Behavior & Nutrition - Diet health (%)
Diet Behavior & Nutrition - Milk product consumption (# of products/month)
Diet Behavior & Nutrition - Meals not home prepared (#/week)
Diet Behavior & Nutrition - Meals from fast food or pizza place (#/week)
Diet Behavior & Nutrition - Ready-to-eat foods (#/month)
Diet Behavior & Nutrition - Frozen meals/pizza (#/month)
Drug Use - People that ever used marijuana or hashish (%)
Drug Use - Ever used hard drugs (%)
Drug Use - Ever used any form of cocaine (%)
Drug Use - Ever used heroin (%)
Drug Use - Ever used methamphetamine (%)
Health Insurance - People covered by health insurance (%)
Kidney Conditions-Urology - Avg. # of times urinating at night
Medical Conditions - People with asthma (%)
Medical Conditions - People with anemia (%)
Medical Conditions - People with psoriasis (%)
Medical Conditions - People with overweight (%)
Medical Conditions - Elderly people having difficulties in thinking or remembering (%)
Medical Conditions - People who ever received blood transfusion (%)
Medical Conditions - People having trouble seeing even with glass/contacts (%)
Medical Conditions - People with arthritis (%)
Medical Conditions - People with gout (%)
Medical Conditions - People with congestive heart failure (%)
Medical Conditions - People with coronary heart disease (%)
Medical Conditions - People with angina pectoris (%)
Medical Conditions - People who ever had heart attack (%)
Medical Conditions - People who ever had stroke (%)
Medical Conditions - People with emphysema (%)
Medical Conditions - People with thyroid problem (%)
Medical Conditions - People with chronic bronchitis (%)
Medical Conditions - People with any liver condition (%)
Medical Conditions - People who ever had cancer or malignancy (%)
Mental Health - People who have little interest in doing things (%)
Mental Health - People feeling down, depressed, or hopeless (%)
Mental Health - People who have trouble sleeping or sleeping too much (%)
Mental Health - People feeling tired or having little energy (%)
Mental Health - People with poor appetite or overeating (%)
Mental Health - People feeling bad about themself (%)
Mental Health - People who have trouble concentrating on things (%)
Mental Health - People moving or speaking slowly or too fast (%)
Mental Health - People having thoughts they would be better off dead (%)
Oral Health - Average years since last visit a dentist
Oral Health - People embarrassed because of mouth (%)
Oral Health - People with gum disease (%)
Oral Health - General health of teeth and gums (%)
Oral Health - Average days a week using dental floss/device
Oral Health - Average days a week using mouthwash for dental problem
Oral Health - Average number of teeth
Pesticide Use - Households using pesticides to control insects (%)
Pesticide Use - Households using pesticides to kill weeds (%)
Physical Activity - People doing vigorous-intensity work activities (%)
Physical Activity - People doing moderate-intensity work activities (%)
Physical Activity - People walking or bicycling (%)
Physical Activity - People doing vigorous-intensity recreational activities (%)
Physical Activity - People doing moderate-intensity recreational activities (%)
Physical Activity - Average hours a day doing sedentary activities
Physical Activity - Average hours a day watching TV or videos
Physical Activity - Average hours a day using computer
Physical Functioning - People having limitations keeping them from working (%)
Physical Functioning - People limited in amount of work they can do (%)
Physical Functioning - People that need special equipment to walk (%)
Physical Functioning - People experiencing confusion/memory problems (%)
Physical Functioning - People requiring special healthcare equipment (%)
Prescription Medications - Average number of prescription medicines taking
Preventive Aspirin Use - Adults 40+ taking low-dose aspirin (%)
Reproductive Health - Vaginal deliveries (%)
Reproductive Health - Cesarean deliveries (%)
Reproductive Health - Deliveries resulted in a live birth (%)
Reproductive Health - Pregnancies resulted in a delivery (%)
Reproductive Health - Women breastfeeding newborns (%)
Reproductive Health - Women that had a hysterectomy (%)
Reproductive Health - Women that had both ovaries removed (%)
Reproductive Health - Women that have ever taken birth control pills (%)
Reproductive Health - Women taking birth control pills (%)
Reproductive Health - Women that have ever used Depo-Provera or injectables (%)
Reproductive Health - Women that have ever used female hormones (%)
Sexual Behavior - People 18+ that ever had sex (vaginal, anal, or oral) (%)
Sexual Behavior - Males 18+ that ever had vaginal sex with a woman (%)
Sexual Behavior - Males 18+ that ever performed oral sex on a woman (%)
Sexual Behavior - Males 18+ that ever had anal sex with a woman (%)
Sexual Behavior - Males 18+ that ever had any sex with a man (%)
Sexual Behavior - Females 18+ that ever had vaginal sex with a man (%)
Sexual Behavior - Females 18+ that ever performed oral sex on a man (%)
Sexual Behavior - Females 18+ that ever had anal sex with a man (%)
Sexual Behavior - Females 18+ that ever had any kind of sex with a woman (%)
Sexual Behavior - Average age people first had sex
Sexual Behavior - Average number of female sex partners in lifetime (males 18+)
Sexual Behavior - Average number of female vaginal sex partners in lifetime (males 18+)
Sexual Behavior - Average age people first performed oral sex on a woman (18+)
Sexual Behavior - Average number of woman performed oral sex on in lifetime (18+)
Sexual Behavior - Average number of male sex partners in lifetime (males 18+)
Sexual Behavior - Average number of male anal sex partners in lifetime (males 18+)
Sexual Behavior - Average age people first performed oral sex on a man (18+)
Sexual Behavior - Average number of male oral sex partners in lifetime (18+)
Sexual Behavior - People using protection when performing oral sex (%)
Sexual Behavior - Average number of times people have vaginal or anal sex a year
Sexual Behavior - People having sex without condom (%)
Sexual Behavior - Average number of male sex partners in lifetime (females 18+)
Sexual Behavior - Average number of male vaginal sex partners in lifetime (females 18+)
Sexual Behavior - Average number of female sex partners in lifetime (females 18+)
Sexual Behavior - Circumcised males 18+ (%)
Sleep Disorders - Average hours sleeping at night
Sleep Disorders - People that has trouble sleeping (%)
Smoking-Cigarette Use - People smoking cigarettes (%)
Taste & Smell - People 40+ having problems with smell (%)
Taste & Smell - People 40+ having problems with taste (%)
Taste & Smell - People 40+ that ever had wisdom teeth removed (%)
Taste & Smell - People 40+ that ever had tonsils teeth removed (%)
Taste & Smell - People 40+ that ever had a loss of consciousness because of a head injury (%)
Taste & Smell - People 40+ that ever had a broken nose or other serious injury to face or skull (%)
Taste & Smell - People 40+ that ever had two or more sinus infections (%)
Weight - Average height (inches)
Weight - Average weight (pounds)
Weight - Average BMI
Weight - People that are obese (%)
Weight - People that ever were obese (%)
Weight - People trying to lose weight (%)
8,910 47.8% White alone 4,746 25.5% Hispanic 4,120 22.1% Two or more races 685 3.7% Asian alone 577 3.1% American Indian alone 181 1.0% Black alone 58 0.3% Native Hawaiian and Other 5 0.03% Other race alone
Officers per 1,000 residents here:
2.18Arkansas average:
2.25
Latest news from Siloam Springs, AR collected exclusively by city-data.com from local newspapers, TV, and radio stations
Ancestries: English (6.9%), German (6.1%), American (3.6%), European (2.6%), Egyptian (2.4%), Irish (2.2%).
Current Local Time:
Incorporated on 12/22/1881
Land area: 10.6 square miles.
Population density: 1,767 people per square mile (low).
2,302 residents are foreign born (10.0% Latin America , 1.7% Asia ).
This city:
12.4%Arkansas:
5.0%
Median real estate property taxes paid for housing units with mortgages in 2022: $1,528 (0.7%)Median real estate property taxes paid for housing units with no mortgage in 2022: $1,002 (0.5%)
Nearest city with pop. 50,000+: Fayetteville, AR
Nearest city with pop. 200,000+: Tulsa, OK
Nearest city with pop. 1,000,000+: Dallas, TX
Nearest cities:
Dripping Springs, OK (2.8 miles),
Cherokee City, AR (2.9 miles),
Springtown, AR (2.9 miles),
Latitude: 36.18 N, Longitude: 94.54 W
Nickname or alias (official or unofficial): City of fountains and parks and bridges
Daytime population change due to commuting: +2,347 (+12.6%)Workers who live and work in this city: 4,975 (57.4%)
Single-family new house construction building permits:
2022: 147 buildings , average cost: $116,5002021: 191 buildings , average cost: $108,4002020: 73 buildings , average cost: $120,5002019: 152 buildings , average cost: $121,6002018: 90 buildings , average cost: $134,1002017: 75 buildings , average cost: $124,8002016: 64 buildings , average cost: $131,8002015: 39 buildings , average cost: $127,8002014: 21 buildings , average cost: $133,0002013: 26 buildings , average cost: $124,9002012: 34 buildings , average cost: $113,2002011: 25 buildings , average cost: $114,1002010: 30 buildings , average cost: $117,3002009: 24 buildings , average cost: $97,0002008: 22 buildings , average cost: $115,4002007: 30 buildings , average cost: $112,0002006: 91 buildings , average cost: $114,1002005: 142 buildings , average cost: $97,7002004: 134 buildings , average cost: $96,9002003: 112 buildings , average cost: $100,8002002: 149 buildings , average cost: $86,1002001: 124 buildings , average cost: $72,4002000: 77 buildings , average cost: $69,3001999: 74 buildings , average cost: $75,8001998: 97 buildings , average cost: $67,0001997: 93 buildings , average cost: $65,000Unemployment in December 2023:
Population change in the 1990s: +2,259 (+26.3%).
Most common occupations in Siloam Springs, AR (%)
Both Males Females
Other production occupations, including supervisors (10.2%)
Building and grounds cleaning and maintenance occupations (4.2%)
Laborers and material movers, hand (4.0%)
Other office and administrative support workers, including supervisors (4.0%)
Material recording, scheduling, dispatching, and distributing workers (3.8%)
Other sales and related occupations, including supervisors (3.7%)
Other management occupations, except farmers and farm managers (3.4%)
Other production occupations, including supervisors (10.5%)
Electrical equipment mechanics and other installation, maintenance, and repair workers, including supervisors (5.2%)
Laborers and material movers, hand (5.1%)
Building and grounds cleaning and maintenance occupations (4.6%)
Other sales and related occupations, including supervisors (4.3%)
Food processing workers (4.0%)
Material recording, scheduling, dispatching, and distributing workers (3.9%)
Other production occupations, including supervisors (9.9%)
Preschool, kindergarten, elementary, and middle school teachers (6.2%)
Other office and administrative support workers, including supervisors (5.5%)
Information and record clerks, except customer service representatives (5.1%)
Bookkeeping, accounting, and auditing clerks (4.5%)
Cooks and food preparation workers (4.1%)
Other management occupations, except farmers and farm managers (3.9%)
Air pollution and air quality trends(lower is better)
AQI Ozone PM2.5
Tornado activity:
Siloam Springs-area historical tornado activity is near Arkansas state average. It is 117% greater than the overall U.S. average.
On 10/8/1970, a category F3 (max. wind speeds 158-206 mph) tornado 2.6 miles away from the Siloam Springs city center injured 4 people and caused between $50,000 and $500,000 in damages.
On 3/12/2006, a category F3 tornado 6.2 miles away from the city center injured 12 people and caused $5 million in damages.
Earthquake activity:
Siloam Springs-area historical earthquake activity is significantly above Arkansas state average. It is 670% greater than the overall U.S. average. On 9/3/2016 at 12:02:44, a magnitude 5.8 (5.8 MW, Depth: 3.5 mi, Class: Moderate, Intensity: VI - VII) earthquake occurred 134.3 miles away from Siloam Springs center On 11/6/2011 at 03:53:10, a magnitude 5.7 (5.7 MW, Depth: 3.2 mi) earthquake occurred 132.6 miles away from Siloam Springs center On 11/7/2016 at 01:44:24, a magnitude 5.0 (5.0 MW, Depth: 2.8 mi) earthquake occurred 127.2 miles away from the city center On 11/5/2011 at 07:12:45, a magnitude 4.8 (4.8 MW, Depth: 1.9 mi, Class: Light, Intensity: IV - V) earthquake occurred 132.2 miles away from Siloam Springs center On 11/8/2011 at 02:46:57, a magnitude 4.8 (4.8 MW, Depth: 3.1 mi) earthquake occurred 133.9 miles away from the city center On 2/28/2011 at 05:00:50, a magnitude 4.7 (4.7 MW, Depth: 2.0 mi) earthquake occurred 138.0 miles away from the city center Magnitude types: moment magnitude (MW) Natural disasters: The number of natural disasters in Benton County (20) is greater than the US average (15).Major Disasters (Presidential) Declared: 14Emergencies Declared: 4Floods: 13, Storms: 13, Tornadoes: 6, Winter Storms: 4, Winds: 2, Drought: 1, Hurricane: 1, Other: 1 (Note: some incidents may be assigned to more than one category). Hospitals and medical centers in Siloam Springs: SILOAM SPRINGS REGIONAL HOSPITAL (Voluntary non-profit - Private, 603 NORTH PROGRESS AVENUE) SILOAM SPRINGS NURSING AND REHABILITATION CENTER (811 WEST ELGIN STREET)
DAVITA - SILOAM SPRINGS (500 S MT OLIVE STE 107)
DIALYSIS CENTER OF SILOAM SPRINGS (2125 E MAIN STE 12)
College/University in Siloam Springs: John Brown University Full-time enrollment: 2,097; Location: 2000 W University St; Private, not-for-profit; Website: www.jbu.edu; Offers Master's degree )
Other colleges/universities with over 2000 students near Siloam Springs:
University of Arkansas (about 22 miles; Fayetteville, AR ; Full-time enrollment: 22,163)
NorthWest Arkansas Community College (about 24 miles; Bentonville, AR ; FT enrollment: 5,634)
Northeastern State University (about 31 miles; Tahlequah, OK ; FT enrollment: 6,895)
Crowder College (about 45 miles; Neosho, MO ; FT enrollment: 3,675)
Northeastern Oklahoma A&M College (about 52 miles; Miami, OK ; FT enrollment: 2,075)
University of Arkansas-Fort Smith (about 56 miles; Fort Smith, AR ; FT enrollment: 6,103)
Rogers State University (about 62 miles; Claremore, OK ; FT enrollment: 3,482)
Public high school in Siloam Springs:
Public elementary/middle schools in Siloam Springs:
See full list of schools located in Siloam Springs
Notable locations in Siloam Springs: (A) , Siloam Springs Golf Course (B) , Siloam Springs Fire Department Station 1 Headquarters (C) , Siloam Springs Fire Department Station 3 (D) , Siloam Springs Advanced Life Support / Fire Station 2 (E) , Siloam Springs Police Department (F) , Siloam Springs Advanced Life Support / Rescue Station 2 (G) , Pulse Emergency Medical Services (H) . Display/hide their locations on the map
Churches in Siloam Springs include: (A) , Baptist Assembly Church (B) . Display/hide their locations on the map
Cemeteries: (1) , Gunter Cemetery (2) , Old Baptist Cemetery (3) . Display/hide their locations on the map
Parks in Siloam Springs include: (1) , Twin Springs Park (2) . Display/hide their locations on the map
Tourist attractions:
Hotels:
Birthplace of: Mike Dart - Cherokee basketweaver, Ray Powell (baseball) - Baseball player.
Benton County has a predicted average indoor radon screening level between 2 and 4 pCi/L (pico curies per liter) - Moderate Potential Average household size: This city:
2.7 peopleArkansas:
2.5 people
Percentage of family households: This city:
69.0%Whole state:
67.6%
Percentage of households with unmarried partners: This city:
6.4%Whole state:
5.7%
Likely homosexual households (counted as self-reported same-sex unmarried-partner households)
Lesbian couples: 0.4% of all households Gay men: 0.3% of all households
People in group quarters in Siloam Springs in 2010:
835 people in college/university student housing
100 people in nursing facilities/skilled-nursing facilities
57 people in other noninstitutional facilities
13 people in emergency and transitional shelters (with sleeping facilities) for people experiencing homelessness
People in group quarters in Siloam Springs in 2000:
711 people in college dormitories (includes college quarters off campus)
97 people in nursing homes
24 people in wards in general hospitals for patients who have no usual home elsewhere
5 people in hospitals/wards and hospices for chronically ill
5 people in other hospitals or wards for chronically ill
Banks with branches in Siloam Springs (2011 data):
Arvest Bank: Siloam Springs Downtown Branch, Siloam Springs Main Branch, Highway 412 East Branch. Info updated 2010/11/29: Bank assets: $12,520.8 mil, Deposits: $10,446.2 mil, headquarters in Fayetteville, AR, positive income , Commercial Lending Specialization, 241 total offices , Holding Company: Arvest Bank Group, Inc.
Liberty Bank of Arkansas: Siloam Springs Branch, Highland Park Branch, Siloam Springs East Branch. Info updated 2008/10/31: Bank assets: $2,807.0 mil, Deposits: $2,160.9 mil, headquarters in Jonesboro, AR, positive income , Commercial Lending Specialization, 46 total offices , Holding Company: Liberty Bancshares, Inc
Decatur State Bank: Bank Of Siloam Springs at 1660 West U.S. Highway 412, branch established on 1996/10/09. Info updated 2006/11/03: Bank assets: $166.0 mil, Deposits: $152.3 mil, headquarters in Decatur, AR, negative income in the last year , Agricultural Specialization, 3 total offices , Holding Company: Peterson Holding Company
Simmons First Bank of Northwest Arkansas: Siloam Springs Branch at 1002 South Mt. Olive, branch established on 1997/03/31. Info updated 2011/01/04: Bank assets: $249.9 mil, Deposits: $201.8 mil, headquarters in Rogers, AR, positive income , Commercial Lending Specialization, 10 total offices , Holding Company: Simmons First National Corporation
First Bank: Siloam Springs Branch at 200 Progress Avenue, Suite 100, branch established on 2006/11/20. Info updated 2012/02/13: Bank assets: $241.9 mil, Deposits: $216.3 mil, headquarters in Hampton, AR, positive income , Commercial Lending Specialization, 8 total offices , Holding Company: Harrell Bancshares, Inc.
For population 15 years and over in Siloam Springs:
Never married: 33.2%Now married: 53.5%Separated: 0.7%Widowed: 4.3%Divorced: 8.2% For population 25 years and over in Siloam Springs:
High school or higher: 82.4%Bachelor's degree or higher: 26.6%Graduate or professional degree: 8.3%Unemployed: 5.1%Mean travel time to work (commute): 18.6 minutes
Education Gini index (Inequality in education) Here:
17.1Arkansas average:
11.4
Religion statistics for Siloam Springs, AR (based on Benton County data)
Religion Adherents Congregations Evangelical Protestant 72,566 228 Catholic 16,757 4 Mainline Protestant 14,839 43 Other 4,857 20 None 112,320 -
Source: Clifford Grammich, Kirk Hadaway, Richard Houseal, Dale E.Jones, Alexei Krindatch, Richie Stanley and Richard H.Taylor. 2012. 2010 U.S.Religion Census: Religious Congregations & Membership Study. Association of Statisticians of American Religious Bodies. Jones, Dale E., et al. 2002. Congregations and Membership in the United States 2000. Nashville, TN: Glenmary Research Center. Graphs represent county-level data
Food Environment Statistics: Number of grocery stores : 25Here :
1.23 / 10,000 pop.State :
2.02 / 10,000 pop.
Number of supercenters and club stores : 6Here :
0.30 / 10,000 pop.Arkansas :
0.25 / 10,000 pop.
Number of convenience stores (no gas) : 7Here :
0.35 / 10,000 pop.State :
0.59 / 10,000 pop.
Number of convenience stores (with gas) : 79Benton County :
3.90 / 10,000 pop.State :
4.94 / 10,000 pop.
Number of full-service restaurants : 130Benton County :
6.42 / 10,000 pop.State :
6.66 / 10,000 pop.
Adult diabetes rate : Benton County :
7.9%State :
9.8%
Adult obesity rate : Benton County :
27.0%Arkansas :
29.1%
Low-income preschool obesity rate : Benton County :
15.4%Arkansas :
13.6%
Health and Nutrition: Healthy diet rate : Siloam Springs:
46.8%Arkansas:
48.2%
Average overall health of teeth and gums : This city:
43.5%State:
44.2%
Average BMI : Siloam Springs:
28.2Arkansas:
28.9
People feeling badly about themselves : This city:
22.5%Arkansas:
21.6%
People not drinking alcohol at all : Siloam Springs:
11.0%State:
11.3%
Average hours sleeping at night : This city:
6.8Arkansas:
6.8
Overweight people : This city:
30.7%Arkansas:
34.0%
General health condition : Average condition of hearing : Siloam Springs:
78.7%Arkansas:
78.0%
More about Health and Nutrition of Siloam Springs, AR Residents
Local government employment and payroll (March 2022)
Function
Full-time employees
Monthly full-time payroll
Average yearly full-time wage
Part-time employees
Monthly part-time payroll
Firefighters
52 $227,947 $52,603 3 $700 Police Protection - Officers
43 $214,285 $59,800 0 $0 Electric Power
28 $161,331 $69,142 0 $0 Streets and Highways
20 $66,734 $40,040 0 $0 Solid Waste Management
16 $52,007 $39,005 0 $0 Parks and Recreation
14 $44,328 $37,995 0 $0 Police - Other
13 $50,771 $46,866 0 $0 Financial Administration
13 $63,769 $58,864 0 $0 Water Supply
12 $63,951 $63,951 0 $0 Sewerage
9 $40,650 $54,200 0 $0 Housing and Community Development (Local)
9 $53,838 $71,784 0 $0 Other Government Administration
8 $42,519 $63,779 0 $0 Other and Unallocable
7 $33,161 $56,847 0 $0 Local Libraries
7 $22,389 $38,381 5 $3,523 Health
6 $19,187 $38,374 0 $0 Judicial and Legal
4 $23,467 $70,401 0 $0 Fire - Other
2 $4,817 $28,902 0 $0 Airports
1 $4,367 $52,404 0 $0 Welfare
0 $0 3 $1,893
Totals for Government
264 $1,189,517 $54,069 11 $6,116
Siloam Springs government finances - Expenditure in 2021 (per resident):
Construction - Water Utilities: $7,600,000 ($407.42)
Regular Highways: $2,147,000 ($115.10)Electric Utilities: $2,032,000 ($108.93)Central Staff Services: $749,000 ($40.15)Sewerage: $210,000 ($11.26)Police Protection: $165,000 ($8.85)Financial Administration: $146,000 ($7.83)Air Transportation: $72,000 ($3.86)Local Fire Protection: $40,000 ($2.14)General - Other: $21,000 ($1.13)Libraries: $12,000 ($0.64)Parks and Recreation: $3,000 ($0.16)Current Operations - Electric Utilities: $16,757,000 ($898.31)
Local Fire Protection: $4,946,000 ($265.14)Police Protection: $4,413,000 ($236.57)Solid Waste Management: $2,598,000 ($139.27)Sewerage: $2,299,000 ($123.24)Regular Highways: $2,054,000 ($110.11)Water Utilities: $1,972,000 ($105.71)Protective Inspection and Regulation - Other: $1,708,000 ($91.56)Financial Administration: $1,595,000 ($85.50)Parks and Recreation: $1,331,000 ($71.35)Central Staff Services: $1,162,000 ($62.29)Air Transportation: $491,000 ($26.32)Libraries: $489,000 ($26.21)Judicial and Legal Services: $364,000 ($19.51)General - Other: $277,000 ($14.85)General - Interest on Debt: $62,000 ($3.32)
Other Capital Outlay - Solid Waste Management: $1,231,000 ($65.99)
Local Fire Protection: $506,000 ($27.13)Electric Utilities: $398,000 ($21.34)Regular Highways: $346,000 ($18.55)Police Protection: $253,000 ($13.56)Water Utilities: $159,000 ($8.52)Parks and Recreation: $77,000 ($4.13)General - Other: $75,000 ($4.02)Sewerage: $29,000 ($1.55)Financial Administration: $24,000 ($1.29)Total Salaries and Wages: $18,745,000 ($1004.88)
Water Utilities - Interest on Debt: $17,000 ($0.91)
Siloam Springs government finances - Revenue in 2021 (per resident):
Charges - Sewerage: $4,270,000 ($228.91)
Solid Waste Management: $3,338,000 ($178.94)Other: $1,404,000 ($75.27)Air Transportation: $381,000 ($20.42)Miscellaneous Commercial Activities: $89,000 ($4.77)Parks and Recreation: $44,000 ($2.36)Federal Intergovernmental - Other: $704,000 ($37.74)
Air Transportation: $61,000 ($3.27)Highways: $53,000 ($2.84)Local Intergovernmental - General Local Government Support: $3,950,000 ($211.75)
Other: $272,000 ($14.58)Miscellaneous - Interest Earnings: $440,000 ($23.59)
Fines and Forfeits: $314,000 ($16.83)General Revenue - Other: $181,000 ($9.70)Sale of Property: $59,000 ($3.16)Donations From Private Sources: $37,000 ($1.98)Rents: $22,000 ($1.18)Revenue - Electric Utilities: $23,349,000 ($1251.69)
Water Utilities: $5,036,000 ($269.97)State Intergovernmental - Highways: $1,135,000 ($60.84)
Other: $1,105,000 ($59.24)General Local Government Support: $223,000 ($11.95)Tax - General Sales and Gross Receipts: $8,987,000 ($481.77)
Property: $1,804,000 ($96.71)Other License: $239,000 ($12.81)Public Utilities Sales: $230,000 ($12.33)Other Selective Sales: $89,000 ($4.77)Alcoholic Beverage License: $30,000 ($1.61)Alcoholic Beverage Sales: $25,000 ($1.34)Occupation and Business License - Other: $6,000 ($0.32)
Siloam Springs government finances - Debt in 2021 (per resident):
Long Term Debt - Outstanding Unspecified Public Purpose: $9,799,000 ($525.30)
Issue, Unspecified Public Purpose: $6,943,000 ($372.20)Beginning Outstanding - Public Debt for Private Purpose: $5,990,000 ($321.11)Outstanding Nonguaranteed - Industrial Revenue: $5,605,000 ($300.47)Beginning Outstanding - Unspecified Public Purpose: $3,886,000 ($208.32)Retired Unspecified Public Purpose: $1,029,000 ($55.16)Retired Nonguaranteed - Public Debt for Private Purpose: $385,000 ($20.64)
Siloam Springs government finances - Cash and Securities in 2021 (per resident):
Bond Funds - Cash and Securities: $1,988,000 ($106.57)
Other Funds - Cash and Securities: $37,347,000 ($2002.09)
Sinking Funds - Cash and Securities: $11,163,000 ($598.42)
Businesses in Siloam Springs, AR
Name Count Name Count
AT&T 1 New Balance 2 Arby's 1 Nike 3 AutoZone 1 Pizza Hut 1 Chevrolet 1 Quality 1 Curves 1 Quiznos 1 Domino's Pizza 1 RadioShack 1 FedEx 3 SONIC Drive-In 1 Ford 1 Subway 1 GameStop 1 Super 8 1 H&R Block 2 Taco Bell 1 Hardee's 1 True Value 1 Hilton 1 U-Haul 4 Jones New York 1 UPS 2 KFC 1 Vans 1 Long John Silver's 1 Verizon Wireless 2 Lowe's 1 Walgreens 1 Maurices 1 Walmart 1 McDonald's 2
Strongest AM radio stations in Siloam Springs:
KUOA (1290 AM; 5 kW; SILOAM SPRINGS, AR; Owner: KUOA, INC.)
KFAY (1030 AM; 10 kW; FARMINGTON, AR; Owner: CUMULUS LICENSING CORP)
KURM (790 AM; 5 kW; ROGERS, AR; Owner: KERM, INC)
KFAQ (1170 AM; 50 kW; TULSA, OK; Owner: JOURNAL BROADCAST CORPORATION)
KRMG (740 AM; 50 kW; TULSA, OK; Owner: CXR HOLDINGS, INC.)
KREB (1190 AM; daytime; 2 kW; BENTONVILLE/BELLA VI, AR; Owner: BUTLER BROADCASTING COMPANY, LLC)
KBTN (1420 AM; 10 kW; NEOSHO, MO; Owner: PETRACOM OF JOPLIN, L.L.C.)
KZRA (1590 AM; 2 kW; SPRINGDALE, AR; Owner: CUMULUS LICENSING CORP.)
KTBZ (1430 AM; 25 kW; TULSA, OK; Owner: CLEAR CHANNEL BROADCASTING LICENSES, INC.)
KYHN (1320 AM; 10 kW; FORT SMITH, AR; Owner: CAPSTAR TX LIMITED PARTNERSHIP)
KOFC (1250 AM; 1 kW; FAYETTEVILLE, AR; Owner: WILLIAM B. DISNEY & MARTHA J. DISNEY)
KMUS (1380 AM; 20 kW; MUSKOGEE, OK; Owner: ABC, INC.)
KGHT (880 AM; 50 kW; SHERIDAN, AR; Owner: METROPOLITAN RADIO GROUP, INC.)
Strongest FM radio stations in Siloam Springs:
KLRC (101.1 FM; SILOAM SPRINGS, AR; Owner: JOHN BROWN UNIVERSITY)
KBVA (106.5 FM; BELLA VISTA, AR; Owner: GAYLA JOY HENDREN)
KMCK-FM (105.7 FM; SILOAM SPRINGS, AR; Owner: CUMULUS LICENSING CORP.)
KDAB (94.9 FM; PRAIRIE GROVE, AR; Owner: CUMULUS LICENSING CORP.)
KAYH (89.3 FM; FAYETTEVILLE, AR; Owner: FAMILY VISION MINISTRIES, INC.)
KEZA (107.9 FM; FAYETTEVILLE, AR; Owner: CAPSTAR TX LIMITED PARTNERSHIP)
KURM-FM (100.3 FM; SOUTHWEST CITY, MO; Owner: KERM, INC.)
KUAF (91.3 FM; FAYETTEVILLE, AR; Owner: BOARD OF TRUSTEES OF THE UNIVERSITY OF ARKANSAS)
KKIX (103.9 FM; FAYETTEVILLE, AR; Owner: CAPSTAR TX LIMITED PARTNERSHIP)
KISR (93.7 FM; FORT SMITH, AR; Owner: STEREO 93, INC.)
K203CE (88.5 FM; SPRINGDALE, AR; Owner: BIBLE BROADCASTING NETWORK, INC.)
KXNA (104.9 FM; SPRINGDALE, AR; Owner: BUTLER BROADCASTING COMPANY, LLC)
KFAY-FM (98.3 FM; BENTONVILLE, AR; Owner: CUMULUS LICENSING CORP)
K244DS (96.7 FM; FAYETTEVILLE, AR; Owner: BUTLER BROADCASTING COMPANY, LLC)
KMXF (101.9 FM; LOWELL, AR; Owner: CAPSTAR TX LIMITED PARTNERSHIP)
KAMO-FM (94.3 FM; ROGERS, AR; Owner: CUMULUS LICENSING CORP.)
KKEG (92.1 FM; FAYETTEVILLE, AR; Owner: CUMULUS LICENSING CORP)
KSEC (95.7 FM; BENTONVILLE, AR; Owner: BENTONVILLE BROADCASTING, LLC)
K204CA (88.7 FM; TAHLEQUAH, OK; Owner: THE MOODY BIBLE INSTITUTE OF CHICAGO)
KXUA (88.3 FM; FAYETTEVILLE, AR; Owner: BRD. OF TRUST. OF UNIV. OF ARKANSAS)
TV broadcast stations around Siloam Springs:
K33FG (Channel 33; SILOAM SPRINGS, AR; Owner: FORT SMITH 46, INC.)
KSBN-TV (Channel 57; SPRINGDALE, AR; Owner: TOTAL LIFE COMMUNITY EDUCATIONAL FOUNDATION)
KFSM-TV (Channel 5; FORT SMITH, AR; Owner: NEW YORK TIMES MANAGEMENT SERVICES)
KAFT (Channel 13; FAYETTEVILLE, AR; Owner: ARKANSAS EDUCATIONAL TELEVISION COMMISSION)
K62DQ (Channel 62; FAYETTEVILLE, ETC., AR; Owner: NEW YORK TIMES MANAGEMENT SERVICES)
K64FO (Channel 64; FAYETTEVILLE, AR; Owner: FORT SMITH 46, INC.)
KFAA (Channel 51; ROGERS, AR; Owner: J.D.G. TELEVISION, INC.)
KHOG-TV (Channel 29; FAYETTEVILLE, AR; Owner: KHBS HEARST-ARGYLE TELEVISION, INC.)
K15DR (Channel 15; SPRINGDALE, AR; Owner: FORT SMITH 46, INC.)
K59ES (Channel 59; HINDSVILLE, AR; Owner: FORT SMITH 46, INC.)
K67EO (Channel 67; BENTONVILLE, AR; Owner: NEW YORK TIMES MANAGEMENT SERVICES)
K45EI (Channel 45; BENTONVILLE & ROGERS, AR; Owner: VICTORY COMMUNICATIONS, INC.)
National Bridge Inventory (NBI) Statistics 41 Number of bridges620ft / 189m Total length $1,570,000 Total costs216,003 Total average daily traffic9,272 Total average daily truck traffic
New bridges - historical statistics
1 1920-1929 1 1940-1949 2 1950-1959 3 1960-1969 8 1970-1979 7 1990-1999 5 2000-2009 11 2010-2019
See full National Bridge Inventory statistics for Siloam Springs, AR
Home Mortgage Disclosure Act Aggregated Statistics For Year 2009(Based on 3 partial tracts) A) FHA, FSA/RHS & VA B) Conventional C) Refinancings D) Home Improvement Loans E) Loans on Dwellings For 5+ Families F) Non-occupant Loans on G) Loans On Manufactured Number Average Value Number Average Value Number Average Value Number Average Value Number Average Value Number Average Value Number Average Value
LOANS ORIGINATED 59 $106,426 18 $137,172 136 $115,042 16 $18,461 4 $227,602 15 $110,861 4 $21,135 APPLICATIONS APPROVED, NOT ACCEPTED 2 $74,520 2 $101,645 4 $130,660 1 $21,090 0 $0 1 $125,850 1 $46,570 APPLICATIONS DENIED 10 $105,858 10 $94,065 53 $136,173 6 $18,103 0 $0 2 $126,645 0 $0 APPLICATIONS WITHDRAWN 3 $181,777 2 $101,735 22 $125,099 2 $31,915 0 $0 1 $38,420 0 $0 FILES CLOSED FOR INCOMPLETENESS 3 $80,137 1 $34,350 7 $122,127 0 $0 0 $0 1 $66,990 0 $0
Aggregated Statistics For Year 2008(Based on 3 partial tracts) A) FHA, FSA/RHS & VA B) Conventional C) Refinancings D) Home Improvement Loans E) Loans on Dwellings For 5+ Families F) Non-occupant Loans on G) Loans On Manufactured Number Average Value Number Average Value Number Average Value Number Average Value Number Average Value Number Average Value Number Average Value
LOANS ORIGINATED 44 $116,269 50 $104,013 103 $108,325 27 $33,154 2 $392,680 33 $99,748 5 $32,304 APPLICATIONS APPROVED, NOT ACCEPTED 2 $94,105 2 $77,195 7 $109,563 1 $33,300 0 $0 1 $5,810 1 $61,830 APPLICATIONS DENIED 7 $100,761 16 $91,832 65 $127,112 7 $46,037 0 $0 10 $109,325 3 $61,287 APPLICATIONS WITHDRAWN 2 $85,340 5 $109,250 22 $118,883 0 $0 0 $0 2 $58,930 0 $0 FILES CLOSED FOR INCOMPLETENESS 1 $161,070 1 $116,270 10 $126,035 0 $0 0 $0 3 $122,653 0 $0
Aggregated Statistics For Year 2007(Based on 3 partial tracts) A) FHA, FSA/RHS & VA B) Conventional C) Refinancings D) Home Improvement Loans E) Loans on Dwellings For 5+ Families F) Non-occupant Loans on G) Loans On Manufactured Number Average Value Number Average Value Number Average Value Number Average Value Number Average Value Number Average Value Number Average Value
LOANS ORIGINATED 23 $123,537 146 $107,950 123 $112,419 38 $36,967 1 $161,190 62 $109,559 5 $37,886 APPLICATIONS APPROVED, NOT ACCEPTED 0 $0 10 $109,090 10 $100,920 8 $40,291 0 $0 1 $54,380 4 $74,278 APPLICATIONS DENIED 7 $125,447 39 $106,023 67 $120,030 14 $33,316 1 $1,522,080 10 $85,724 6 $64,670 APPLICATIONS WITHDRAWN 3 $94,980 10 $113,415 19 $119,001 3 $63,927 0 $0 3 $94,720 0 $0 FILES CLOSED FOR INCOMPLETENESS 0 $0 4 $99,425 7 $135,313 0 $0 0 $0 1 $89,840 0 $0
Aggregated Statistics For Year 2006(Based on 3 partial tracts) A) FHA, FSA/RHS & VA B) Conventional C) Refinancings D) Home Improvement Loans F) Non-occupant Loans on G) Loans On Manufactured Number Average Value Number Average Value Number Average Value Number Average Value Number Average Value Number Average Value
LOANS ORIGINATED 25 $124,292 177 $98,360 123 $101,737 45 $34,193 63 $88,603 3 $55,760 APPLICATIONS APPROVED, NOT ACCEPTED 1 $88,260 15 $92,809 17 $105,102 7 $47,266 3 $76,797 3 $78,687 APPLICATIONS DENIED 4 $120,572 47 $91,797 56 $105,661 19 $20,757 6 $72,218 7 $43,623 APPLICATIONS WITHDRAWN 1 $58,700 17 $125,152 47 $128,482 4 $23,810 7 $91,591 1 $14,040 FILES CLOSED FOR INCOMPLETENESS 0 $0 3 $94,427 13 $109,441 0 $0 1 $185,000 0 $0
Aggregated Statistics For Year 2005(Based on 3 partial tracts) A) FHA, FSA/RHS & VA B) Conventional C) Refinancings D) Home Improvement Loans E) Loans on Dwellings For 5+ Families F) Non-occupant Loans on G) Loans On Manufactured Number Average Value Number Average Value Number Average Value Number Average Value Number Average Value Number Average Value Number Average Value
LOANS ORIGINATED 40 $107,537 214 $97,207 125 $102,310 35 $25,612 1 $237,720 60 $83,878 4 $26,750 APPLICATIONS APPROVED, NOT ACCEPTED 2 $115,730 15 $94,915 21 $110,804 3 $19,250 0 $0 2 $80,705 4 $62,762 APPLICATIONS DENIED 9 $84,673 44 $77,564 72 $101,272 18 $33,509 0 $0 13 $79,397 8 $56,932 APPLICATIONS WITHDRAWN 3 $107,220 15 $126,411 57 $103,236 5 $96,094 0 $0 3 $79,223 1 $30,650 FILES CLOSED FOR INCOMPLETENESS 1 $105,910 6 $71,885 9 $100,139 1 $26,950 0 $0 1 $42,110 0 $0
Aggregated Statistics For Year 2004(Based on 3 partial tracts) A) FHA, FSA/RHS & VA B) Conventional C) Refinancings D) Home Improvement Loans F) Non-occupant Loans on G) Loans On Manufactured Number Average Value Number Average Value Number Average Value Number Average Value Number Average Value Number Average Value
LOANS ORIGINATED 37 $97,317 127 $96,327 147 $80,611 33 $24,822 52 $72,434 6 $34,798 APPLICATIONS APPROVED, NOT ACCEPTED 2 $59,525 10 $75,847 23 $83,398 1 $70,820 2 $47,035 3 $36,270 APPLICATIONS DENIED 5 $93,250 38 $73,942 68 $85,550 15 $30,571 11 $70,758 10 $35,911 APPLICATIONS WITHDRAWN 1 $67,630 10 $87,206 37 $98,316 4 $12,985 3 $88,613 0 $0 FILES CLOSED FOR INCOMPLETENESS 1 $51,260 3 $75,640 11 $73,795 0 $0 2 $61,915 0 $0
Aggregated Statistics For Year 2003(Based on 3 partial tracts) A) FHA, FSA/RHS & VA B) Conventional C) Refinancings D) Home Improvement Loans E) Loans on Dwellings For 5+ Families F) Non-occupant Loans on Number Average Value Number Average Value Number Average Value Number Average Value Number Average Value Number Average Value
LOANS ORIGINATED 39 $88,154 120 $83,999 233 $77,991 26 $25,822 2 $1,651,565 49 $67,590 APPLICATIONS APPROVED, NOT ACCEPTED 4 $76,838 14 $83,480 11 $77,099 2 $20,180 0 $0 3 $107,997 APPLICATIONS DENIED 4 $92,875 27 $62,612 54 $78,090 9 $11,288 0 $0 5 $44,646 APPLICATIONS WITHDRAWN 4 $75,312 9 $70,829 41 $91,898 3 $15,163 0 $0 4 $57,228 FILES CLOSED FOR INCOMPLETENESS 2 $62,160 5 $79,542 8 $81,744 0 $0 0 $0 1 $34,450
Aggregated Statistics For Year 2002(Based on 3 partial tracts) A) FHA, FSA/RHS & VA B) Conventional C) Refinancings D) Home Improvement Loans E) Loans on Dwellings For 5+ Families F) Non-occupant Loans on Number Average Value Number Average Value Number Average Value Number Average Value Number Average Value Number Average Value
LOANS ORIGINATED 48 $81,609 102 $77,149 176 $68,265 32 $21,252 1 $47,560 52 $62,574 APPLICATIONS APPROVED, NOT ACCEPTED 1 $82,060 10 $70,181 17 $56,747 6 $11,593 0 $0 3 $74,820 APPLICATIONS DENIED 7 $80,503 20 $58,010 41 $92,842 15 $8,294 0 $0 5 $58,616 APPLICATIONS WITHDRAWN 3 $77,337 9 $75,328 25 $82,365 4 $16,835 0 $0 3 $76,917 FILES CLOSED FOR INCOMPLETENESS 1 $96,480 2 $70,775 11 $80,092 1 $47,340 0 $0 0 $0
Aggregated Statistics For Year 2001(Based on 3 partial tracts) A) FHA, FSA/RHS & VA B) Conventional C) Refinancings D) Home Improvement Loans E) Loans on Dwellings For 5+ Families F) Non-occupant Loans on Number Average Value Number Average Value Number Average Value Number Average Value Number Average Value Number Average Value
LOANS ORIGINATED 50 $72,671 103 $80,989 127 $75,036 32 $16,972 1 $63,420 38 $69,321 APPLICATIONS APPROVED, NOT ACCEPTED 0 $0 8 $71,696 12 $76,704 2 $30,675 0 $0 0 $0 APPLICATIONS DENIED 6 $90,057 23 $46,633 41 $62,174 8 $7,984 0 $0 4 $47,982 APPLICATIONS WITHDRAWN 5 $85,516 5 $62,970 25 $81,857 1 $4,230 0 $0 4 $62,012 FILES CLOSED FOR INCOMPLETENESS 1 $54,440 1 $74,780 5 $76,620 0 $0 0 $0 0 $0
Aggregated Statistics For Year 2000(Based on 3 partial tracts) A) FHA, FSA/RHS & VA B) Conventional C) Refinancings D) Home Improvement Loans E) Loans on Dwellings For 5+ Families F) Non-occupant Loans on Number Average Value Number Average Value Number Average Value Number Average Value Number Average Value Number Average Value
LOANS ORIGINATED 42 $69,328 93 $78,354 51 $63,793 32 $12,562 1 $236,060 16 $68,184 APPLICATIONS APPROVED, NOT ACCEPTED 3 $49,223 12 $51,390 8 $58,998 2 $19,420 0 $0 0 $0 APPLICATIONS DENIED 5 $53,980 29 $51,987 54 $53,469 12 $14,904 0 $0 1 $26,420 APPLICATIONS WITHDRAWN 3 $69,047 6 $88,547 23 $57,468 4 $20,532 0 $0 0 $0 FILES CLOSED FOR INCOMPLETENESS 1 $66,910 2 $70,760 6 $47,623 0 $0 0 $0 0 $0
Aggregated Statistics For Year 1999(Based on 3 partial tracts) A) FHA, FSA/RHS & VA B) Conventional C) Refinancings D) Home Improvement Loans E) Loans on Dwellings For 5+ Families F) Non-occupant Loans on Number Average Value Number Average Value Number Average Value Number Average Value Number Average Value Number Average Value
LOANS ORIGINATED 34 $70,516 77 $73,205 94 $68,528 48 $15,601 2 $389,350 23 $46,064 APPLICATIONS APPROVED, NOT ACCEPTED 2 $54,000 11 $48,639 15 $73,620 2 $16,095 0 $0 1 $13,240 APPLICATIONS DENIED 12 $73,552 45 $46,632 50 $61,311 13 $29,665 0 $0 2 $70,030 APPLICATIONS WITHDRAWN 5 $82,958 8 $64,838 12 $55,295 6 $50,208 0 $0 1 $56,810 FILES CLOSED FOR INCOMPLETENESS 2 $45,490 2 $70,205 2 $69,425 0 $0 0 $0 0 $0
Detailed HMDA statistics for the following Tracts:
0211.00
, 0212.01 , 0212.02
Private Mortgage Insurance Companies Aggregated Statistics For Year 2009(Based on 3 partial tracts) A) Conventional B) Refinancings C) Non-occupant Loans on Number Average Value Number Average Value Number Average Value
LOANS ORIGINATED 3 $135,787 1 $122,610 0 $0 APPLICATIONS APPROVED, NOT ACCEPTED 1 $54,960 3 $193,437 1 $54,960 APPLICATIONS DENIED 0 $0 2 $213,985 0 $0 APPLICATIONS WITHDRAWN 0 $0 1 $50,740 0 $0 FILES CLOSED FOR INCOMPLETENESS 0 $0 0 $0 0 $0
Aggregated Statistics For Year 2008(Based on 3 partial tracts) A) Conventional B) Refinancings C) Non-occupant Loans on D) Loans On Manufactured Number Average Value Number Average Value Number Average Value Number Average Value
LOANS ORIGINATED 15 $146,789 4 $142,758 1 $113,920 0 $0 APPLICATIONS APPROVED, NOT ACCEPTED 6 $116,683 2 $173,065 1 $151,430 0 $0 APPLICATIONS DENIED 3 $128,677 1 $175,960 1 $181,280 0 $0 APPLICATIONS WITHDRAWN 1 $58,130 1 $59,190 0 $0 1 $58,130 FILES CLOSED FOR INCOMPLETENESS 1 $64,480 0 $0 1 $64,480 0 $0
Aggregated Statistics For Year 2007(Based on 3 partial tracts) A) Conventional B) Refinancings C) Non-occupant Loans on Number Average Value Number Average Value Number Average Value
LOANS ORIGINATED 65 $120,303 23 $135,709 10 $105,044 APPLICATIONS APPROVED, NOT ACCEPTED 3 $118,003 3 $121,483 1 $39,560 APPLICATIONS DENIED 1 $45,450 0 $0 0 $0 APPLICATIONS WITHDRAWN 5 $95,154 2 $92,190 1 $95,130 FILES CLOSED FOR INCOMPLETENESS 0 $0 0 $0 0 $0
Aggregated Statistics For Year 2006(Based on 3 partial tracts) A) Conventional B) Refinancings C) Non-occupant Loans on Number Average Value Number Average Value Number Average Value
LOANS ORIGINATED 62 $110,766 10 $134,129 4 $108,630 APPLICATIONS APPROVED, NOT ACCEPTED 3 $144,717 2 $89,030 1 $50,400 APPLICATIONS DENIED 0 $0 1 $116,800 0 $0 APPLICATIONS WITHDRAWN 3 $108,520 4 $162,398 4 $103,978 FILES CLOSED FOR INCOMPLETENESS 0 $0 0 $0 0 $0
Aggregated Statistics For Year 2005(Based on 3 partial tracts) A) Conventional B) Refinancings C) Non-occupant Loans on Number Average Value Number Average Value Number Average Value
LOANS ORIGINATED 81 $110,608 14 $117,001 14 $80,250 APPLICATIONS APPROVED, NOT ACCEPTED 5 $121,284 2 $111,250 0 $0 APPLICATIONS DENIED 1 $63,800 0 $0 0 $0 APPLICATIONS WITHDRAWN 2 $124,980 3 $149,050 1 $86,130 FILES CLOSED FOR INCOMPLETENESS 1 $46,510 0 $0 0 $0
Aggregated Statistics For Year 2004(Based on 3 partial tracts) A) Conventional B) Refinancings C) Non-occupant Loans on Number Average Value Number Average Value Number Average Value
LOANS ORIGINATED 30 $100,800 27 $88,269 3 $99,413 APPLICATIONS APPROVED, NOT ACCEPTED 3 $119,883 2 $75,145 1 $58,130 APPLICATIONS DENIED 1 $82,450 0 $0 1 $43,340 APPLICATIONS WITHDRAWN 3 $95,443 0 $0 0 $0 FILES CLOSED FOR INCOMPLETENESS 0 $0 0 $0 0 $0
Aggregated Statistics For Year 2003(Based on 3 partial tracts) A) Conventional B) Refinancings C) Non-occupant Loans on Number Average Value Number Average Value Number Average Value
LOANS ORIGINATED 46 $97,460 53 $101,713 7 $67,849 APPLICATIONS APPROVED, NOT ACCEPTED 1 $63,950 3 $75,380 1 $55,730 APPLICATIONS DENIED 1 $49,760 0 $0 0 $0 APPLICATIONS WITHDRAWN 2 $83,765 4 $90,522 1 $80,790 FILES CLOSED FOR INCOMPLETENESS 0 $0 0 $0 0 $0
Aggregated Statistics For Year 2002(Based on 3 partial tracts) A) Conventional B) Refinancings C) Non-occupant Loans on Number Average Value Number Average Value Number Average Value
LOANS ORIGINATED 36 $91,996 20 $93,058 2 $75,425 APPLICATIONS APPROVED, NOT ACCEPTED 1 $25,880 2 $79,785 0 $0 APPLICATIONS DENIED 1 $118,030 1 $33,300 1 $57,420 APPLICATIONS WITHDRAWN 5 $81,716 0 $0 1 $32,240 FILES CLOSED FOR INCOMPLETENESS 0 $0 0 $0 0 $0
Aggregated Statistics For Year 2001(Based on 3 partial tracts) A) Conventional B) Refinancings C) Non-occupant Loans on Number Average Value Number Average Value Number Average Value
LOANS ORIGINATED 34 $86,334 13 $90,260 3 $76,357 APPLICATIONS APPROVED, NOT ACCEPTED 1 $69,170 2 $68,055 1 $34,080 APPLICATIONS DENIED 1 $39,110 0 $0 1 $39,110 APPLICATIONS WITHDRAWN 0 $0 0 $0 0 $0 FILES CLOSED FOR INCOMPLETENESS 0 $0 0 $0 0 $0
Aggregated Statistics For Year 2000(Based on 3 partial tracts) A) Conventional B) Refinancings C) Non-occupant Loans on Number Average Value Number Average Value Number Average Value
LOANS ORIGINATED 23 $85,256 4 $77,628 2 $44,130 APPLICATIONS APPROVED, NOT ACCEPTED 1 $109,200 1 $49,680 0 $0 APPLICATIONS DENIED 0 $0 1 $70,180 0 $0 APPLICATIONS WITHDRAWN 0 $0 0 $0 0 $0 FILES CLOSED FOR INCOMPLETENESS 0 $0 0 $0 0 $0
Aggregated Statistics For Year 1999(Based on 3 partial tracts) A) Conventional B) Refinancings C) Non-occupant Loans on Number Average Value Number Average Value Number Average Value
LOANS ORIGINATED 18 $89,316 7 $108,577 1 $29,120 APPLICATIONS APPROVED, NOT ACCEPTED 0 $0 1 $76,060 0 $0 APPLICATIONS DENIED 0 $0 0 $0 0 $0 APPLICATIONS WITHDRAWN 0 $0 0 $0 0 $0 FILES CLOSED FOR INCOMPLETENESS 0 $0 0 $0 0 $0
Detailed PMIC statistics for the following Tracts:
0211.00
, 0212.01 , 0212.02 Fire-safe hotels and motels in Siloam Springs, Arkansas:
Hampton Inn Siloam Springs, 2171 Ravenwood Plz, Siloam Springs, Arkansas 72761 Phone: (479) 215-1000, Fax: (479) 215-1010
Americas Best Value Inn & Suites, 1801 Hwy 412 W, Siloam Springs, Arkansas 72761 Phone: (479) 524-2025, Fax: (479) 524-2589
Holiday Inn Express & Suites, 2100 Hwy 412 W, Siloam springs, Arkansas 72761 Phone: (479) 549-1833
All 3 fire-safe hotels and motels in Siloam Springs, Arkansas
Most common first names in Siloam Springs, AR among deceased individuals Name Count Lived (average)
John 99 76.2 years Mary 94 80.4 years William 93 75.8 years James 87 71.5 years George 55 76.6 years Charles 53 76.1 years Robert 52 72.9 years Ruth 36 79.9 years Thomas 30 73.3 years Henry 29 76.8 years
Most common last names in Siloam Springs, AR among deceased individuals Last name Count Lived (average)
Smith 63 79.7 years Davis 45 78.4 years Jones 36 77.4 years Williams 31 76.9 years Johnson 31 80.2 years Walker 29 75.5 years Brown 27 78.2 years Wilson 24 74.5 years Clark 21 68.5 years Robinson 21 81.0 years
Siloam Springs compared to Arkansas state average:
Unemployed percentage significantly below state average. Black race population percentage significantly below state average. Hispanic race population percentage significantly above state average. Median age significantly below state average. Foreign-born population percentage significantly above state average. Length of stay since moving in significantly above state average. Number of college students above state average. Percentage of population with a bachelor's degree or higher above state average.
Top Patent Applicants
David G. Korte (4)
William Goertzen (2)
Billy Eugene Turner (1)
Robert J. Lavey (1)
Cody Alan Ulaga (1)
Arie Barnhill (1)
Marty Fell (1)
Brian G. Karp (1)
Rick Magley (1)
Barbara K. Gifford (1)
Total of 21 patent applications in 2008-2024.
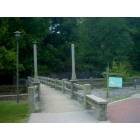
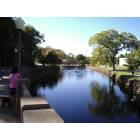
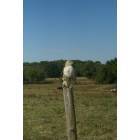
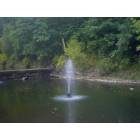

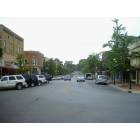
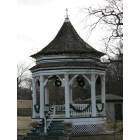
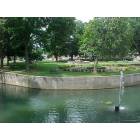
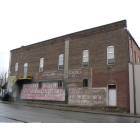
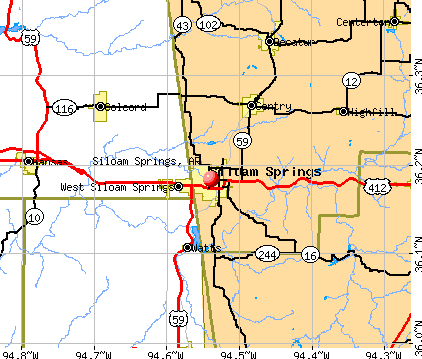


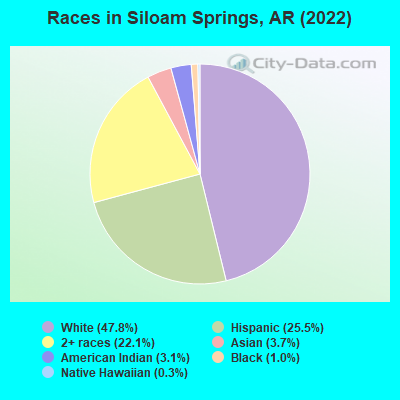
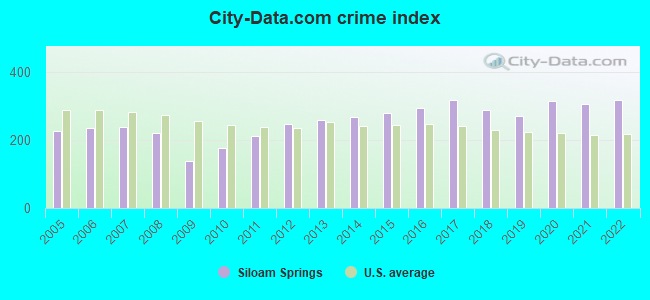
 Recent articles from our blog. Our writers, many of them Ph.D. graduates or candidates, create easy-to-read articles on a wide variety of topics.

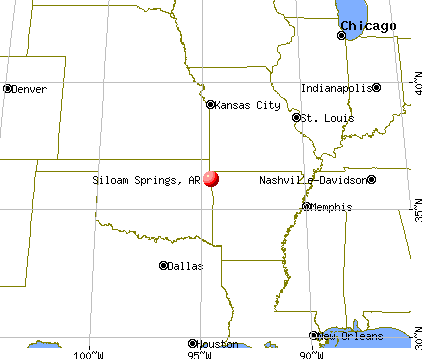
 (22.4 miles
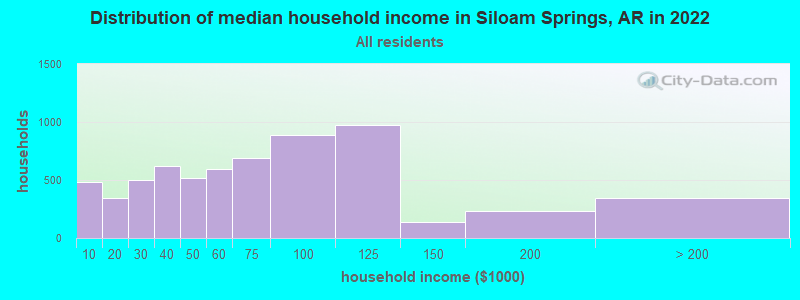
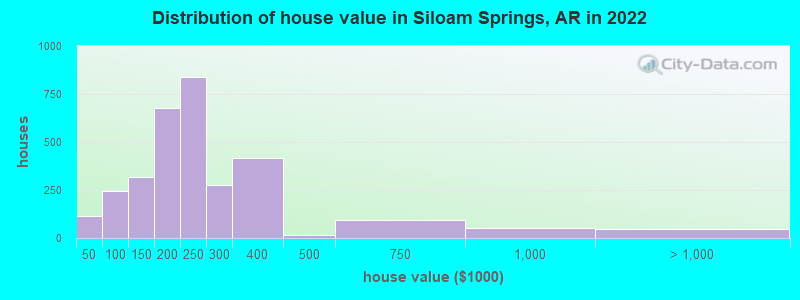

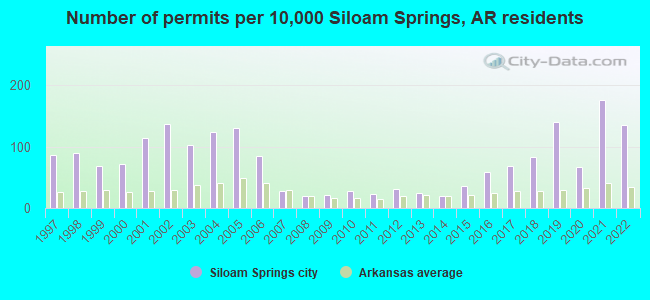
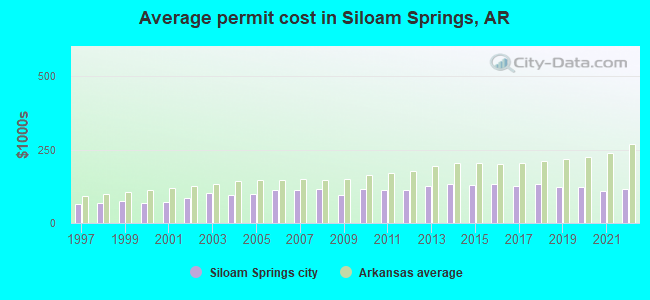
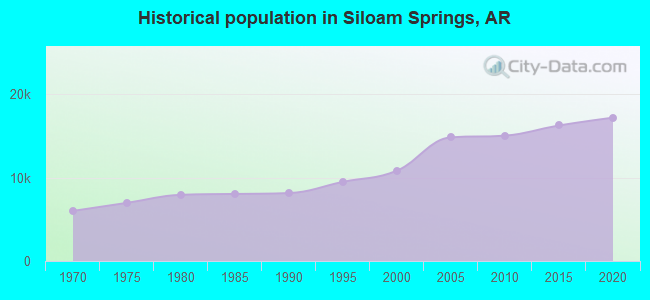
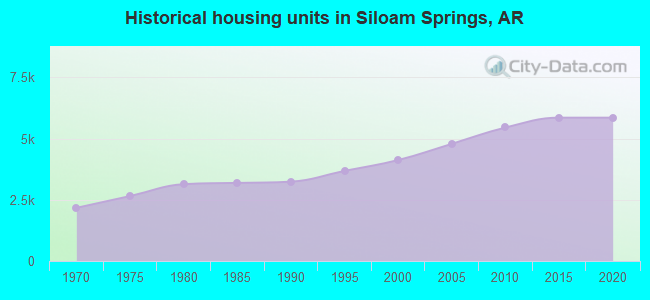
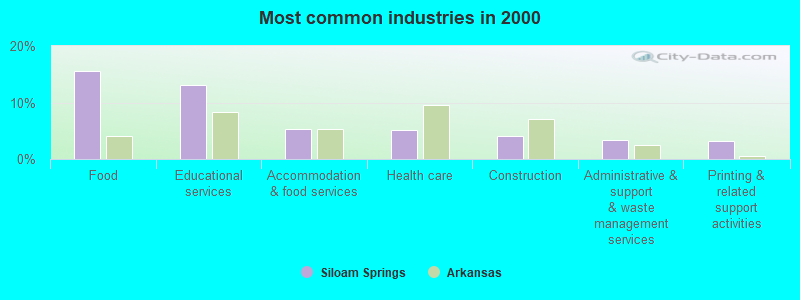
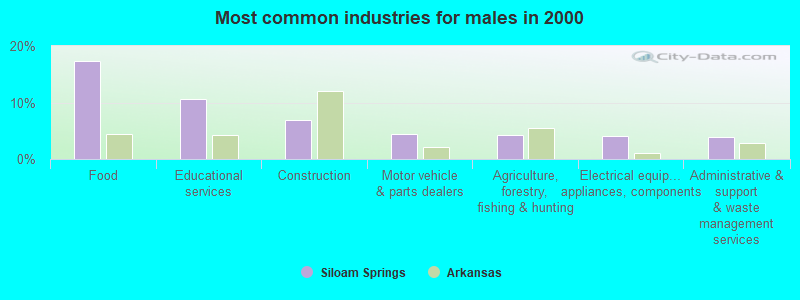
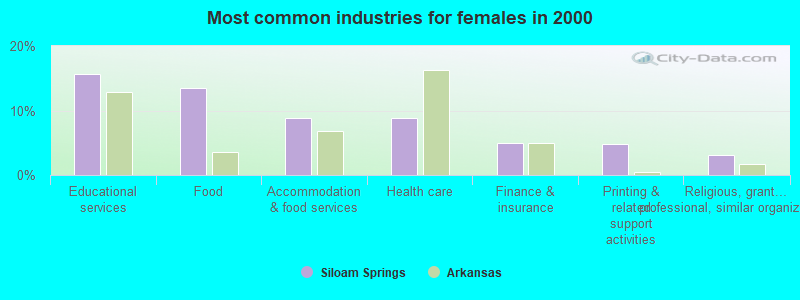
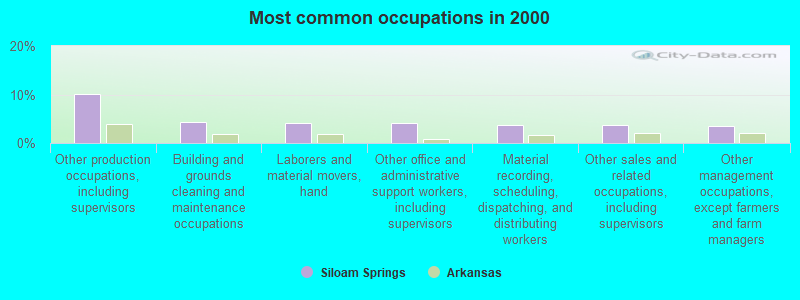
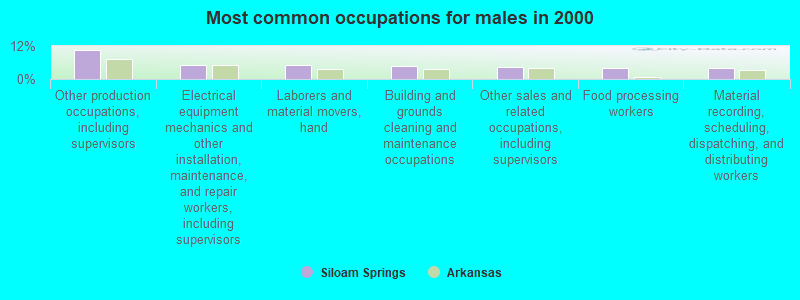
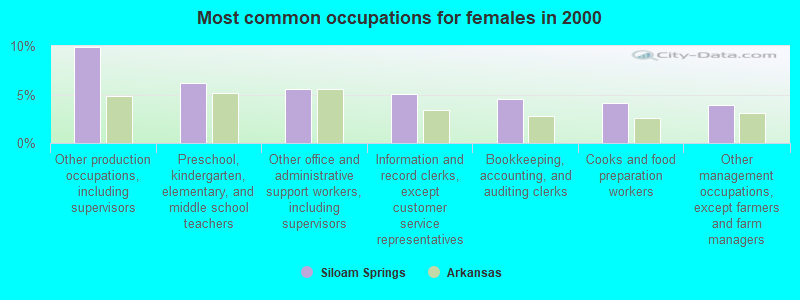


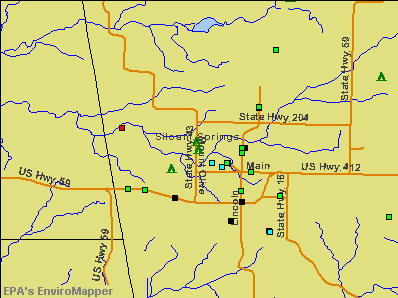

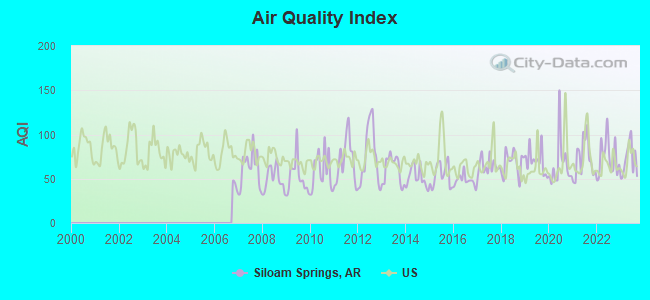
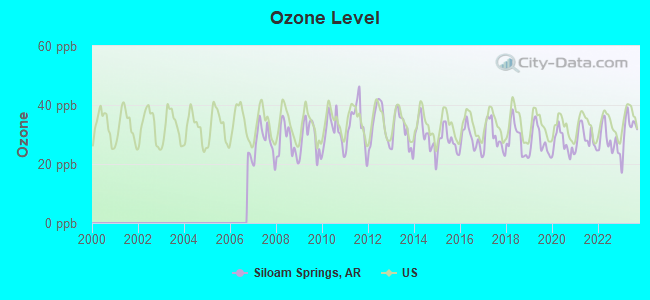
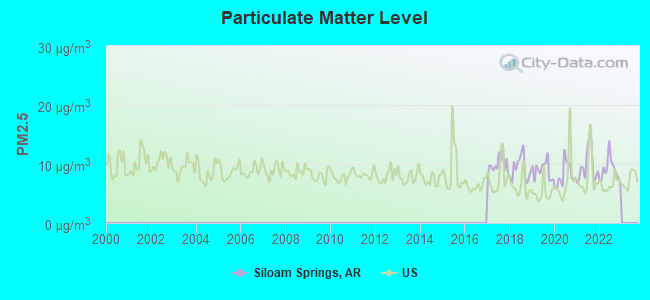

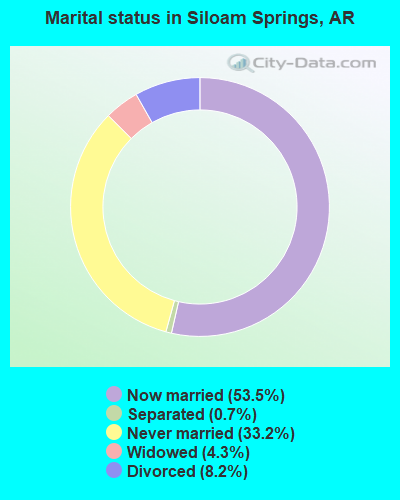
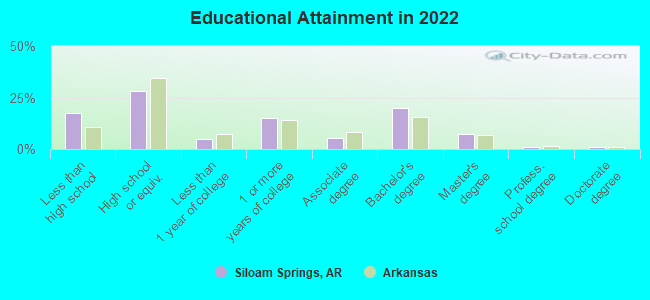
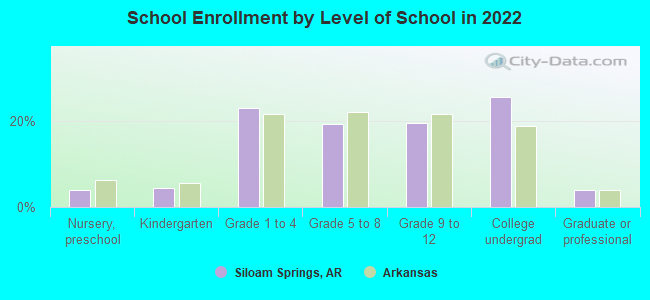
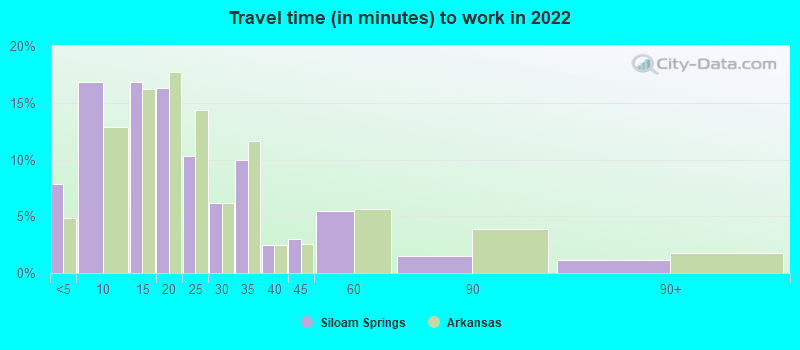
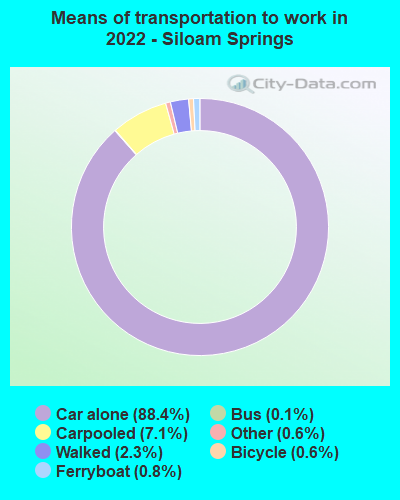
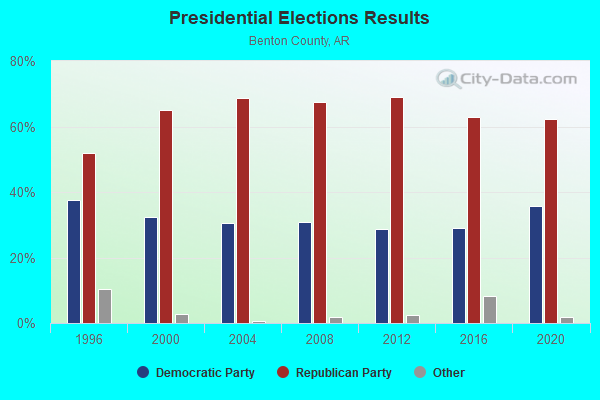
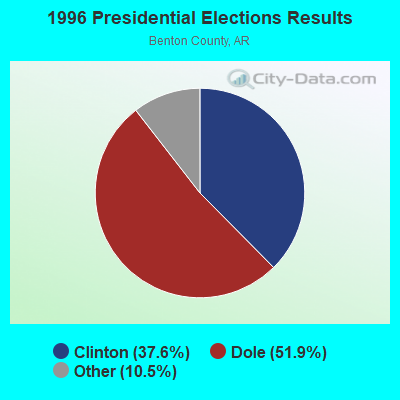
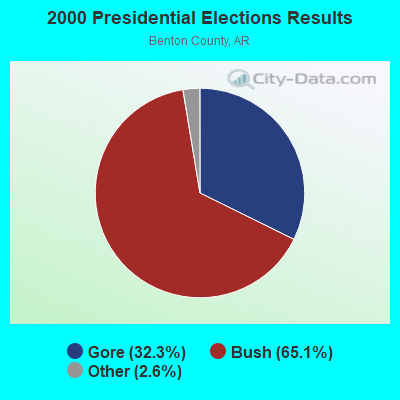
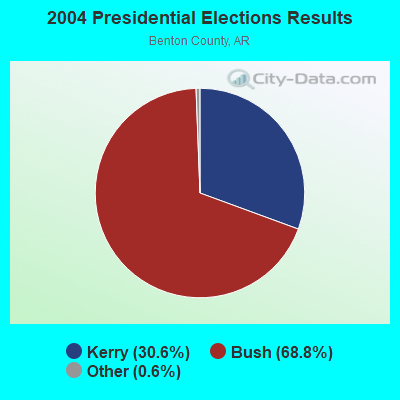


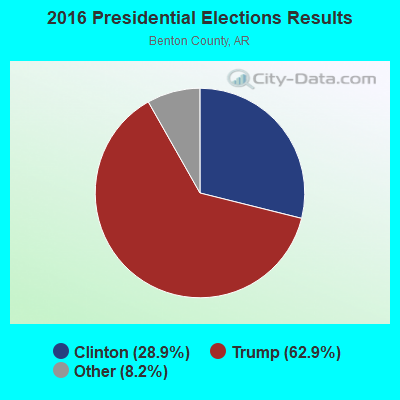
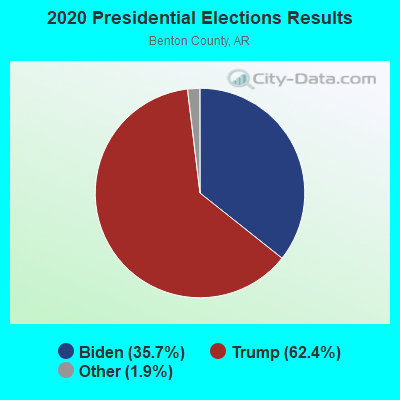
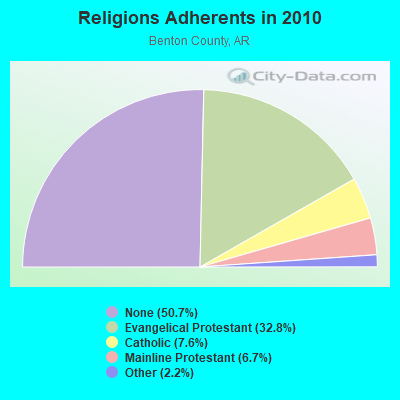
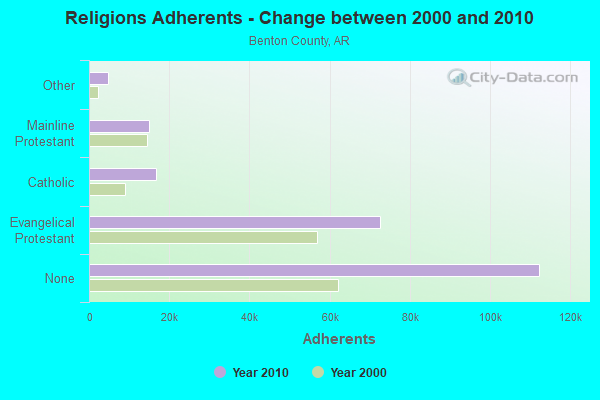
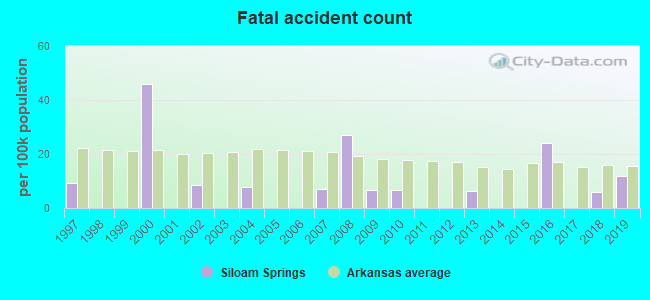
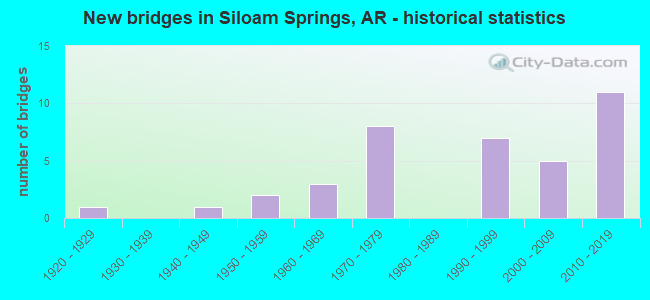
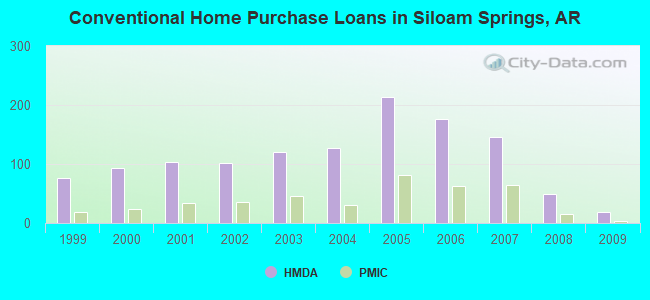
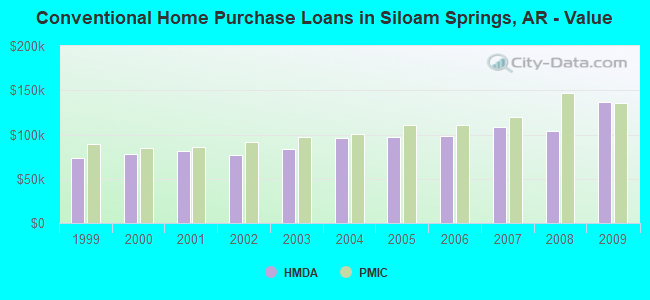
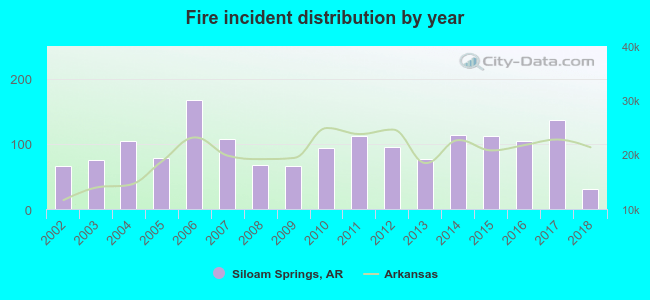 According to the data from the years 2002 - 2018 the average number of fire incidents per year is 95. The highest number of fires - 167 took place in 2006, and the least - 31 in 2018. The data has a dropping trend.
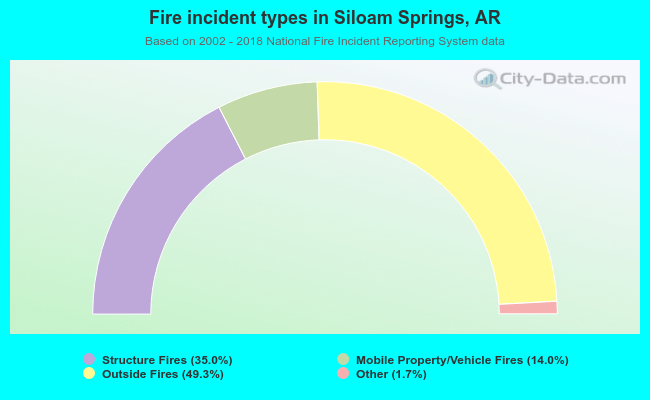 When looking into fire subcategories, the most incidents belonged to: Outside Fires (49.3%), and Structure Fires (35.0%).