Jasper, Alabama
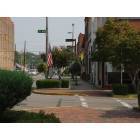
Jasper: Street in Jasper
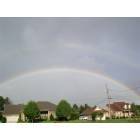
Jasper: Looking at the beautiful RAINBOW from hwy 195 and 5 intersection just before getting on "THE TRACE"
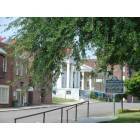
Jasper: Street in downtown Jasper
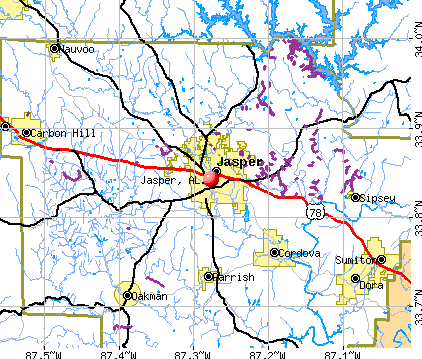
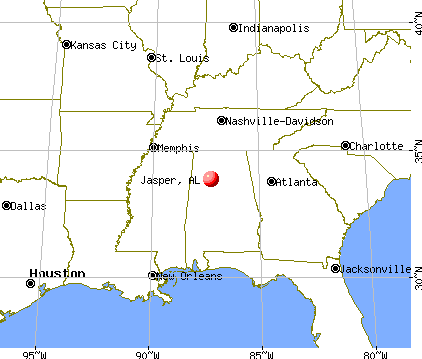
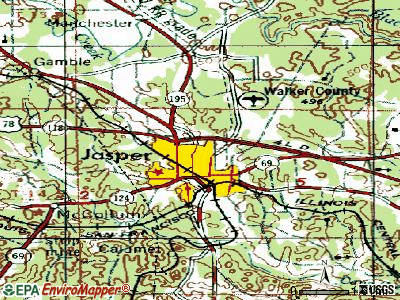
Jasper: Jasper is located in Walker County, Alabama
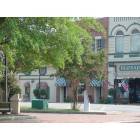
Jasper: From the square in downtown Jasper
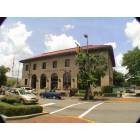
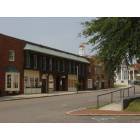
Jasper: Jasper City Hall
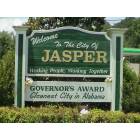
Jasper: Jasper - "Cleanest City in Alabama"
- add
your
Submit your own pictures of this city and show them to the world
- OSM Map
- General Map
- Google Map
- MSN Map
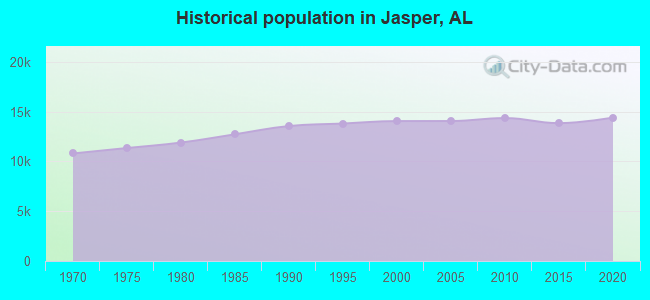
Population change since 2000: +2.0%
 |
| Males: 6,908 | |
| Females: 7,430 |
| Median resident age: | 35.7 years |
| Alabama median age: | 39.6 years |
Zip codes: 35501, 35503, 35504.
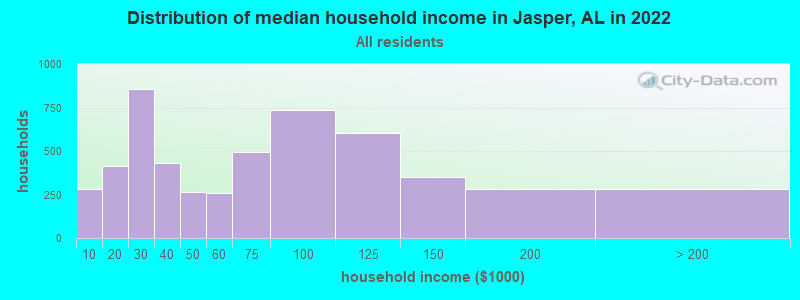
Jasper Zip Code Map| Jasper: | $62,919 |
| AL: | $59,674 |
Estimated per capita income in 2022: $31,126 (it was $19,491 in 2000)
Jasper city income, earnings, and wages data
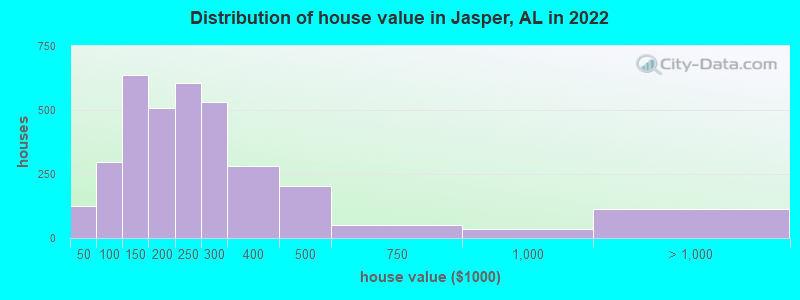
Estimated median house or condo value in 2022: $219,825 (it was $82,000 in 2000)
| Jasper: | $219,825 |
| AL: | $200,900 |
Median gross rent in 2022: $672.
(12.2% for White Non-Hispanic residents, 40.7% for Black residents, 5.4% for Hispanic or Latino residents, 10.6% for other race residents, 34.9% for two or more races residents)
Detailed information about poverty and poor residents in Jasper, AL


Compare current foreclosures in Jasper, AL:
| Photo | Address | Area | Beds / Baths | Price | Details |
|---|---|---|---|---|---|

|
#1
Rutledge Dr
Jasper, AL 35504
|
2,156 sq. feet
|
2 baths 3 beds |
$352,000
|
show details |

|
#2
Golf Course Rd
Jasper, AL 35504
|
2,088 sq. feet
|
2 baths 4 beds |
show details | |

|
#3
Northfield Dr
Jasper, AL 35504
|
1,721 sq. feet
|
3 baths 3 beds |
show details | |

|
#4
8th Ave
Jasper, AL 35501
|
1,340 sq. feet
|
1 baths 3 beds |
show details | |

|
#5
Rowland Pl
Jasper, AL 35504
|
1,643 sq. feet
|
1 baths 4 beds |
show details | |

|
#6
Calumet Rd
Jasper, AL 35501
|
1,296 sq. feet
|
1 baths 3 beds |
show details | |

|
#7
Woods Rd
Jasper, AL 35503
|
1,596 sq. feet
|
1 baths - beds |
show details | |

|
#8
Shephards Loop
Jasper, AL 35504
|
- sq. feet
|
- baths - beds |
show details | |

|
#9
Mountainside Cir Apt 204
Jasper, AL 35504
|
- sq. feet
|
- baths - beds |
show details | |

|
#10
Wedgewood Dr Apt F
Jasper, AL 35501
|
- sq. feet
|
- baths - beds |
show details |
| Photo | Address | Area | Beds / Baths | Price | Details |
|---|---|---|---|---|---|

|
#11
Summer Dr
Jasper, AL 35501
|
- sq. feet
|
- baths - beds |
show details | |

|
#12
Tommy Robinson Rd
Jasper, AL 35504
|
1,045 sq. feet
|
- baths - beds |
show details | |

|
#13
4th Ave S # 22
Jasper, AL 35501
|
- sq. feet
|
- baths - beds |
show details | |

|
#14
Ridgebrook Dr
Jasper, AL 35504
|
1,736 sq. feet
|
- baths - beds |
show details | |

|
#15
Johnsey Bridge Rd
Jasper, AL 35503
|
- sq. feet
|
- baths - beds |
show details | |

|
#16
Black Rd
Jasper, AL 35504
|
- sq. feet
|
- baths - beds |
show details | |

|
#17
High Forest Ct Apt 508
Jasper, AL 35501
|
- sq. feet
|
- baths - beds |
show details | |

|
#18
Euclid Ave Apt 2
Jasper, AL 35501
|
- sq. feet
|
- baths - beds |
show details | |

|
#19
Aaron Rd
Jasper, AL 35501
|
- sq. feet
|
- baths - beds |
show details | |

|
#20
Herman Rd
Jasper, AL 35503
|
- sq. feet
|
- baths - beds |
show details |
| Photo | Address | Area | Beds / Baths | Price | Details |
|---|---|---|---|---|---|

|
#21
Sunlight Rd
Jasper, AL 35504
|
656 sq. feet
|
- baths - beds |
show details | |

|
#22
Euclid Ave
Jasper, AL 35501
|
1,014 sq. feet
|
- baths - beds |
show details | |

|
#23
Highway 69
Jasper, AL 35501
|
700 sq. feet
|
- baths - beds |
show details | |

|
#24
Arkadelphia Rd
Jasper, AL 35504
|
1,368 sq. feet
|
- baths - beds |
show details | |

|
#25
Dogwood Trl
Jasper, AL 35504
|
- sq. feet
|
- baths - beds |
show details | |

|
#26
Otwell Rd
Jasper, AL 35504
|
- sq. feet
|
- baths - beds |
show details | |

|
#27
Tower View Rd
Jasper, AL 35504
|
- sq. feet
|
- baths - beds |
show details | |

|
#28
Saragossa Rd
Jasper, AL 35503
|
- sq. feet
|
- baths - beds |
show details | |

|
#29
Longbrook Cir
Jasper, AL 35501
|
1,756 sq. feet
|
- baths - beds |
show details | |

|
#30
Harrison Shipman Rd
Jasper, AL 35503
|
3,277 sq. feet
|
- baths - beds |
show details |
| Photo | Address | Area | Beds / Baths | Price | Details |
|---|---|---|---|---|---|

|
#31
Dempsey Rd
Jasper, AL 35503
|
- sq. feet
|
- baths - beds |
show details | |

|
#32
Johnsey Bridge Rd
Jasper, AL 35503
|
- sq. feet
|
- baths - beds |
show details | |

|
#33
Curry Hwy
Jasper, AL 35503
|
- sq. feet
|
- baths - beds |
show details | |

|
#34
Herman Rd
Jasper, AL 35503
|
- sq. feet
|
- baths - beds |
show details | |

|
#35
High Forest Ln Apt 305
Jasper, AL 35501
|
- sq. feet
|
- baths - beds |
show details | |

|
#36
Curry Hwy
Jasper, AL 35503
|
- sq. feet
|
- baths - beds |
show details | |

|
#37
Fall City Rd
Jasper, AL 35503
|
1,010 sq. feet
|
- baths - beds |
show details | |

|
#38
Shererwood Dr
Jasper, AL 35501
|
2,170 sq. feet
|
- baths - beds |
show details | |

|
#39
Highway 195
Jasper, AL 35503
|
1,455 sq. feet
|
- baths - beds |
show details | |

|
#40
Northwood Dr Apt A5
Jasper, AL 35504
|
- sq. feet
|
- baths - beds |
show details |
| Photo | Address | Area | Beds / Baths | Price | Details |
|---|---|---|---|---|---|

|
#41
Old Tuscaloosa Rd
Jasper, AL 35501
|
- sq. feet
|
- baths - beds |
show details | |

|
#42
Evans Rd
Jasper, AL 35501
|
- sq. feet
|
- baths - beds |
show details | |

|
#43
Gaines Rd
Jasper, AL 35503
|
- sq. feet
|
- baths - beds |
show details | |

|
#44
Smith Lake Dam Rd
Jasper, AL 35504
|
- sq. feet
|
- baths - beds |
show details | |

|
#45
Fall City Rd
Jasper, AL 35503
|
- sq. feet
|
- baths - beds |
show details | |

|
#46
Country Club Rd
Jasper, AL 35503
|
- sq. feet
|
- baths - beds |
show details | |

|
#47
Highway 195
Jasper, AL 35503
|
- sq. feet
|
- baths - beds |
show details | |

|
#48
Richlan Ct
Jasper, AL 35503
|
2,309 sq. feet
|
- baths - beds |
show details | |

|
#49
Arkadelphia Rd Lot 12
Jasper, AL 35504
|
- sq. feet
|
- baths - beds |
show details | |

|
Check over 1 million property listings on Foreclosure.com!
|
browse all offers | |||


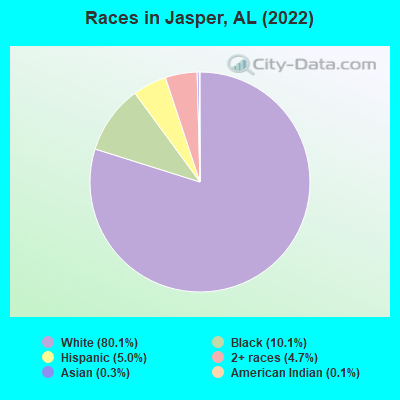
- 11,67980.1%White alone
- 1,47210.1%Black alone
- 7335.0%Hispanic
- 6804.7%Two or more races
- 480.3%Asian alone
- 210.1%American Indian alone
- 80.05%Other race alone
According to our research of Alabama and other state lists, there were 73 registered sex offenders living in Jasper, Alabama as of May 23, 2024.
The ratio of all residents to sex offenders in Jasper is 195 to 1.
Type |
2009 |
2010 |
2011 |
2012 |
2013 |
2014 |
2015 |
2016 |
2017 |
2018 |
2019 |
2020 |
2021 |
2022 |
|---|---|---|---|---|---|---|---|---|---|---|---|---|---|---|
| Murders (per 100,000) | 0 (0.0) | 0 (0.0) | 1 (6.9) | 0 (0.0) | 1 (7.0) | 1 (7.1) | 0 (0.0) | 0 (0.0) | 1 (7.2) | 0 (0.0) | 0 (0.0) | 1 (7.5) | 0 (0.0) | 1 (7.0) |
| Rapes (per 100,000) | 11 (77.9) | 7 (48.8) | 8 (55.5) | 8 (55.7) | 7 (49.3) | 14 (98.7) | 16 (113.9) | 4 (28.6) | 7 (50.2) | 7 (51.8) | 6 (44.8) | 2 (15.0) | 8 (60.7) | 8 (55.9) |
| Robberies (per 100,000) | 26 (184.0) | 13 (90.6) | 26 (180.3) | 40 (278.5) | 26 (183.3) | 18 (126.9) | 26 (185.2) | 18 (128.5) | 27 (193.7) | 8 (59.2) | 12 (89.6) | 10 (75.0) | 5 (37.9) | 2 (14.0) |
| Assaults (per 100,000) | 32 (226.5) | 52 (362.3) | 60 (416.1) | 75 (522.1) | 79 (556.9) | 82 (578.2) | 188 (1,339) | 138 (985.1) | 71 (509.3) | 59 (436.6) | 38 (283.7) | 35 (262.6) | 55 (417.4) | 49 (342.4) |
| Burglaries (per 100,000) | 181 (1,281) | 17 (118.5) | 206 (1,428) | 242 (1,685) | 199 (1,403) | 135 (951.9) | 126 (897.3) | 120 (856.6) | 149 (1,069) | 125 (925.1) | 67 (500.3) | 63 (472.7) | 127 (963.8) | 174 (1,216) |
| Thefts (per 100,000) | 1,147 (8,118) | 920 (6,410) | 755 (5,235) | 855 (5,952) | 743 (5,238) | 926 (6,529) | 829 (5,904) | 694 (4,954) | 714 (5,122) | 822 (6,083) | 410 (3,061) | 328 (2,461) | 368 (2,793) | 443 (3,095) |
| Auto thefts (per 100,000) | 72 (509.6) | 79 (550.4) | 58 (402.2) | 44 (306.3) | 39 (274.9) | 55 (387.8) | 51 (363.2) | 81 (578.2) | 56 (401.7) | 88 (651.3) | 40 (298.7) | 36 (270.1) | 49 (371.9) | 60 (419.2) |
| Arson (per 100,000) | 1 (7.1) | 1 (7.0) | 7 (48.5) | 6 (41.8) | 2 (14.1) | 6 (42.3) | 8 (57.0) | 5 (35.7) | 4 (28.7) | 2 (14.8) | 0 (0.0) | 0 (0.0) | 1 (7.6) | 2 (14.0) |
| City-Data.com crime index | 617.9 | 447.4 | 537.1 | 613.0 | 549.7 | 605.6 | 742.5 | 562.8 | 526.3 | 506.7 | 300.8 | 255.2 | 352.4 | 373.8 |
The City-Data.com crime index weighs serious crimes and violent crimes more heavily. Higher means more crime, U.S. average is 246.1. It adjusts for the number of visitors and daily workers commuting into cities.
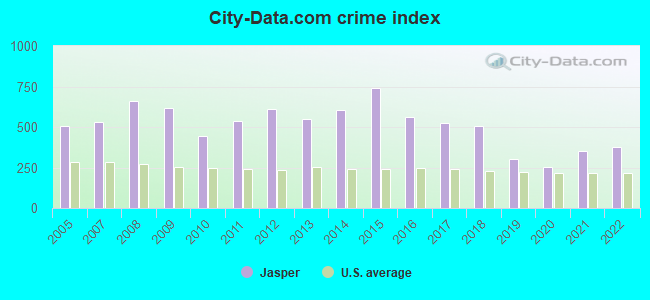
Crime rate in Jasper detailed stats: murders, rapes, robberies, assaults, burglaries, thefts, arson
Full-time law enforcement employees in 2021, including police officers: 23 (3 officers - 0 male; 3 female).
| Officers per 1,000 residents here: | 0.23 |
| Alabama average: | 2.40 |
 Recent articles from our blog. Our writers, many of them Ph.D. graduates or candidates, create easy-to-read articles on a wide variety of topics.

 | Discussion Thread (133 replies) |
| How to find an office space to rent in Jasper or Cullman? (4 replies) |
| How would you solve the rural poverty? (193 replies) |
| I-422 northern beltline.... (143 replies) |
| Cool News (2568 replies) |
| What Cities/Metro will explode in the next decade? (149 replies) |
Latest news from Jasper, AL collected exclusively by city-data.com from local newspapers, TV, and radio stations
Ancestries: American (29.5%), English (12.8%), Irish (9.9%), German (8.2%), Scotch-Irish (1.8%), Scottish (1.8%).
Current Local Time: CST time zone
Incorporated in 1888
Elevation: 325 feet
Land area: 26.9 square miles.
Population density: 534 people per square mile (low).
283 residents are foreign born
| This city: | 1.9% |
| Alabama: | 3.5% |
Median real estate property taxes paid for housing units with mortgages in 2022: $602 (0.3%)
Median real estate property taxes paid for housing units with no mortgage in 2022: $681 (0.3%)
Nearest city with pop. 50,000+: Birmingham, AL  (34.6 miles , pop. 242,820).
Nearest city with pop. 1,000,000+: Houston, TX (553.5 miles , pop. 1,953,631).
Nearest cities:
), ), ), ), ), ), Latitude: 33.84 N, Longitude: 87.28 W
Daytime population change due to commuting: +5,334 (+36.6%)
Workers who live and work in this city: 3,396 (57.2%)
Area code: 205

Jasper tourist attractions:
Jasper, Alabama accommodation & food services, waste management - Economy and Business Data
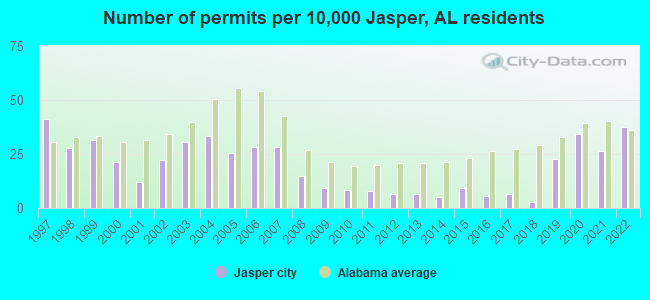
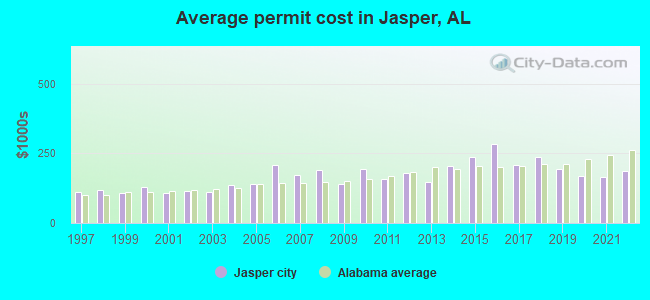
Single-family new house construction building permits:
- 2022: 53 buildings, average cost: $188,200
- 2021: 37 buildings, average cost: $163,800
- 2020: 48 buildings, average cost: $168,600
- 2019: 32 buildings, average cost: $195,200
- 2018: 4 buildings, average cost: $236,400
- 2017: 9 buildings, average cost: $207,800
- 2016: 8 buildings, average cost: $282,500
- 2015: 13 buildings, average cost: $237,700
- 2014: 7 buildings, average cost: $204,400
- 2013: 9 buildings, average cost: $146,500
- 2012: 9 buildings, average cost: $179,500
- 2011: 11 buildings, average cost: $156,300
- 2010: 12 buildings, average cost: $194,400
- 2009: 13 buildings, average cost: $139,600
- 2008: 21 buildings, average cost: $189,000
- 2007: 40 buildings, average cost: $172,000
- 2006: 40 buildings, average cost: $208,500
- 2005: 36 buildings, average cost: $141,100
- 2004: 47 buildings, average cost: $135,600
- 2003: 43 buildings, average cost: $109,900
- 2002: 31 buildings, average cost: $115,700
- 2001: 17 buildings, average cost: $105,700
- 2000: 30 buildings, average cost: $127,900
- 1999: 44 buildings, average cost: $107,800
- 1998: 39 buildings, average cost: $119,700
- 1997: 58 buildings, average cost: $110,400
| Here: | 2.7% |
| Alabama: | 2.6% |
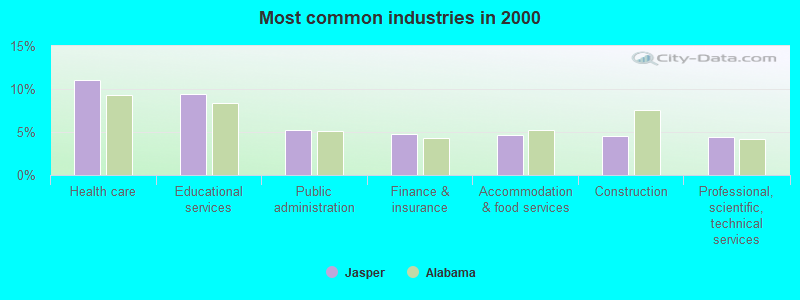
- Health care (11.0%)
- Educational services (9.5%)
- Public administration (5.2%)
- Finance & insurance (4.8%)
- Accommodation & food services (4.7%)
- Construction (4.6%)
- Professional, scientific, technical services (4.4%)
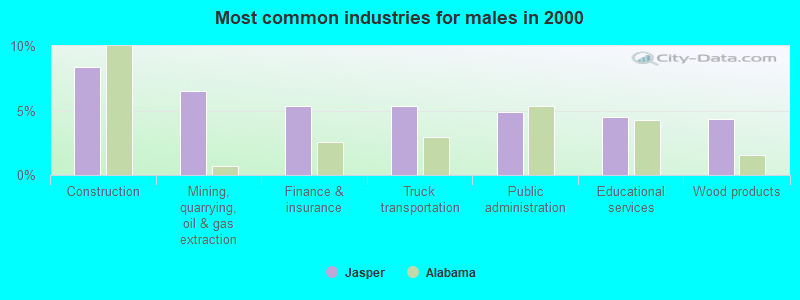
- Construction (8.3%)
- Mining, quarrying, oil & gas extraction (6.5%)
- Finance & insurance (5.4%)
- Truck transportation (5.3%)
- Public administration (4.9%)
- Educational services (4.5%)
- Wood products (4.4%)
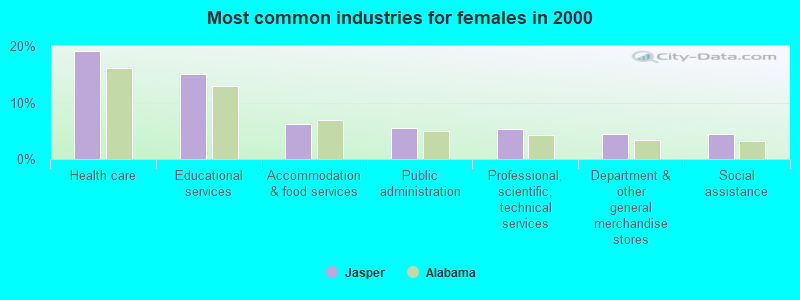
- Health care (19.1%)
- Educational services (15.0%)
- Accommodation & food services (6.2%)
- Public administration (5.5%)
- Professional, scientific, technical services (5.4%)
- Department & other general merchandise stores (4.4%)
- Social assistance (4.4%)
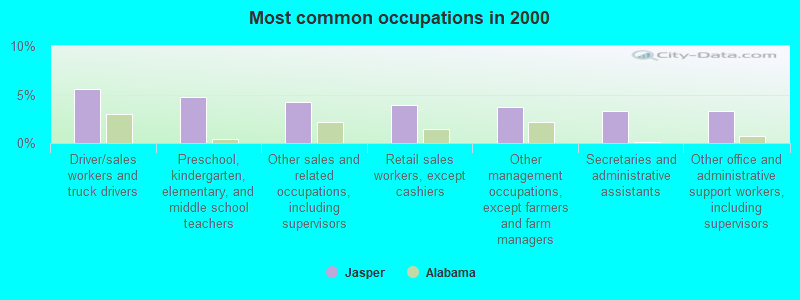
- Driver/sales workers and truck drivers (5.5%)
- Preschool, kindergarten, elementary, and middle school teachers (4.8%)
- Other sales and related occupations, including supervisors (4.2%)
- Retail sales workers, except cashiers (3.9%)
- Other management occupations, except farmers and farm managers (3.7%)
- Secretaries and administrative assistants (3.3%)
- Other office and administrative support workers, including supervisors (3.3%)
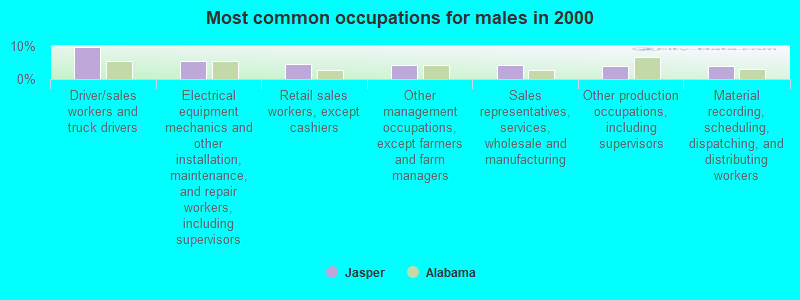
- Driver/sales workers and truck drivers (9.7%)
- Electrical equipment mechanics and other installation, maintenance, and repair workers, including supervisors (5.5%)
- Retail sales workers, except cashiers (4.5%)
- Other management occupations, except farmers and farm managers (4.3%)
- Sales representatives, services, wholesale and manufacturing (4.2%)
- Other production occupations, including supervisors (3.9%)
- Material recording, scheduling, dispatching, and distributing workers (3.8%)
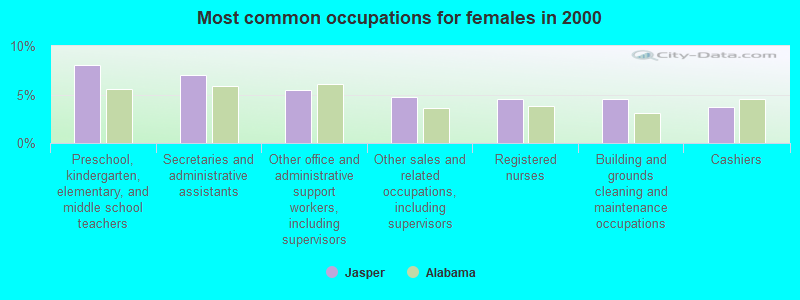
- Preschool, kindergarten, elementary, and middle school teachers (8.1%)
- Secretaries and administrative assistants (7.0%)
- Other office and administrative support workers, including supervisors (5.5%)
- Other sales and related occupations, including supervisors (4.7%)
- Registered nurses (4.6%)
- Building and grounds cleaning and maintenance occupations (4.6%)
- Cashiers (3.7%)
Average climate in Jasper, Alabama
Based on data reported by over 4,000 weather stations


|
|


(lower is better)
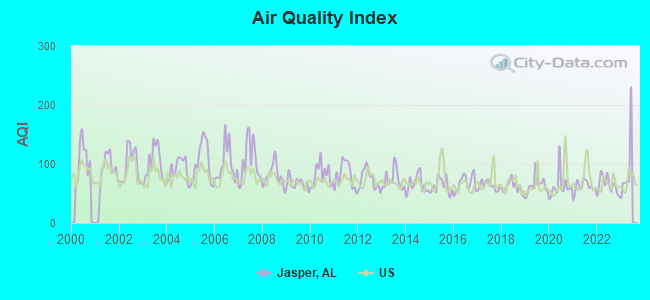
Air Quality Index (AQI) level in 2022 was 64.4. This is about average.
| City: | 64.4 |
| U.S.: | 72.6 |
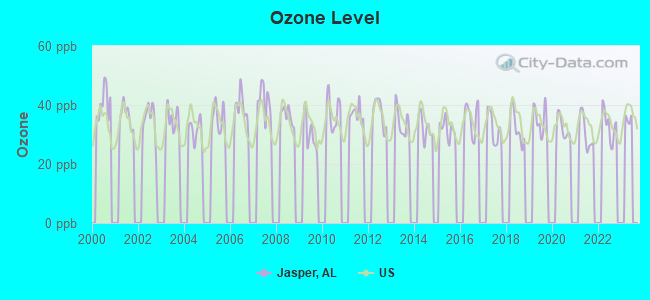
Ozone [ppb] level in 2022 was 33.3. This is about average. Closest monitor was 19.4 miles away from the city center.
| City: | 33.3 |
| U.S.: | 33.3 |
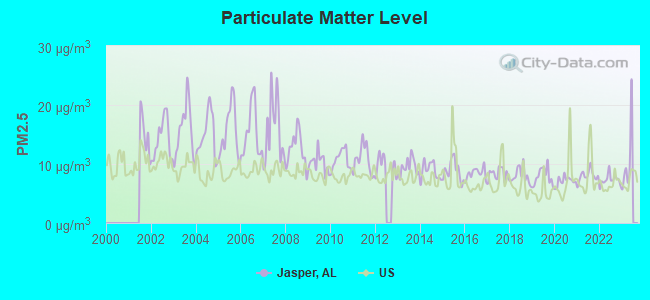
Particulate Matter (PM2.5) [µg/m3] level in 2022 was 7.31. This is about average. Closest monitor was 0.7 miles away from the city center.
| City: | 7.31 |
| U.S.: | 8.11 |
Tornado activity:
Jasper-area historical tornado activity is slightly above Alabama state average. It is 163% greater than the overall U.S. average.
On 11/17/1957, a category F4 (max. wind speeds 207-260 mph) tornado 6.2 miles away from the Jasper city center killed 4 people and injured 15 people and caused between $5000 and $50,000 in damages.
On 4/8/1998, a category F5 (max. wind speeds 261-318 mph) tornado 29.5 miles away from the city center killed 32 people and injured 259 people and caused $200 million in damages.
Earthquake activity:
Jasper-area historical earthquake activity is significantly above Alabama state average. It is 162% greater than the overall U.S. average.On 1/18/1999 at 07:00:53, a magnitude 4.8 (4.8 MB, 4.0 LG, Depth: 0.6 mi, Class: Light, Intensity: IV - V) earthquake occurred 30.3 miles away from Jasper center
On 4/29/2003 at 08:59:39, a magnitude 4.9 (4.4 MB, 4.6 MW, 4.9 LG) earthquake occurred 104.5 miles away from Jasper center
On 6/24/1975 at 11:11:36, a magnitude 4.5 (4.5 MB) earthquake occurred 33.5 miles away from the city center
On 4/29/2003 at 08:59:39, a magnitude 4.6 (4.6 MW, Depth: 12.3 mi) earthquake occurred 104.5 miles away from the city center
On 10/24/1997 at 08:35:17, a magnitude 4.9 (4.8 MB, 4.2 MS, 4.9 LG, Depth: 6.2 mi) earthquake occurred 188.1 miles away from the city center
On 3/25/1976 at 00:41:20, a magnitude 5.0 (4.9 MB, 5.0 LG, Class: Moderate, Intensity: VI - VII) earthquake occurred 213.2 miles away from the city center
Magnitude types: regional Lg-wave magnitude (LG), body-wave magnitude (MB), surface-wave magnitude (MS), moment magnitude (MW)
Natural disasters:
The number of natural disasters in Walker County (21) is greater than the US average (15).Major Disasters (Presidential) Declared: 13
Emergencies Declared: 5
Causes of natural disasters: Storms: 12, Tornadoes: 10, Floods: 9, Winds: 5, Hurricanes: 3, Drought: 1, Fire: 1, Snowfall: 1, Winter Storm: 1, Other: 1 (Note: some incidents may be assigned to more than one category).
Hospitals in Jasper:
- KINDRED CARE HOSPICE - JASPER (1301 HIGHWAY 78E, SUITE #209)
- NEW BEACON OF JASPER (302 BLACKWELL DIARY ROAD)
- SOUTHEAST HOSPICE NETWORK, LLC (4330 EAST HIGHWAY 78 EAST, SUITE 212)
- SOUTHERNCARE JASPER (4330 HWY 78 EAST SUITE 210 AND 211)
- WALKER BAPTIST MEDICAL CENTER (Voluntary non-profit - Private, 3400 HIGHWAY 78 EAST)
Nursing Homes in Jasper:
- RIDGEVIEW HEALTH SERVICES, INC (907 11TH STREET, NE)
- RIDGEWOOD HEALTH CARE CENTER (201 OAKHILL ROAD)
- SHADESCREST HEALTH CARE CENTER (331 WEST 25TH STREET)
Dialysis Facilities in Jasper:
Home Health Centers in Jasper:
Airports and heliports located in Jasper:
- Walker County-Bevill Field Airport (JFX) (Runways: 1, Itinerant Ops: 28,703, Local Ops: 4,813, Military Ops: 100)
- Walker Regional Medical Center Heliport (AL63)
College/University in Jasper:
Other colleges/universities with over 2000 students near Jasper:
- George C Wallace State Community College-Hanceville (about 33 miles; Hanceville, AL; Full-time enrollment: 4,486)
- Lawson State Community College-Birmingham Campus (about 36 miles; Birmingham, AL; FT enrollment: 2,695)
- Jefferson State Community College (about 36 miles; Birmingham, AL; FT enrollment: 6,041)
- University of Alabama at Birmingham (about 36 miles; Birmingham, AL; FT enrollment: 14,853)
- Virginia College-Birmingham (about 37 miles; Birmingham, AL; FT enrollment: 8,167)
- Samford University (about 39 miles; Birmingham, AL; FT enrollment: 3,829)
- The University of Alabama (about 47 miles; Tuscaloosa, AL; FT enrollment: 30,931)
Public high schools in Jasper:
- WALKER HIGH SCH (Students: 791, Location: 1601 HIGHLAND AVE, Grades: 9-12)
- NORTH HIGHLAND SCH (Students: 24, Location: 907 12TH AVE SW, Grades: PK-12)
- WALKER CO ALT SCH (Location: 1100 VIKING DRIVE, Grades: KG-12)
- WALKER CO CTR OF TECH (Location: 1100 VIKING DRIVE, Grades: 10-12)
- CURRY HIGH SCH (Location: 155 YELLOW JACKET DR, Grades: 9-12)
Private high schools in Jasper:
Public elementary/middle schools in Jasper:
- CURRY ELEM SCH (Students: 666, Location: 85 YELLOW JACKET DR, Grades: PK-5)
- VALLEY JR HIGH SCH (Students: 598, Location: 155 VALLEY SCHOOL RD, Grades: KG-8)
- MADDOX MIDDLE SCH (Students: 581, Location: 201 PANTHER TRAIL, Grades: 6-8)
- MEMORIAL PK ELEM SCH (Students: 507, Location: 800 10TH AVE, Grades: KG-5)
- T R SIMMONS ELEM SCH (Students: 503, Location: 1001 VIKING DR, Grades: PK-5)
- CURRY MIDDLE SCH (Students: 442, Location: 115 YELLOW JACKET DR, Grades: 6-8)
- WEST JASPER ELEM SCH (Students: 269, Location: 1400 W 19TH ST, Grades: PK-5)
Libraries in Jasper:
- CARL ELLIOTT REGIONAL LIBRARY SYSTEM (Operating income: $240,261; Location: 98 18TH STREET EAST; 3,926 books; 81 state licensed databases)
- JASPER PUBLIC LIBRARY (Operating income: $199,033; Location: 98 EAST 18TH STREET; 49,405 books; 895 audio materials; 910 video materials; 81 state licensed databases)
User-submitted facts and corrections:
- Bevill State Community College has a campus located in Jasper AL. The former Walker College/UAB Walker College.
- WTID AM1240 has changed call sign. New Calls are WLYJ. WTID no longer exists in Jasper, AL. WLYJ is at AM1240. WLYJ is owned by Joy Christian Communications. WLYJ is known locally as Joy Christian Radio.
Points of interest:
Notable locations in Jasper: Musgrove Country Club (A), Jasper Speedway (B), Jasper Fire Department Station 1 (C), Jasper Fire Department Station 3 (D), Jasper Fire Department Station 2 (E). Display/hide their locations on the map
Shopping Centers: Jasper Mall Shopping Center (1), Jasper Square Shopping Center (2), Parklands North Shopping Center (3), Parklands Shopping Center (4), English Village Shopping Center (5). Display/hide their locations on the map
Churches in Jasper include: New Prospect Baptist Church (A), Wesley Church (B), Farmstead Baptist Church (C), Shiloh Baptist Church (D), Saint Marys Episcopal Church (E), Saint James Christian Methodist Episcopal Church (F), Northside Baptist Church (G), First Baptist Church (H), Coal City Baptist Church (I). Display/hide their locations on the map
Cemeteries: Oak Hill Cemetery (1), Samaria Cemetery (2), Old City Cemetery (3), New Prospect Cemetery (4), Walker Memory Gardens (5). Display/hide their locations on the map
Streams, rivers, and creeks: Tanyard Creek (A), Mooney Branch (B), Doctors Branch (C), Coke Oven Branch (D). Display/hide their locations on the map
Parks in Jasper include: Carver Park (1), James Fowler Park (2), Memorial Park (3), Valley Park (4). Display/hide their locations on the map
Tourist attraction: Laserland Birthday Palace (Amusement & Theme Parks; 24848 Highway 69) (1). Display/hide its approximate location on the map
Hotels: Super 8 (1287 Highway 78 West) (1), Holiday Inn Express Hotel & Suites (202 Oakhill Road) (2), Budget Inns (1301 Highway 78 West) (3), Jameson Inn of Jasper (1100 Highway 78 West) (4), Jasper-Days Inn (101 6th Ave NW) (5), Travel Rite Inn (200 Mall Way) (6), Super 8 Motel (1287 Highway 78 West) (7), Jameson Inn Jasper (Sj) (1100 Highway 78 E) (8), Jasper Inn (Po Box 1648) (9). Display/hide their approximate locations on the map
Courts: Courts-County - Circuit Court (Court House) (1), Walker County - Juvenile Court (Court House Annex) (2), Alabama State - District Attorney- Pre-Trial Intervention Program (4100 Highway 78 East) (3), Walker County - Probate Judge- Probate Court (Court House) (4), Courts-County - Probate Court (Court House) (5), Court Services (Courthouse Annex) (6). Display/hide their approximate locations on the map
Birthplace of: Jason Aaron - Comic book writer, Sandy Posey - Country singer, Eric Dover - Guitarist, Michael Rooker - Film actor, Polly Holliday - Actress, Greg Reed - Politician, James Shepherd Freeman - Admiral, Ronnie Coleman (American football) - Football player, Terry Owens - Football player.
Drinking water stations with addresses in Jasper and their reported violations in the past:
CURRY WATER AUTHORITY (Population served: 17,160, Purch surface water):Past health violations:
- MCL, Average - Between OCT-2008 and DEC-2008, Contaminant: TTHM. Follow-up actions: St Public Notif requested (JAN-21-2009), St Violation/Reminder Notice (JAN-21-2009), St Public Notif received (FEB-23-2009), St Compliance achieved (NOV-01-2009)
- MCL, Average - Between JUL-2008 and SEP-2008, Contaminant: TTHM. Follow-up actions: St Public Notif requested (OCT-15-2008), St Violation/Reminder Notice (OCT-15-2008), St Public Notif received (NOV-18-2008), St Compliance achieved (NOV-01-2009)
Drinking water stations with addresses in Jasper that have no violations reported:
| This city: | 2.4 people |
| Alabama: | 2.5 people |
| This city: | 66.5% |
| Whole state: | 67.8% |
| This city: | 4.4% |
| Whole state: | 4.7% |
Likely homosexual households (counted as self-reported same-sex unmarried-partner households)
- Lesbian couples: 0.2% of all households
- Gay men: 0.2% of all households
People in group quarters in Jasper in 2010:
- 285 people in local jails and other municipal confinement facilities
- 255 people in nursing facilities/skilled-nursing facilities
- 42 people in college/university student housing
- 22 people in correctional residential facilities
- 16 people in group homes intended for adults
- 16 people in other noninstitutional facilities
- 10 people in residential treatment centers for juveniles (non-correctional)
- 2 people in workers' group living quarters and job corps centers
People in group quarters in Jasper in 2000:
- 378 people in nursing homes
- 263 people in local jails and other confinement facilities (including police lockups)
- 36 people in college dormitories (includes college quarters off campus)
- 18 people in hospitals or wards for drug/alcohol abuse
- 10 people in other noninstitutional group quarters
Banks with branches in Jasper (2011 data):
- Synovus Bank: Medical Center Branch, North Highlands Branch, Jasper Branch, Curry Branch. Info updated 2011/01/25: Bank assets: $26,863.3 mil, Deposits: $22,415.0 mil, headquarters in Columbus, GA, positive income, Commercial Lending Specialization, 296 total offices, Holding Company: Synovus Financial Corp.
- Regions Bank: Highway 78 Bypass Branch at 310 Highway 78 Bypass, branch established on 1987/04/20; Jasper Rdt Branch at 1908 First Avenue W, branch established on 2004/06/30. Info updated 2011/02/24: Bank assets: $123,368.2 mil, Deposits: $98,301.3 mil, headquarters in Birmingham, AL, positive income, Commercial Lending Specialization, 1778 total offices, Holding Company: Regions Financial Corporation
- Pinnacle Bank: 78 Highway East Branch at U.S. Highway 78 East & Mallway, branch established on 1935/11/01; at 1811 Second Avenue, branch established on 1935/11/01. Info updated 2011/02/24: Bank assets: $199.1 mil, Deposits: $172.4 mil, local headquarters, positive income, Commercial Lending Specialization, 7 total offices, Holding Company: Pinnacle Bancshares, Inc.
- Branch Banking and Trust Company: Jasper Branch at 3901 Highway 78 East, branch established on 1971/02/08; Jasper Downtown Branch at 2002 2nd Ave S, branch established on 1905/01/01. Info updated 2010/03/29: Bank assets: $168,867.6 mil, Deposits: $127,549.5 mil, headquarters in Winston Salem, NC, positive income, Commercial Lending Specialization, 1793 total offices, Holding Company: Bb&T Corporation
- Wells Fargo Bank, National Association: Highway 78 Branch at 2721 Hwy 78 East, branch established on 1986/08/04. Info updated 2011/04/05: Bank assets: $1,161,490.0 mil, Deposits: $905,653.0 mil, headquarters in Sioux Falls, SD, positive income, 6395 total offices, Holding Company: Wells Fargo & Company
- Compass Bank: Jasper Main Branch at 1713 Alabama Avenue, branch established on 1963/11/29. Info updated 2011/02/24: Bank assets: $63,107.0 mil, Deposits: $46,232.4 mil, headquarters in Birmingham, AL, negative income in the last year, Commercial Lending Specialization, 720 total offices, Holding Company: Banco Bilbao Vizcaya Argentaria, S.A.
- Security Federal Savings Bank: at 301 Third Avenue, branch established on 1970/01/01. Info updated 2011/07/21: Bank assets: $34.1 mil, Deposits: $29.3 mil, local headquarters, positive income, 1 total offices
- Bank of Walker County: Bank Of Walker County at 607 Hwy 78 East, branch established on 2004/03/29. Info updated 2011/02/24: Bank assets: $77.0 mil, Deposits: $67.2 mil, local headquarters, positive income, Commercial Lending Specialization, 1 total offices, Holding Company: Relations Bancshares, Inc.
For population 15 years and over in Jasper:
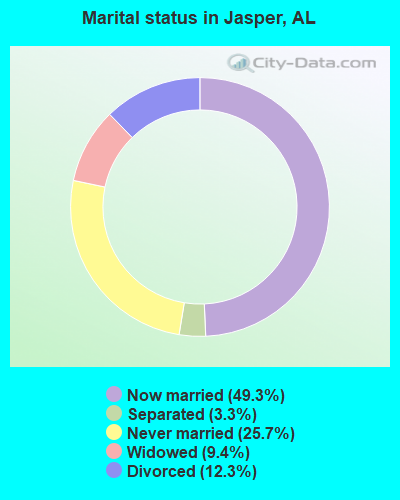
- Never married: 25.7%
- Now married: 49.3%
- Separated: 3.3%
- Widowed: 9.4%
- Divorced: 12.3%
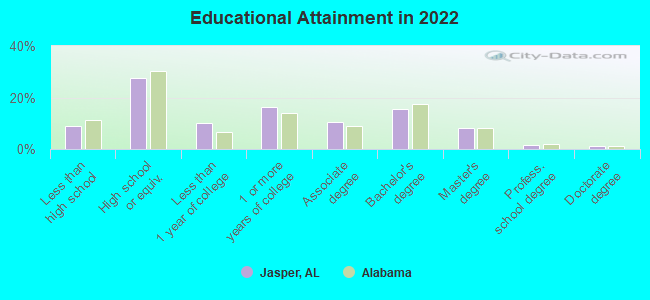
For population 25 years and over in Jasper:
- High school or higher: 89.8%
- Bachelor's degree or higher: 24.8%
- Graduate or professional degree: 9.9%
- Unemployed: 4.7%
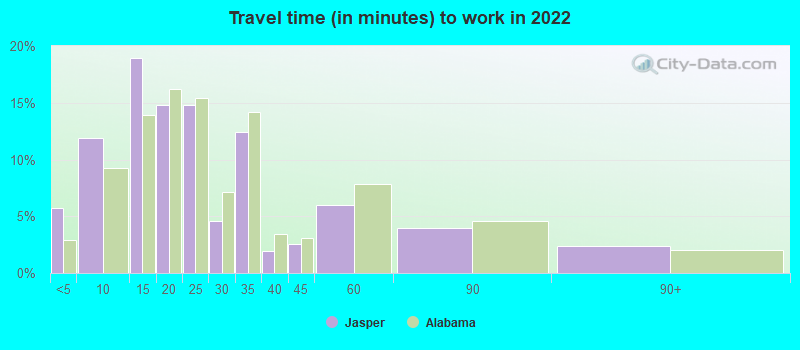
- Mean travel time to work (commute): 25.3 minutes
| Here: | 10.6 |
| Alabama average: | 11.5 |
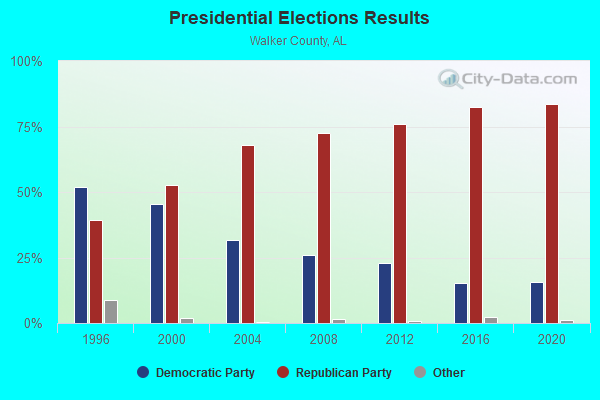
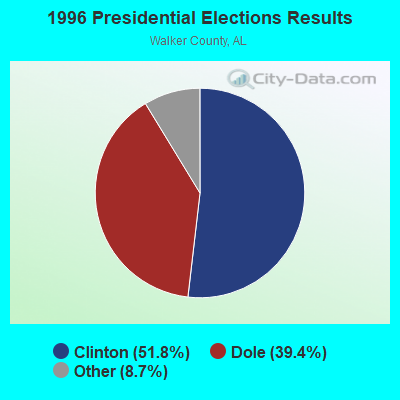
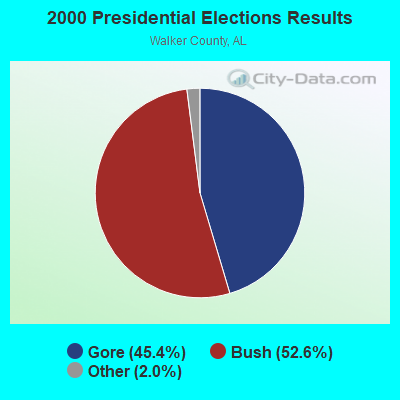
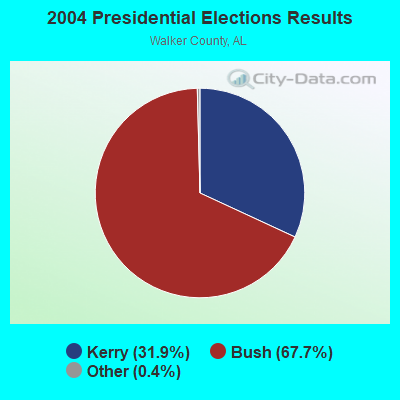

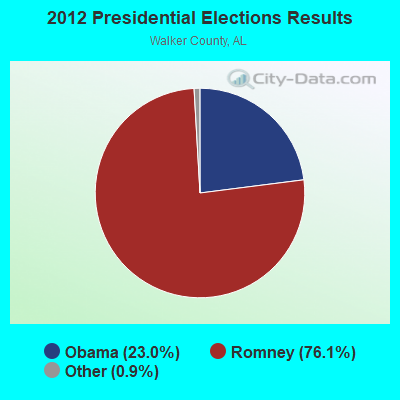
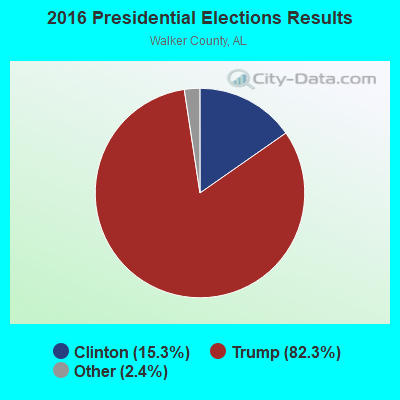

Graphs represent county-level data. Detailed 2008 Election Results
Religion statistics for Jasper, AL (based on Walker County data)
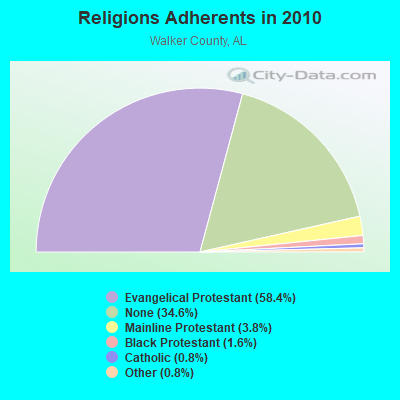
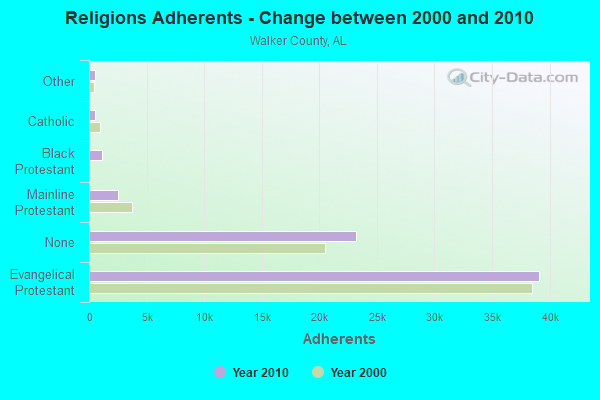
| Religion | Adherents | Congregations |
|---|---|---|
| Evangelical Protestant | 39,118 | 180 |
| Mainline Protestant | 2,552 | 25 |
| Black Protestant | 1,087 | 8 |
| Catholic | 523 | 1 |
| Other | 520 | 3 |
| None | 23,223 | - |
Food Environment Statistics:
| Walker County: | 2.48 / 10,000 pop. |
| Alabama: | 1.89 / 10,000 pop. |
| Walker County: | 0.29 / 10,000 pop. |
| Alabama: | 0.20 / 10,000 pop. |
| Walker County: | 0.44 / 10,000 pop. |
| Alabama: | 0.65 / 10,000 pop. |
| Walker County: | 6.41 / 10,000 pop. |
| Alabama: | 6.32 / 10,000 pop. |
| Walker County: | 5.39 / 10,000 pop. |
| Alabama: | 5.75 / 10,000 pop. |
| This county: | 11.9% |
| Alabama: | 11.8% |
| This county: | 32.4% |
| Alabama: | 31.7% |
| This county: | 16.5% |
| Alabama: | 13.5% |
Health and Nutrition:
| This city: | 49.0% |
| State: | 49.0% |
| This city: | 44.5% |
| Alabama: | 45.7% |
| This city: | 28.8 |
| Alabama: | 28.9 |
| This city: | 22.8% |
| Alabama: | 20.7% |
| Jasper: | 11.7% |
| Alabama: | 11.0% |
| This city: | 6.9 |
| State: | 6.8 |
| Jasper: | 33.9% |
| State: | 34.4% |
| Jasper: | 53.8% |
| Alabama: | 55.2% |
| Here: | 76.7% |
| State: | 79.3% |
More about Health and Nutrition of Jasper, AL Residents
| Local government employment and payroll (March 2022) | |||||
| Function | Full-time employees | Monthly full-time payroll | Average yearly full-time wage | Part-time employees | Monthly part-time payroll |
|---|---|---|---|---|---|
| Police Protection - Officers | 49 | $181,512 | $44,452 | 2 | $1,858 |
| Water Supply | 29 | $144,513 | $59,798 | 0 | $0 |
| Firefighters | 25 | $135,548 | $65,063 | 0 | $0 |
| Streets and Highways | 22 | $78,536 | $42,838 | 0 | $0 |
| Solid Waste Management | 18 | $41,584 | $27,723 | 3 | $2,911 |
| Financial Administration | 14 | $39,778 | $34,095 | 0 | $0 |
| Sewerage | 14 | $71,289 | $61,105 | 0 | $0 |
| Parks and Recreation | 11 | $40,693 | $44,392 | 18 | $7,283 |
| Correction | 9 | $26,802 | $35,736 | 0 | $0 |
| Other and Unallocable | 9 | $47,643 | $63,524 | 0 | $0 |
| Judicial and Legal | 4 | $15,585 | $46,755 | 0 | $0 |
| Police - Other | 4 | $10,585 | $31,755 | 0 | $0 |
| Local Libraries | 1 | $2,729 | $32,748 | 6 | $5,975 |
| Housing and Community Development (Local) | 1 | $4,754 | $57,048 | 0 | $0 |
| Other Government Administration | 0 | $0 | 2 | $5,453 | |
| Fire - Other | 0 | $0 | 2 | $2,379 | |
| Totals for Government | 210 | $841,549 | $48,089 | 33 | $25,859 |
Jasper government finances - Expenditure in 2021 (per resident):
- Construction - General - Other: $3,323,000 ($231.76)
- Current Operations - Police Protection: $3,756,000 ($261.96)
General - Other: $3,414,000 ($238.11)
Regular Highways: $2,810,000 ($195.98)
Local Fire Protection: $2,137,000 ($149.04)
Parks and Recreation: $2,073,000 ($144.58)
Solid Waste Management: $1,622,000 ($113.13)
Central Staff Services: $1,111,000 ($77.49)
Correctional Institutions: $583,000 ($40.66)
Judicial and Legal Services: $278,000 ($19.39)
Miscellaneous Commercial Activities - Other: $19,000 ($1.33)
- General - Interest on Debt: $2,413,000 ($168.29)
- Intergovernmental to Local - Other - General - Other: $2,742,000 ($191.24)
- Total Salaries and Wages: $1,004,000 ($70.02)
Jasper government finances - Revenue in 2021 (per resident):
- Charges - Solid Waste Management: $1,748,000 ($121.91)
Other: $494,000 ($34.45)
Miscellaneous Commercial Activities: $33,000 ($2.30)
- Miscellaneous - Donations From Private Sources: $598,000 ($41.71)
Fines and Forfeits: $389,000 ($27.13)
Rents: $132,000 ($9.21)
General Revenue - Other: $99,000 ($6.90)
Interest Earnings: $52,000 ($3.63)
- State Intergovernmental - Other: $140,000 ($9.76)
General Local Government Support: $74,000 ($5.16)
- Tax - General Sales and Gross Receipts: $16,656,000 ($1161.67)
Other License: $4,337,000 ($302.48)
Property: $3,422,000 ($238.67)
Alcoholic Beverage Sales: $913,000 ($63.68)
Motor Fuels Sales: $684,000 ($47.71)
Other Selective Sales: $684,000 ($47.71)
Public Utilities Sales: $228,000 ($15.90)
Tobacco Products Sales: $228,000 ($15.90)
Jasper government finances - Debt in 2021 (per resident):
- Long Term Debt - Beginning Outstanding - Unspecified Public Purpose: $63,698,000 ($4442.60)
Outstanding Unspecified Public Purpose: $61,521,000 ($4290.77)
Retired Unspecified Public Purpose: $2,178,000 ($151.90)
Jasper government finances - Cash and Securities in 2021 (per resident):
- Bond Funds - Cash and Securities: $1,380,000 ($96.25)
- Other Funds - Cash and Securities: $13,493,000 ($941.07)
- Sinking Funds - Cash and Securities: $289,000 ($20.16)
| Businesses in Jasper, AL | ||||
| Name | Count | Name | Count | |
|---|---|---|---|---|
| AT&T | 2 | La-Z-Boy | 1 | |
| Ace Hardware | 1 | Lane Furniture | 2 | |
| Advance Auto Parts | 1 | Little Caesars Pizza | 1 | |
| Arby's | 1 | Maurices | 1 | |
| AutoZone | 1 | McDonald's | 2 | |
| Bath & Body Works | 1 | New Balance | 1 | |
| Burger King | 1 | Nike | 2 | |
| CVS | 1 | Papa John's Pizza | 1 | |
| Chevrolet | 1 | Penske | 1 | |
| Chick-Fil-A | 2 | Pizza Hut | 1 | |
| Curves | 1 | RadioShack | 1 | |
| DHL | 1 | Ruby Tuesday | 1 | |
| Dairy Queen | 1 | Rue21 | 1 | |
| Days Inn | 1 | Ryan's Grill | 1 | |
| Domino's Pizza | 1 | SONIC Drive-In | 1 | |
| FedEx | 4 | Sears | 1 | |
| Ford | 1 | Subway | 3 | |
| GNC | 1 | Super 8 | 1 | |
| GameStop | 1 | T-Mobile | 1 | |
| H&R Block | 2 | Taco Bell | 1 | |
| Hardee's | 1 | Toyota | 1 | |
| Holiday Inn | 1 | U-Haul | 5 | |
| Home Depot | 1 | UPS | 3 | |
| Honda | 1 | Vans | 1 | |
| Hyundai | 1 | Waffle House | 1 | |
| JCPenney | 1 | Walgreens | 1 | |
| KFC | 1 | Walmart | 1 | |
| Kmart | 1 | Wendy's | 1 | |
Strongest AM radio stations in Jasper:
- WZPQ (1360 AM; 1 kW; JASPER, AL; Owner: JAMES T. LEE)
- WTID (1240 AM; 1 kW; JASPER, AL; Owner: NEW CENTURY RADIO, INC.)
- WJOX (690 AM; 50 kW; BIRMINGHAM, AL; Owner: CITADEL BROADCASTING COMPANY)
- WAPI (1070 AM; 50 kW; BIRMINGHAM, AL; Owner: CITADEL BROADCASTING COMPANY)
- WCOC (1010 AM; 5 kW; DORA, AL; Owner: AZTECA COMMUNICATIONS OF ALABAMA, INC.)
- WDJC (850 AM; 50 kW; BIRMINGHAM, AL; Owner: KIMTRON, INC.)
- WNSI (810 AM; 50 kW; JACKSONVILLE, AL; Owner: UNITED BROADCASTING NETWORK, INC.)
- WLOR (1550 AM; 50 kW; HUNTSVILLE, AL; Owner: BCA RADIO, LLC)
- WCPC (940 AM; 50 kW; HOUSTON, MS; Owner: WCPC BROADCASTING CO., INC.)
- WERC (960 AM; 5 kW; BIRMINGHAM, AL; Owner: CAPSTAR TX LIMITED PARTNERSHIP)
- WRJS (1320 AM; 5 kW; BIRMINGHAM, AL; Owner: CXR HOLDINGS, INC.)
- WKXM (1300 AM; 5 kW; WINFIELD, AL; Owner: AD-MEDIA MANAGEMENT CORP.)
- WWAM (820 AM; daytime; 50 kW; JASPER, TN; Owner: SHELTON BROADCASTING SYSTEM)
Strongest FM radio stations in Jasper:
- WFFN (95.3 FM; CORDOVA, AL; Owner: NEW CENTURY RADIO, INC.)
- WDXB (102.5 FM; JASPER, AL; Owner: CAPSTAR TX LIMITED PARTNERSHIP)
- WYDE-FM (101.1 FM; CULLMAN, AL; Owner: KIMTRON, INC.)
- WQOP-FM (92.5 FM; DORA, AL; Owner: QUEEN OF PEACE RADIO, INC.)
- WODL (97.3 FM; HOMEWOOD, AL; Owner: CXR HOLDINGS, INC.)
- WBHK (98.7 FM; WARRIOR, AL; Owner: CXR HOLDINGS, INC.)
- WZZK-FM (104.7 FM; BIRMINGHAM, AL; Owner: CXR HOLDINGS, INC.)
- WBPT (106.9 FM; BIRMINGHAM, AL; Owner: CXR HOLDINGS, INC.)
- WRAX (107.7 FM; BIRMINGHAM, AL; Owner: CITADEL BROADCASTING COMPANY)
- WYSF (94.5 FM; BIRMINGHAM, AL; Owner: CITADEL BROADCASTING COMPANY)
- WBHM (90.3 FM; BIRMINGHAM, AL; Owner: BD OF TRUSTEES/U OF AL AT BIRMINGHAM)
- WMJJ (96.5 FM; BIRMINGHAM, AL; Owner: CAPSTAR TX LIMITED PARTNERSHIP)
- WQEN (103.7 FM; GADSDEN, AL; Owner: CAPSTAR TX LIMITED PARTNERSHIP)
- WZRR (99.5 FM; BIRMINGHAM, AL; Owner: CITADEL BROADCASTING COMPANY)
- WDJC-FM (93.7 FM; BIRMINGHAM, AL; Owner: KIMTRON, INC.)
- WBFR (89.5 FM; BIRMINGHAM, AL; Owner: FAMILY STATIONS, INC.)
TV broadcast stations around Jasper:
- W55BJ (Channel 55; JASPER, AL; Owner: COMBS BROADCASTING, INC.)
- W66CN (Channel 66; JASPER, AL; Owner: TRINITY BROADCASTING NETWORK)
- WDBB (Channel 17; BESSEMER, AL; Owner: WDBB-TV, INC.)
- WCFT-TV (Channel 33; TUSCALOOSA, AL; Owner: TV ALABAMA, INCORPORATED)
- W23AK (Channel 23; JASPER, AL; Owner: WMTY, INC.)
- WIAT (Channel 42; BIRMINGHAM, AL; Owner: MEDIA GENERAL COMMUNICATIONS, INC.)
- WBIQ (Channel 10; BIRMINGHAM, AL; Owner: ALABAMA EDUCATIONAL TELEVISION COMMISSION)
- WABM (Channel 68; BIRMINGHAM, AL; Owner: BIRMINGHAM (WABM-TV) LICENSEE, INC.)
- WTTO (Channel 21; HOMEWOOD, AL; Owner: WTTO LICENSEE, LLC)
- WBRC (Channel 6; BIRMINGHAM, AL; Owner: WBRC LICENSE, INC.)
- WVTM-TV (Channel 13; BIRMINGHAM, AL; Owner: BIRMINGHAM BROADCASTING (WVTM-TV), LLC)
- WSFG-LP (Channel 63; BERRY, AL; Owner: ETTIE CLARK)
- WSSF-LP (Channel 58; BERRY, AL; Owner: ETTIE CLARK)
- National Bridge Inventory (NBI) Statistics
- 95Number of bridges
- 1,427ft / 435mTotal length
- $206,856,000Total costs
- 610,307Total average daily traffic
- 92,842Total average daily truck traffic
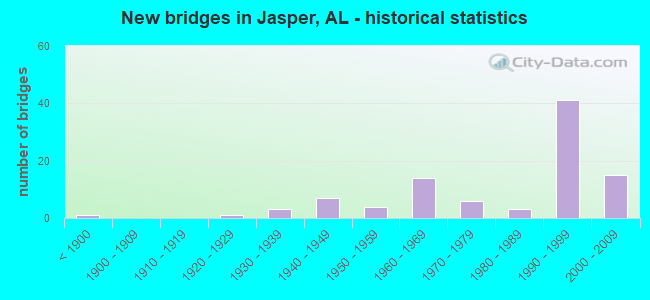
- New bridges - historical statistics
- 1Before 1900
- 11920-1929
- 31930-1939
- 71940-1949
- 41950-1959
- 141960-1969
- 61970-1979
- 31980-1989
- 411990-1999
- 152000-2009
FCC Registered Antenna Towers: 399 (See the full list of FCC Registered Antenna Towers)
FCC Registered Private Land Mobile Towers: 5 (See the full list of FCC Registered Private Land Mobile Towers in Jasper, AL)
FCC Registered Broadcast Land Mobile Towers: 56 (See the full list of FCC Registered Broadcast Land Mobile Towers)
FCC Registered Microwave Towers: 44 (See the full list of FCC Registered Microwave Towers in this town)
FCC Registered Paging Towers: 7 (See the full list of FCC Registered Paging Towers)
FCC Registered Maritime Coast & Aviation Ground Towers: 6 (See the full list of FCC Registered Maritime Coast & Aviation Ground Towers)
FCC Registered Amateur Radio Licenses: 213 (See the full list of FCC Registered Amateur Radio Licenses in Jasper)
FAA Registered Aircraft: 65 (See the full list of FAA Registered Aircraft in Jasper)
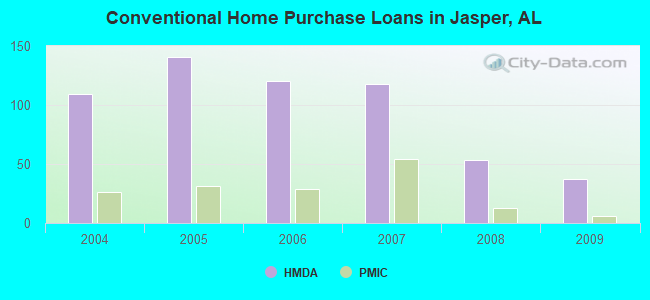
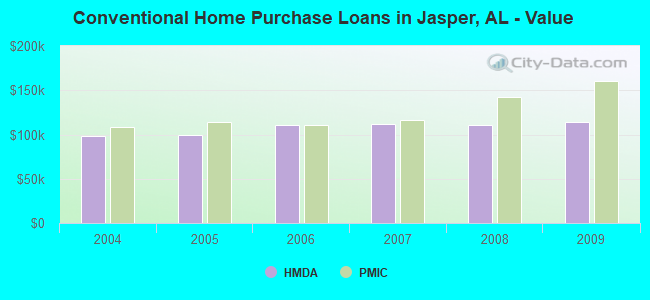
| Home Mortgage Disclosure Act Aggregated Statistics For Year 2009 (Based on 4 partial tracts) | ||||||||||||||
| A) FHA, FSA/RHS & VA Home Purchase Loans | B) Conventional Home Purchase Loans | C) Refinancings | D) Home Improvement Loans | E) Loans on Dwellings For 5+ Families | F) Non-occupant Loans on < 5 Family Dwellings (A B C & D) | G) Loans On Manufactured Home Dwelling (A B C & D) | ||||||||
|---|---|---|---|---|---|---|---|---|---|---|---|---|---|---|
| Number | Average Value | Number | Average Value | Number | Average Value | Number | Average Value | Number | Average Value | Number | Average Value | Number | Average Value | |
| LOANS ORIGINATED | 24 | $120,014 | 37 | $114,651 | 147 | $137,258 | 19 | $38,873 | 1 | $66,150 | 23 | $41,948 | 8 | $27,420 |
| APPLICATIONS APPROVED, NOT ACCEPTED | 3 | $100,180 | 3 | $93,777 | 11 | $107,805 | 2 | $66,990 | 0 | $0 | 2 | $47,040 | 1 | $80,650 |
| APPLICATIONS DENIED | 10 | $123,812 | 14 | $132,842 | 60 | $143,437 | 10 | $24,172 | 0 | $0 | 4 | $250,258 | 10 | $56,891 |
| APPLICATIONS WITHDRAWN | 6 | $136,127 | 6 | $109,247 | 42 | $147,612 | 1 | $93,190 | 0 | $0 | 3 | $100,223 | 1 | $147,780 |
| FILES CLOSED FOR INCOMPLETENESS | 1 | $119,940 | 1 | $32,170 | 5 | $220,422 | 1 | $91,070 | 0 | $0 | 0 | $0 | 0 | $0 |
Detailed HMDA statistics for the following Tracts: 0201.00 , 0202.00, 0203.00, 0204.00
| Private Mortgage Insurance Companies Aggregated Statistics For Year 2009 (Based on 3 partial tracts) | ||||
| A) Conventional Home Purchase Loans | B) Refinancings | |||
|---|---|---|---|---|
| Number | Average Value | Number | Average Value | |
| LOANS ORIGINATED | 6 | $160,523 | 5 | $135,824 |
| APPLICATIONS APPROVED, NOT ACCEPTED | 1 | $114,420 | 2 | $142,970 |
| APPLICATIONS DENIED | 0 | $0 | 3 | $178,290 |
| APPLICATIONS WITHDRAWN | 1 | $221,310 | 1 | $305,340 |
| FILES CLOSED FOR INCOMPLETENESS | 1 | $115,840 | 0 | $0 |
Detailed PMIC statistics for the following Tracts: 0201.00 , 0202.00, 0203.00, 0204.00
2002 - 2018 National Fire Incident Reporting System (NFIRS) incidents
- Fire incident types reported to NFIRS in Jasper, AL
- 94044.3%Outside Fires
- 85640.3%Structure Fires
- 25111.8%Mobile Property/Vehicle Fires
- 753.5%Other
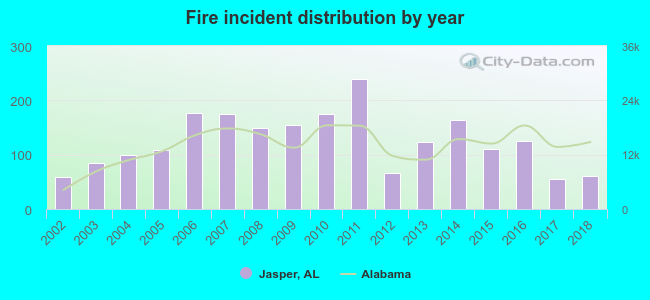 According to the data from the years 2002 - 2018 the average number of fires per year is 125. The highest number of reported fires - 240 took place in 2011, and the least - 56 in 2017. The data has a rising trend.
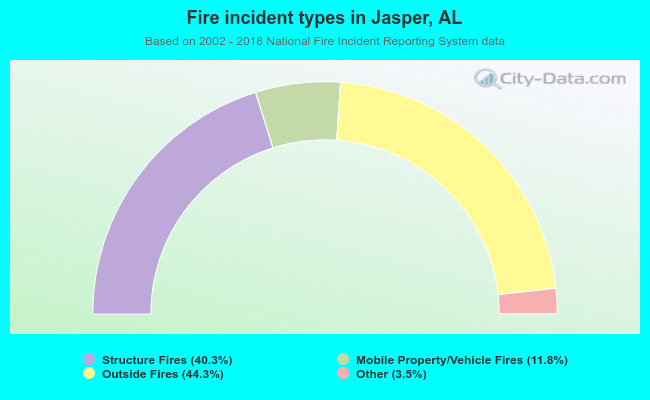 When looking into fire subcategories, the most reports belonged to: Outside Fires (44.3%), and Structure Fires (40.3%).
Fire-safe hotels and motels in Jasper, Alabama:
- Travel Rite Inn, 200 Mallway, Jasper, Alabama 35501 , Phone: (205) 221-1161, Fax: (205) 221-1161
- Quality Inn, 1100 Hwy 78, Jasper, Alabama 35501 , Phone: (205) 387-7710, Fax: (205) 387-7703
- Econolodge, 101 6TH Ave NW, Jasper, Alabama 35501 , Phone: (205) 221-7800, Fax: (205) 221-7800
- Hotel Express Inn & Suites, 202 Oak Hl Rd, Jasper, Alabama 35501 , Phone: (205) 302-6400, Fax: (205) 302-0880
- Hampton Inn, 100 Industrial Pkwy, Jasper, Alabama 35501 , Phone: (205) 221-3334, Fax: (205) 221-3339
- Sleep Inn & suites, 90 Carl Cannon Blvd, Jasper, Alabama 35501 , Phone: (205) 387-2001, Fax: (205) 387-2002
- Holiday Inn Express, 110 Industrial Pkwy, Jasper, Alabama 35501 , Phone: (205) 387-8383, Fax: (205) 387-8898
| Most common first names in Jasper, AL among deceased individuals | ||
| Name | Count | Lived (average) |
|---|---|---|
| James | 416 | 72.1 years |
| William | 297 | 72.8 years |
| John | 287 | 73.4 years |
| Mary | 197 | 78.7 years |
| Charles | 149 | 67.9 years |
| Robert | 141 | 71.1 years |
| George | 113 | 74.7 years |
| Willie | 103 | 76.9 years |
| Annie | 91 | 80.9 years |
| Thomas | 89 | 72.9 years |
| Most common last names in Jasper, AL among deceased individuals | ||
| Last name | Count | Lived (average) |
|---|---|---|
| Williams | 145 | 71.6 years |
| Smith | 142 | 73.0 years |
| Brown | 111 | 75.0 years |
| Wilson | 102 | 77.0 years |
| Jones | 97 | 75.0 years |
| Sherer | 95 | 77.0 years |
| Kilgore | 76 | 73.7 years |
| Key | 76 | 71.5 years |
| Davis | 76 | 74.7 years |
| Orear | 66 | 77.2 years |
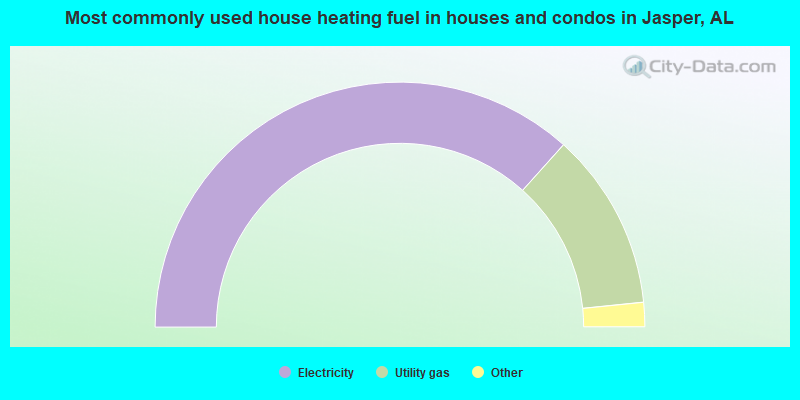
- 73.3%Electricity
- 23.5%Utility gas
- 2.1%Bottled, tank, or LP gas
- 0.5%Solar energy
- 0.4%Wood
- 0.2%No fuel used
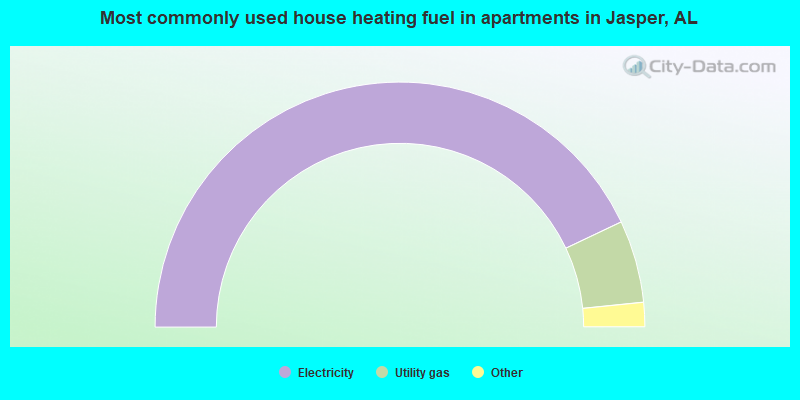
- 85.9%Electricity
- 10.9%Utility gas
- 1.3%No fuel used
- 1.2%Bottled, tank, or LP gas
- 0.6%Wood
Jasper compared to Alabama state average:
- Unemployed percentage significantly below state average.
- Black race population percentage below state average.
- Foreign-born population percentage below state average.
- Length of stay since moving in above state average.
- Institutionalized population percentage above state average.
Jasper on our top lists:
- #98 on the list of "Top 101 cities with the largest percentage of people in hospitals or wards for drug/alcohol abuse (population 1,000+)"
- #3 on the list of "Top 101 counties with the highest number of deaths per 1000 residents 2007-2013 (pop. 50,000+)"
- #8 on the list of "Top 101 counties with the smallest number of children under 18 without health insurance coverage in 2000 (pop. 50,000+)"
- #13 on the list of "Top 101 counties with the smallest number of people without health insurance coverage in 2000 (pop. 50,000+)"
- #32 on the list of "Top 101 counties with highest percentage of residents voting for Romney (Republican) in the 2012 Presidential Election (pop. 50,000+)"
- #38 on the list of "Top 101 counties with the lowest ground withdrawal of fresh water for public supply (pop. 50,000+)"

|
|
Total of 21 patent applications in 2008-2024.